Chapter Key Messages
Ocean Temperature
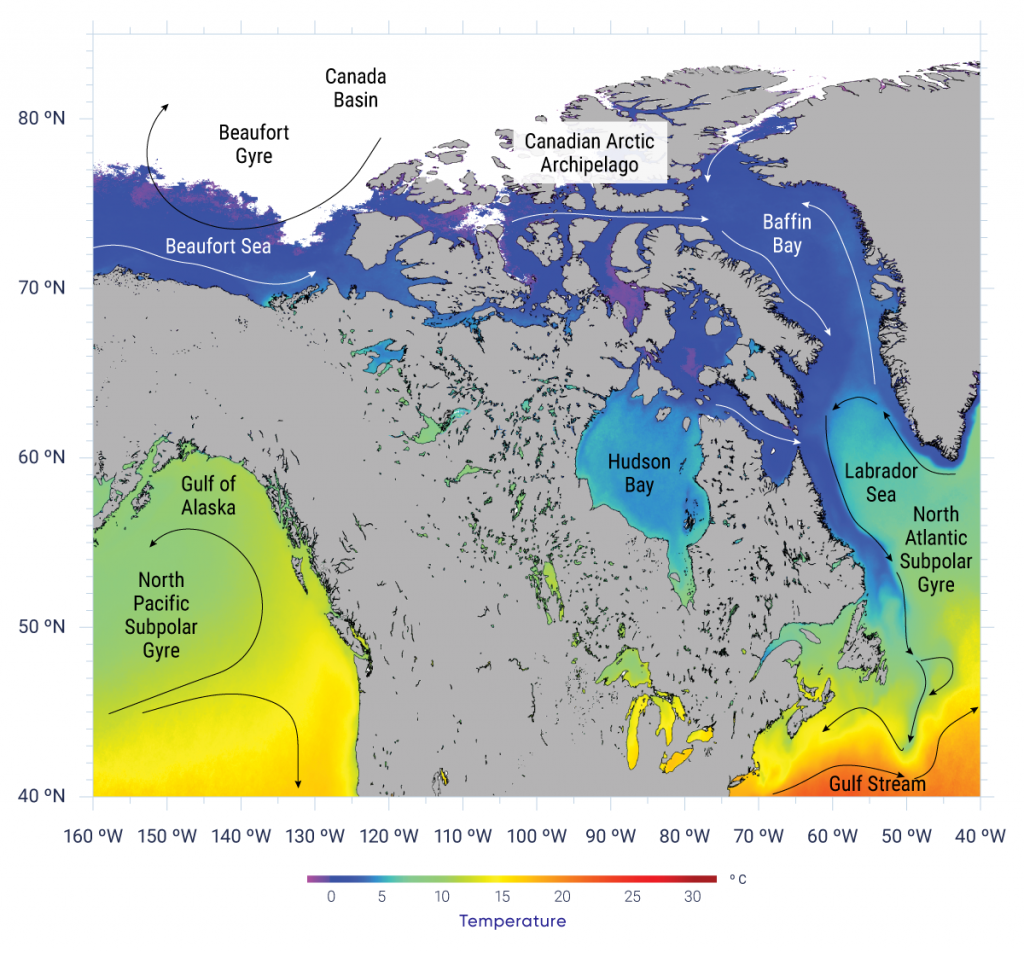
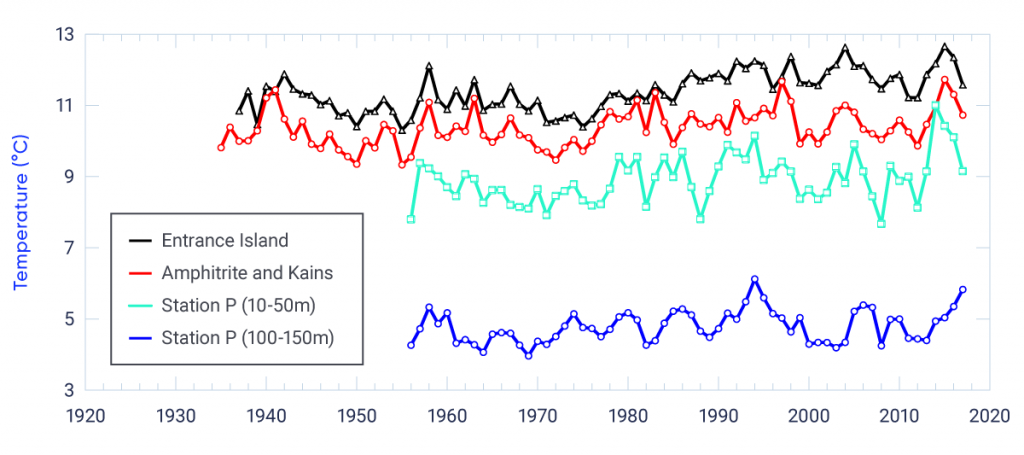
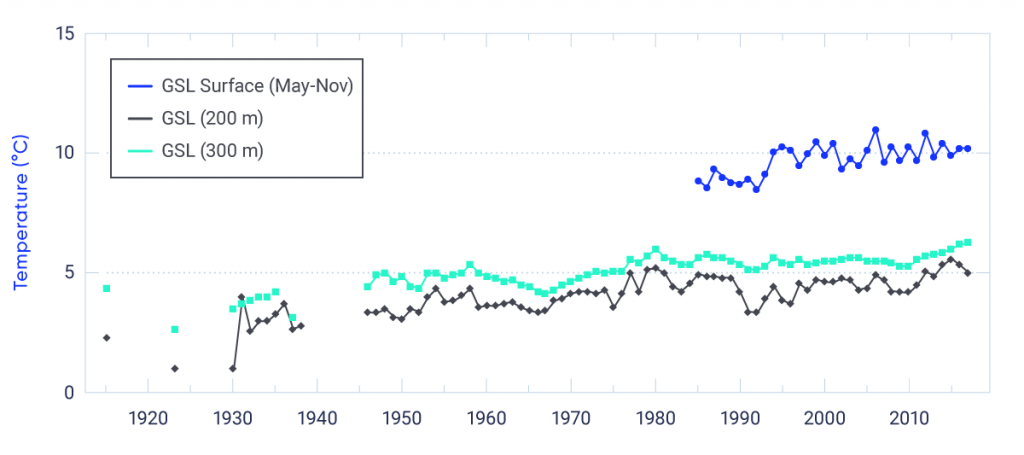
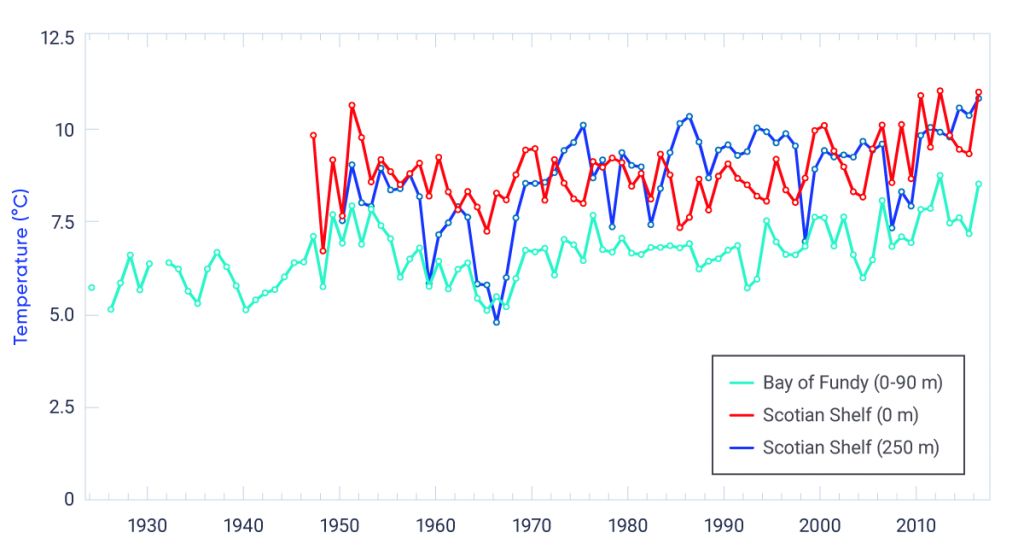
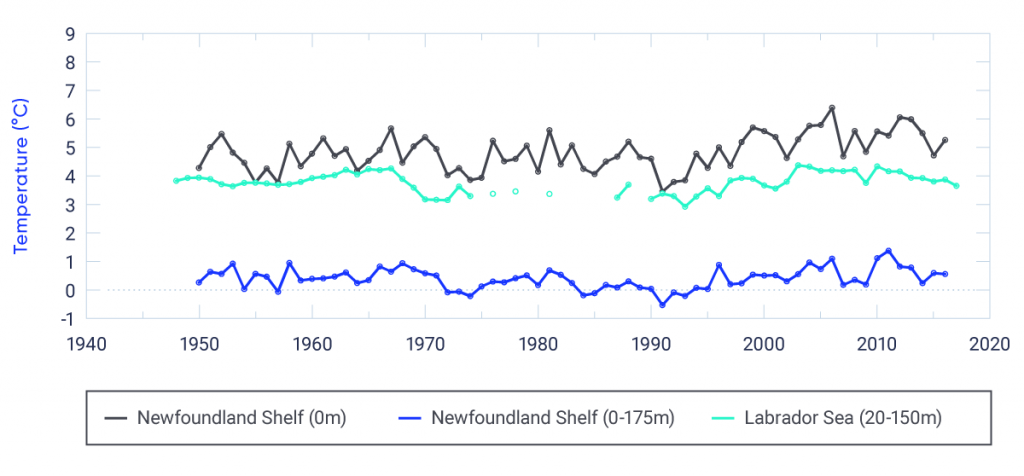
Upper-ocean temperature has increased in the Northeast Pacific and most areas of the Northwest Atlantic over the last century, consistent with anthropogenic climate change (high confidence). The upper ocean has warmed in the Canadian Arctic in summer and fall as a result of increases in air temperature and declines in sea ice (medium confidence).
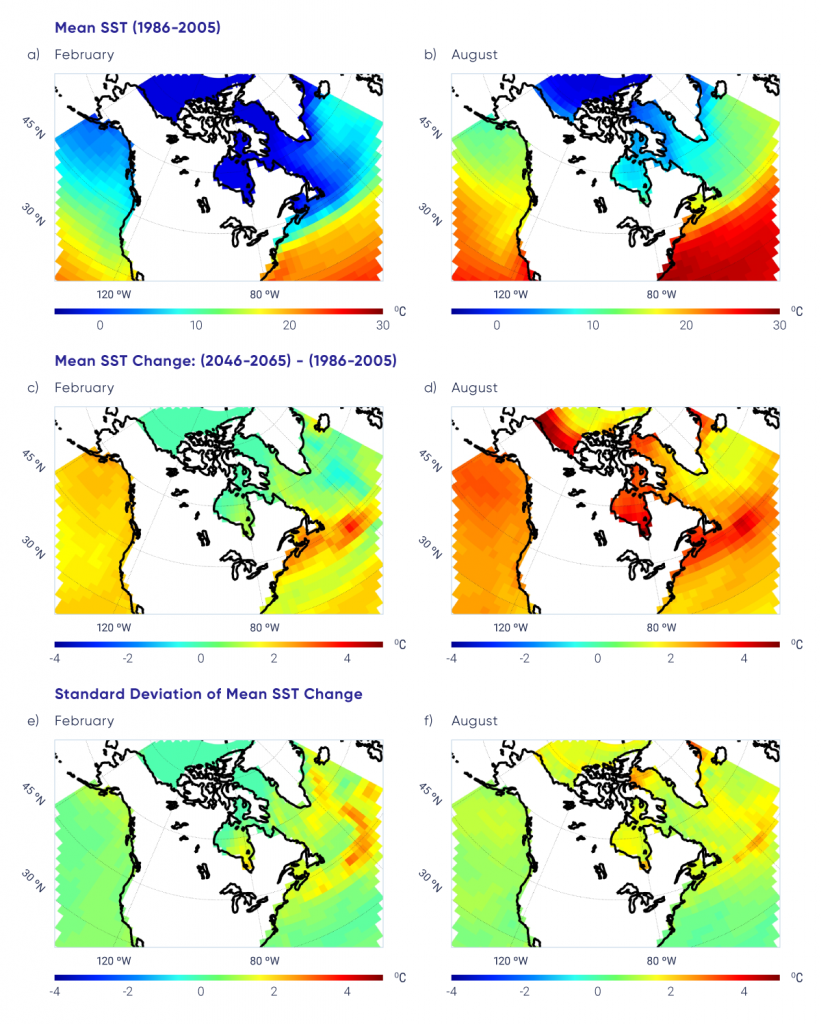
Oceans surrounding Canada are projected to continue to warm over the 21st century in response to past and future emissions of greenhouse gases. The warming in summer will be greatest in the ice-free areas of the Arctic and off southern Atlantic Canada, where subtropical water is projected to shift further north (medium confidence). During winter in the next few decades, the upper ocean surrounding Atlantic Canada will warm the most, the Northeast Pacific will experience intermediate warming rates, and the Arctic and eastern sub-Arctic ocean areas (including Hudson Bay and Labrador Sea) will warm the least (medium confidence).
Ocean Salinity and Density Stratification
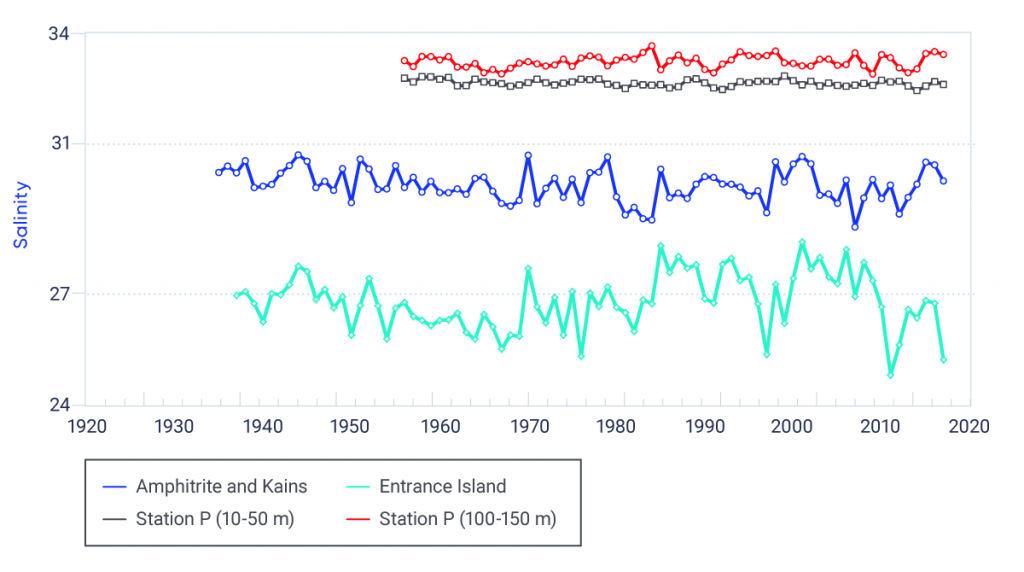
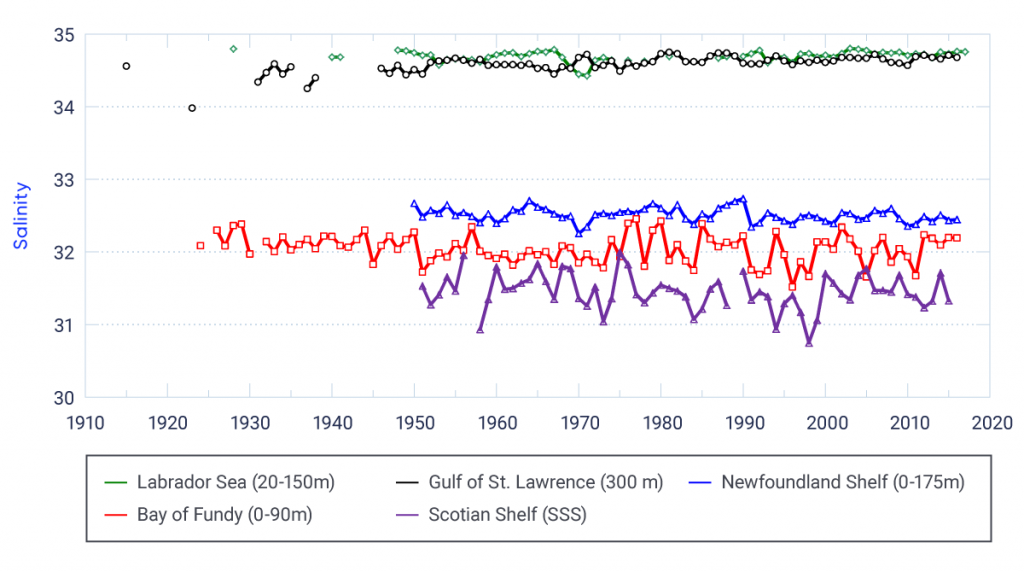
There has been a slight long-term freshening of upper-ocean waters in most areas off Canada as a result of various factors related to anthropogenic climate change, in addition to natural decadal-scale variability (medium confidence). Salinity has increased below the surface in some mid-latitude areas, indicating a northward shift of saltier subtropical water (medium confidence).
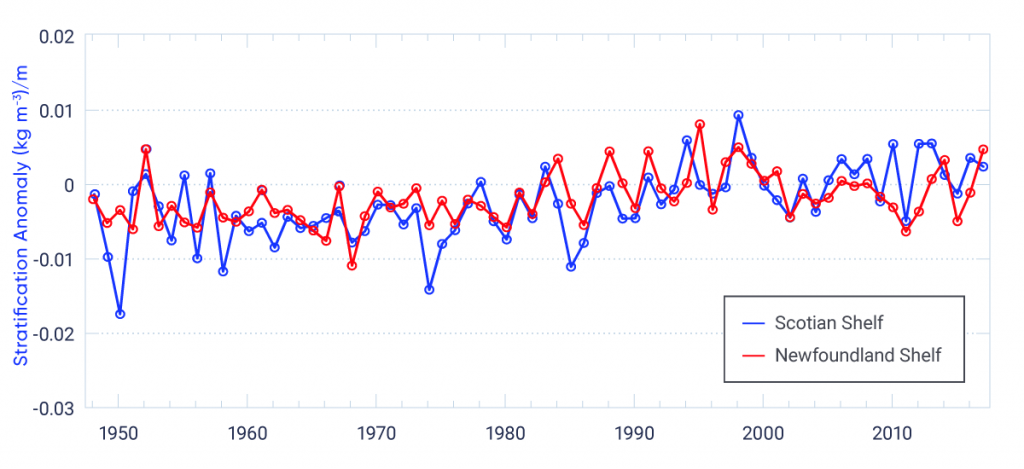
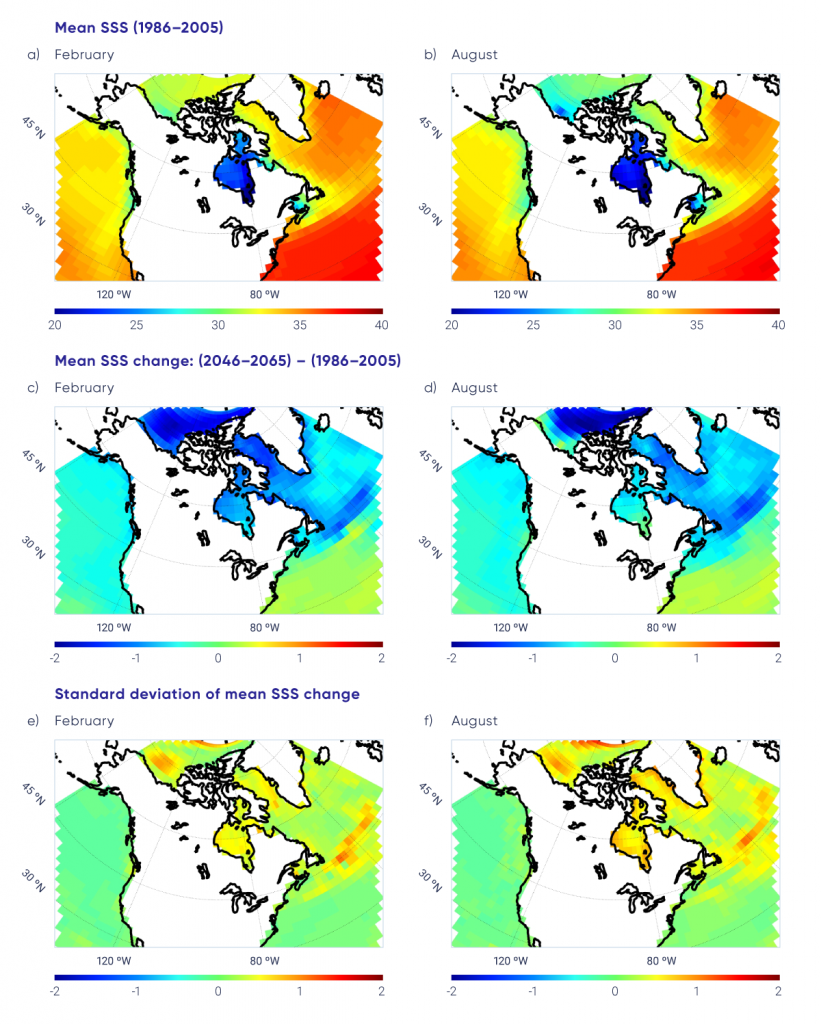
Freshening of the ocean surface is projected to continue in most areas off Canada over the rest of this century under a range of emission scenarios, due to increases in precipitation and melting of land and sea ice (medium confidence). However, increases in salinity are expected in off-shelf waters south of Atlantic Canada due to the northward shift of subtropical water (medium confidence). The upper-ocean freshening and warming is expected to increase the vertical stratification of water density, which will affect ocean sequestration of greenhouse gases, dissolved oxygen levels, and marine ecosystems.
Marine Winds, Storms, and Waves
Surface wave heights and the duration of the wave season in the Canadian Arctic have increased since 1970 and are projected to continue to increase over this century as sea ice declines (high confidence). Off Canada’s east coast, areas that currently have seasonal sea ice are also anticipated to experience increased wave activity in the future, as seasonal ice duration decreases (medium confidence).
A slight northward shift of storm tracks, with decreased wind speed and lower wave heights off Atlantic Canada, has been observed and is projected to continue in future (low confidence). Off the Pacific coast of Canada, wave heights have been observed to increase in winter and decrease in summer, and these trends are projected to continue in future (low confidence).
Sea Level
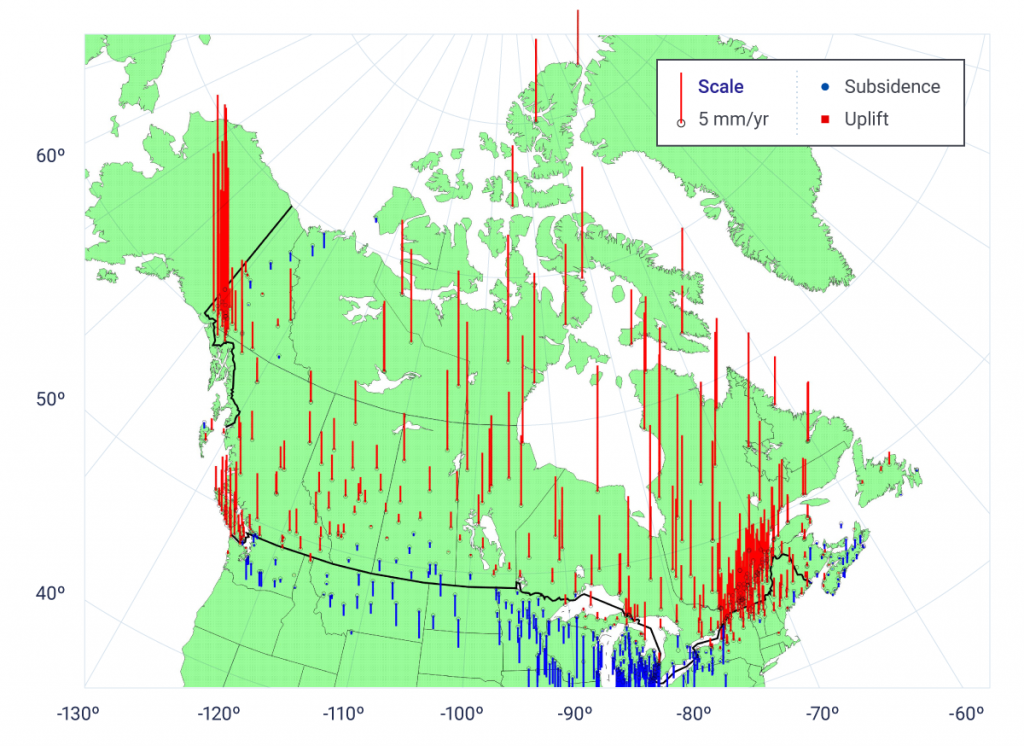
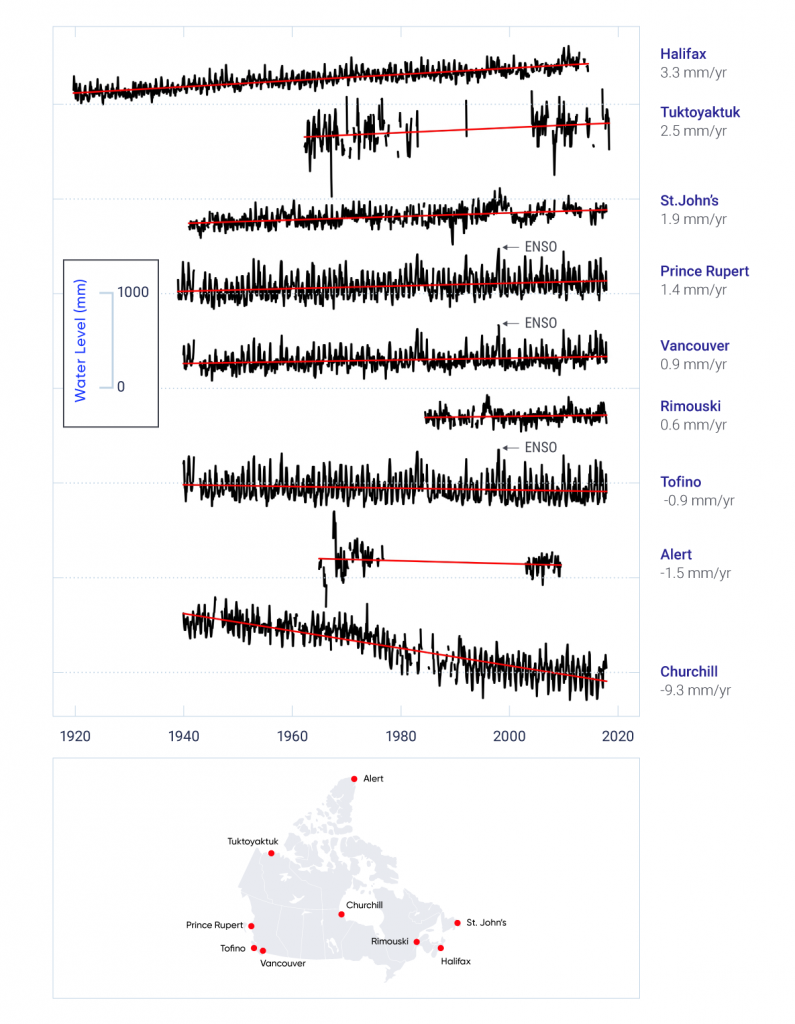
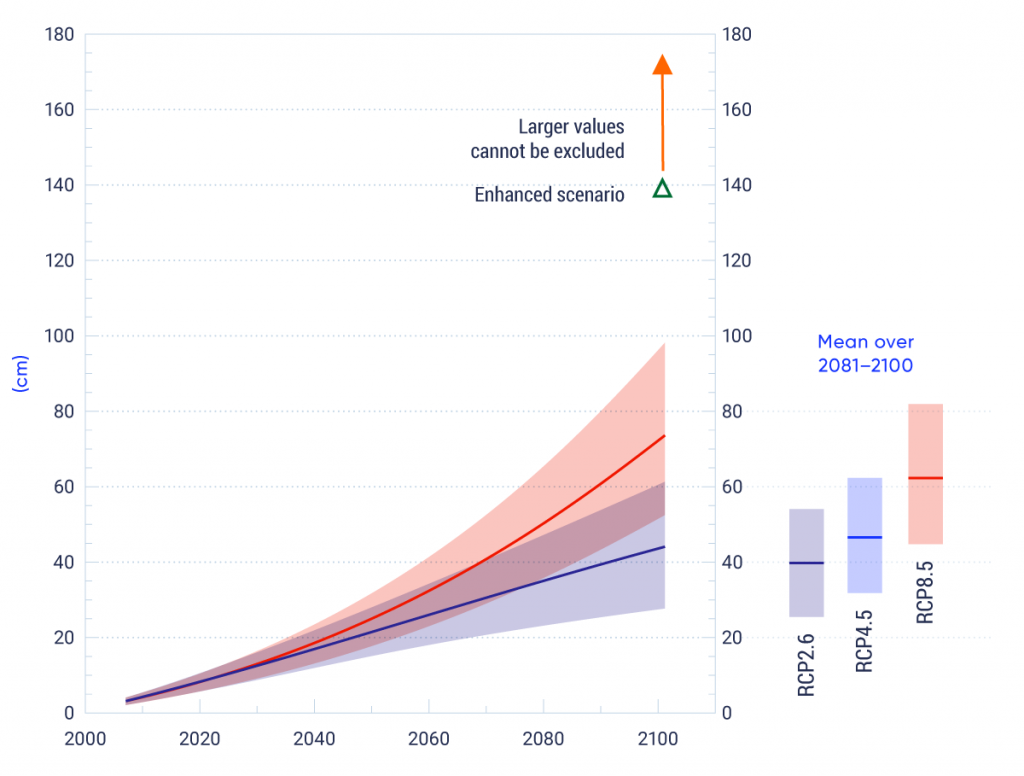
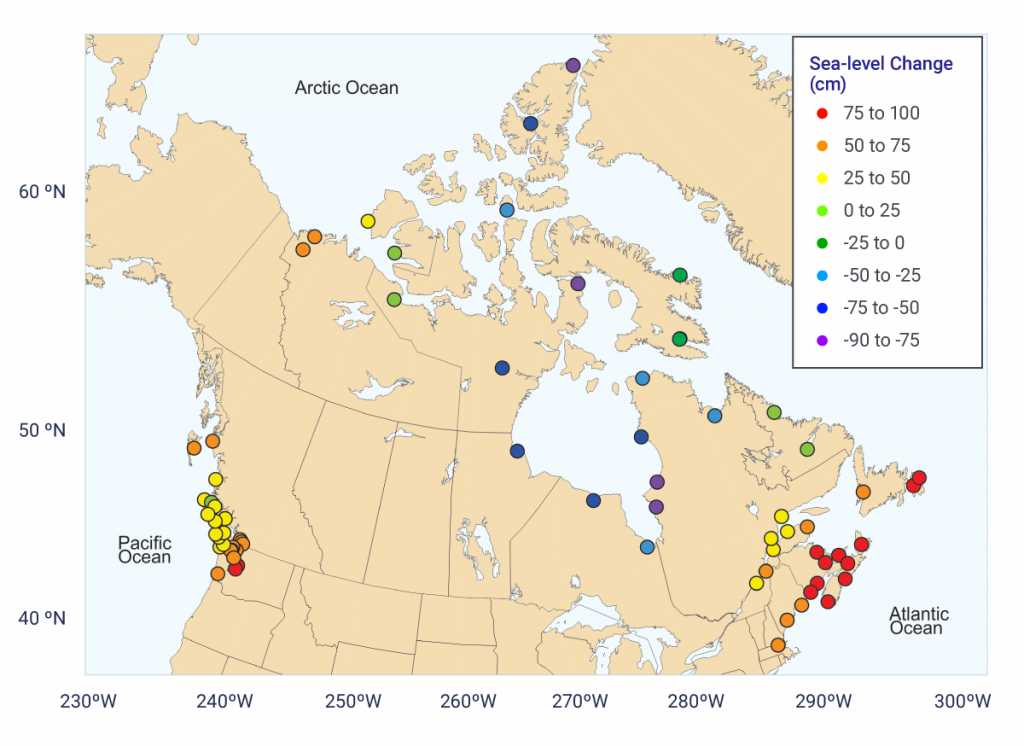
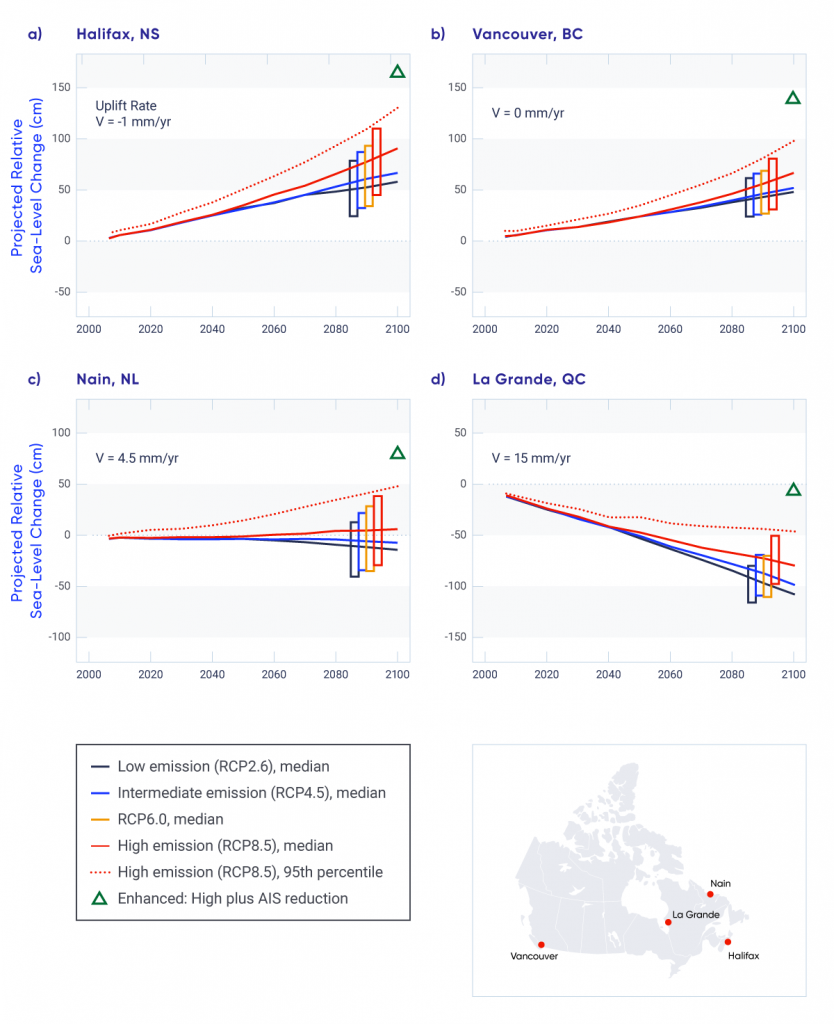
Globally, sea level has risen, and is projected to continue to rise. The projected amount of global sea-level rise in the 21st century is many tens of centimetres and it may exceed one metre. However, relative sea level in different parts of Canada is projected to rise or fall, depending on local vertical land motion. Due to land subsidence, parts of Atlantic Canada are projected to experience relative sea-level change higher than the global average during the coming century (high confidence).
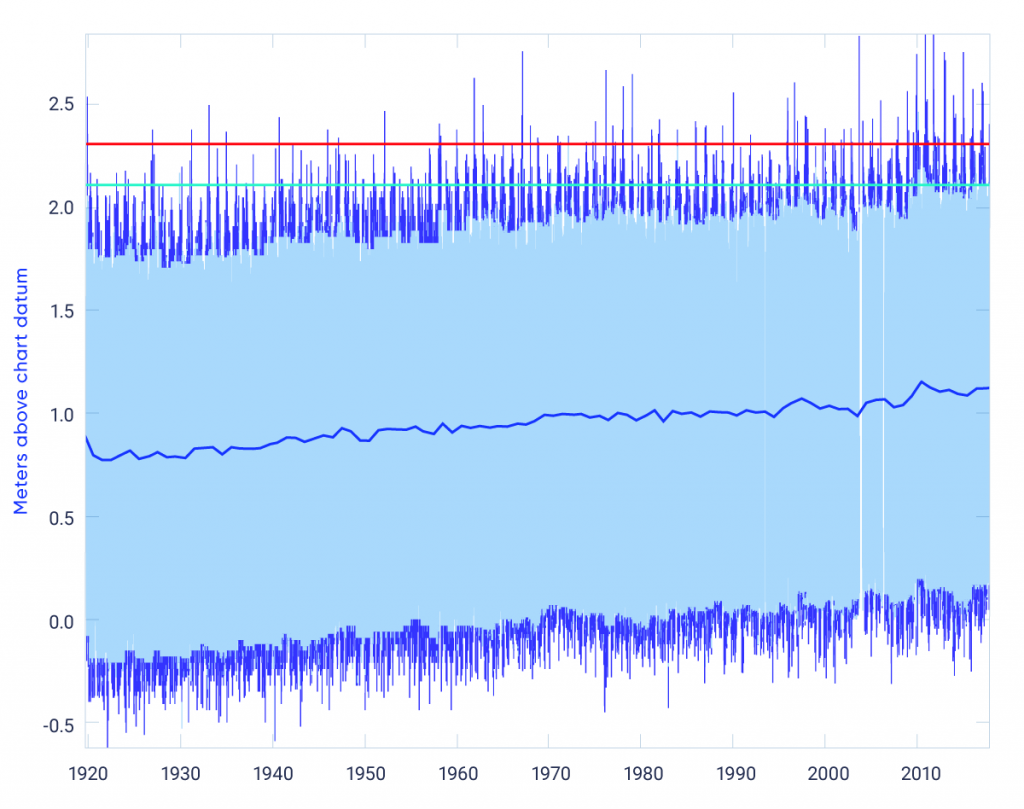
Where relative sea level is projected to rise (most of the Atlantic and Pacific coasts and the Beaufort coast in the Arctic), the frequency and magnitude of extreme high water-level events will increase (high confidence). This will result in increased flooding, which is expected to lead to infrastructure and ecosystem damage as well as coastline erosion, putting communities at risk. Adaptation actions need to be tailored to local projections of relative sea-level change.
Extreme high water-level events are expected to become larger and occur more often in areas where, and in seasons when, there is increased open water along Canada’s Arctic and Atlantic coasts, as a result of declining sea ice cover, leading to increased wave action and larger storm surges (high confidence).
Ocean Chemistry
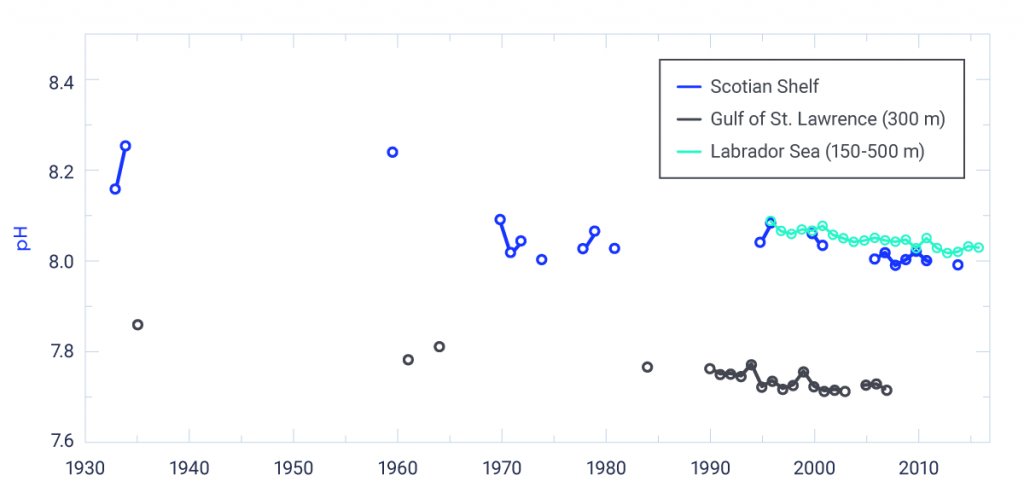
Increasing acidity (decreasing pH) of the upper-ocean waters surrounding Canada has been observed, consistent with increased carbon dioxide uptake from the atmosphere (high confidence). This trend is expected to continue, with acidification occurring most rapidly in the Arctic Ocean (high confidence).
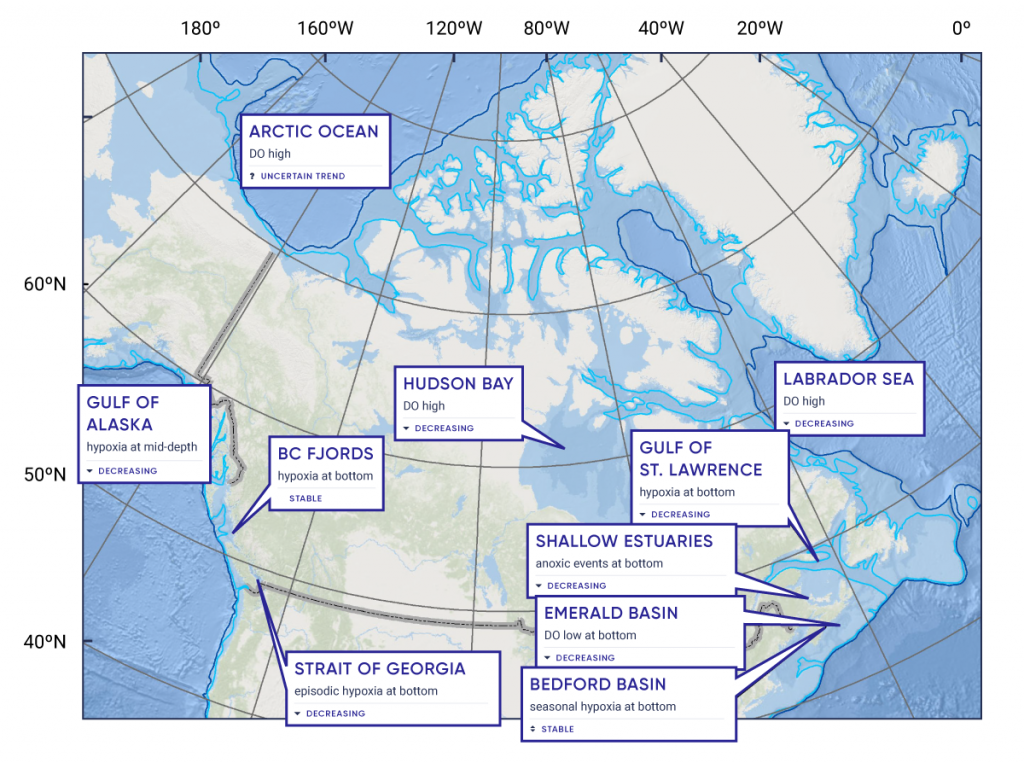
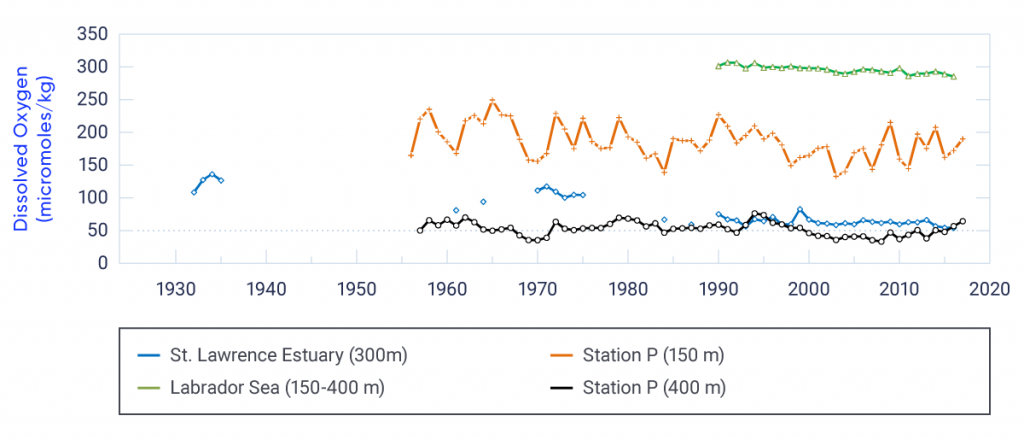
Subsurface oxygen concentrations have decreased in the Northeast Pacific and Northwest Atlantic oceans off Canada (high confidence). Increased upper-ocean temperature and density stratification associated with anthropogenic climate change have contributed to this decrease (medium confidence). Low subsurface oxygen conditions will become more widespread and detrimental to marine life in future, as a result of continuing climate change (medium confidence).
Nutrient supply to the ocean-surface layer has generally decreased in the North Pacific Ocean, consistent with increasing upper-ocean stratification (medium confidence). No consistent pattern of nutrient change has been observed for the Northwest Atlantic Ocean off Canada. There are no long-term nutrient data available for the Canadian Arctic.