Chapter 6

Changes in Freshwater Availability Across Canada

This chapter assesses past and future climate-related changes to surface runoff (streamflow), surface water levels (lakes and wetlands), soil moisture and drought, and groundwater in Canada.

Recommended citation

Bonsal, B.R., Peters, D.L., Seglenieks, F., Rivera, A., and Berg, A. (2019): Changes in freshwater availability across Canada; Chapter 6 in Canada’s Changing Climate Repor t, (ed.) E. Bush and D.S. Lemmen; Government of Canada, Ottawa, Ontario, p. 261-342.

Authors

  • Barrie R. Bonsal (Environment and Climate Change Canada)
  • Daniel L. Peters (Environment and Climate Change Canada)
  • Frank Seglenieks (Environment and Climate Change Canada)
  • Alfonso Rivera (Natural Resources Canada)
  • Aaron Berg (University of Guelph)
Figure-6.1
View details
Figure-6.2
View details
Figure-6.3
View details
Figure-6.4
View details
Figure-6.5
View details
Figure-6.6
View details
Figure-6.7
View details
Figure-6.8
View details
Figure-6.9
View details
Interactive Figure 6.10
View details
Interactive Figure 6.11
View details
Figure-6.12
View details
Figure-6.13
View details
Figure-6.14
View details
Figure-6.15
View details
Figure-6.16
View details
Figure-6.17
View details
Figure-6.18
View details
Figure-6.19
View details

Chapter Key Messages

Surface Runoff: Streamflow

The seasonal timing of peak streamflow has shifted, driven by warming temperatures. Over the last several decades in Canada, spring peak streamflow following snowmelt has occurred earlier, with higher winter and early spring flows (high confidence1). In some areas, reduced summer flows have been observed (medium confidence). These seasonal changes are projected to continue, with corresponding shifts from more snowmelt-dominated regimes toward rainfall-dominated regimes (high confidence). 

There have been no consistent trends in annual streamflow amounts across Canada as a whole. In the future, annual flows are projected to increase in most northern basins but decrease in southern interior continental regions (medium confidence).

Streamflow-related floods result from many factors, and in Canada these mainly include excess precipitation, snowmelt, ice jams, rain-on-snow, or a combination of these factors. There have been no spatially consistent trends in these flood-causing factors or in flooding events across the country as a whole. Projected increases in extreme precipitation are expected to increase the potential for future urban flooding (high confidence). Projected higher temperatures will result in a shift toward earlier floods associated with spring snowmelt, ice jams, and rain-on-snow events (medium confidence). It is uncertain how projected higher temperatures and reductions in snow cover will combine to affect the frequency and magnitude of future snowmelt-related flooding.

Surface Water Levels: Lakes and Wetlands

In regions of Canada where there are sufficient data, there is no indication of long-term changes to lake and wetland levels. Future levels may decline in southern Canada, where increased evaporation may exceed increased precipitation (low confidence). Projected warming and thawing permafrost has the potential to cause future changes, including rapid drainage, in many northern Canadian lakes (medium confidence).

Soil Moisture and Drought

Periodic droughts have occurred across much of Canada, but no long-term changes are evident. Future droughts and soil moisture deficits are projected to be more frequent and intense across the southern Canadian Prairies and interior British Columbia during summer, and to be more prominent at the end of the century under a high emission scenario (medium confidence).

Groundwater

The complexity of groundwater systems and a lack of information make it difficult to assess whether groundwater levels have changed since records began. It is expected that projected changes to temperature and precipitation will influence future groundwater levels; however, the magnitude and even direction of change is not clear. Spring recharge of groundwater aquifers over most of the country is anticipated to occur earlier in the future, as a result of earlier snowmelt (medium confidence).


Summary

Freshwater availability in Canada is influenced by a multitude of factors: some natural, some as a result of human activity. Changes in precipitation and temperature have a strong influence, both directly and indirectly, through changes to snow, ice, and permafrost. Disturbances of the water cycle by humans (dams, diversions, and withdrawals) make it difficult to discern climate-related changes. Direct measurements of freshwater availability indicators are inconsistent across the country and, in some cases, too sparse to evaluate past changes. In addition, future changes are determined from a multitude of hydrological models, using output from numerous climate models with different emission scenarios. These factors make it challenging to conduct a pan-Canadian assessment of freshwater availability, and even more difficult to determine whether past changes can be attributed to anthropogenic climate change. In this chapter, national and regional studies are considered, along with information on changes in temperature and precipitation from Chapter 4 and changes to the cryosphere from Chapter 5, to assess changes to freshwater availability in Canada.

Past changes in the seasonality of streamflow have been characterized by earlier spring freshets (the increased flow resulting from snow and ice melt in the spring) due to earlier peaks in spring snowmelt, higher winter and early spring flows, and, for many regions, reduced summer flows. These changes are consistent with observed warming and related changes to snow and ice. During the last 30 to 100 years, annual streamflow magnitudes, surface water levels, soil moisture content and droughts, and shallow groundwater aquifers have, for the most part, been variable, with no clear increasing or decreasing trends. This variability corresponds to observed year-to-year and multi-year variations in precipitation, which are partly influenced by naturally occurring large-scale climate variability (see Chapter 2, Box 2.5). However, for many indicators, there is a lack of evidence (particularly in northern regions of the country) to assess Canada-wide past changes in freshwater availability.

Continued warming and associated reductions in snow cover, shrinking mountain glaciers, and accelerated permafrost thaw are expected to continue to drive changes in the seasonality of streamflow. This includes increased winter flows, even earlier spring freshets, and reduced summer flows, as well as corresponding shifts from more snowmelt-dominated regimes toward rainfall-dominated regimes. Annual streamflow is projected to increase in some areas (mainly northern regions), but decline in others (southern interior regions). Thawing permafrost could cause future changes in many northern Canadian lakes, including rapid drainage. The frequency and intensity of future streamflow-driven flooding are uncertain, because of the complexity of factors involved. Projected increases in extreme precipitation are expected to increase the potential for future urban flooding. However, it is uncertain how projected higher temperatures and reductions in snow cover will combine to affect the frequency and magnitude of future snowmelt-related flooding. Lower surface water levels of lakes and wetlands are expected, especially toward the end of this century, under higher emission scenarios (see Chapter 3, Section 3.2), due to higher temperatures and increased evaporation. However, the magnitude of these decreases will depend on how much future precipitation increases offset increased evaporation.

Future increases in drought and decreases in surface soil moisture are anticipated during summer in the southern Canadian prairies and interior British Columbia, where moisture deficits from increased evapotranspiration are projected to be greater than precipitation increases. These changes are expected to be more prominent toward the end of this century under higher emission scenarios; however, there is considerable uncertainty in their magnitude. Groundwater systems are complex, and, although it is expected that changes to temperature and precipitation will influence future levels, the magnitude and even direction of change is not clear. However, in the future, spring recharge of groundwater aquifers over most of the country is anticipated to occur earlier, as a result of earlier snowmelt.

These anticipated changes from anthropogenic climate warming will directly affect the timing and amount of future freshwater supplies, and they may be exacerbated by human management alterations to freshwater systems. The impacts are expected to be more prominent toward the end of this century under higher emission scenarios, given the larger associated climate changes. Of particular concern are impacts in regions that currently rely on snow and ice melt as freshwater sources, as well as continental interior areas, where increased evapotranspiration from warmer temperatures could reduce future water supplies. However, freshwater supplies in all regions of Canada are expected to be affected in one way or another. It is also anticipated that water-related extremes, such as droughts and floods, will intensify these impacts.

6.1

Introduction

Canada has vast amounts of freshwater, in the form of lakes, rivers, and wetlands, aquifers with groundwater reserves, as well as water stored in snowpacks, glaciers, and the soil. There are over 8500 rivers and more than 2 million lakes covering almost 9% of Canada (Monk and Baird, 2011142), while wetlands occupy an estimated 16% of the country’s landmass (National Wetlands Working Group, 1988150, 1997151). This freshwater is fundamental to the environment (e.g., aquatic ecosystems) and to many social and economic activities, including agriculture, industry, hydroelectricity generation, provision of drinking water, and recreation.

Freshwater availability is primarily governed by processes and interactions within the water cycle (see Figure 6.1). Rain or snowmelt water can run off over the land surface into lakes and streams, but direct surface runoff is rare in many natural areas, such as forests. Rather, much of the precipitation infiltrates into the ground, accumulates on the surface as snow, or fills surface water bodies, where it eventually infiltrates into the soil or evaporates. Some of the infiltrated water remains in shallow soil, where it is taken up by vegetation and transpired back to the atmosphere. Soil water may flow rapidly to streams and lakes through highly permeable subsoils or percolate down to recharge deeper groundwater aquifers. This deeper water flows to streams much more slowly, over periods ranging from days to thousands of years, depending on the permeability of the geologic formations. Human water management — including dams, reservoirs, and water withdrawals — has also become an important component of the water cycle.

Figure-6.1

The water cycle, its components, relevant processes, and interactions

Schematic diagram showing the components, processes and interactions within the water cycle. In this cycle, water that evaporates from oceans is transported over land where it falls as precipitation. This water then either moves back to the atmosphere through evapotranspiration, is stored as ice or snow, or makes its way to rivers/streams either directly and rapidly, through overland flow, or slowly, through soil and groundwater. It then eventually flows back to the ocean, where the cycle continues.
Figure-6.1

In the water cycle, water that evaporates from oceans is transported over land, where it falls as precipitation. It then either moves back to the atmosphere through evapotranspiration, is stored as ice or snow, or makes its way to rivers/streams (via various pathways), where it eventually flows back to the ocean.

Source

UK Met Office (2018).

Within the water cycle, the amount and timing of freshwater is influenced by several natural factors, including size of the watershed; type of landforms; storage characteristics (on the surface and in subsurface soil); type, rate, and amount of precipitation; presence of ice; amount of vegetation; soil properties (including permafrost); and evaporation. Each of these acts on a variety of scales in time and space. This complexity is particularly prominent in Canada, with its large land mass, diverse climate and eco-regions, and varied geology. Furthermore, much of the surface water is currently managed by humans (especially in the more heavily populated southern regions), making it difficult to separate the effects of climate from those of management.

Freshwater monitoring varies across Canada, with spatially dense monitoring at many points in some areas, but a lack of monitoring in others, especially in much of northern Canada. Most research on past and future freshwater availability is on individual large watersheds or specified geographic regions, and changes are evaluated over different periods, depending on data availability, with few Canada-wide assessments. Studies on future changes use many different hydrological models driven by output from global climate models (GCMs) and regional climate models (RCMs) (see Chapter 3, Section 3.3). As a result, assessing past and future changes of freshwater availability in a pan-Canadian context is difficult. However, freshwater is greatly influenced by surface temperature and precipitation (see Chapter 4) as well as the cryosphere (snow, glaciers, freshwater ice, and permafrost) (see Chapter 5), and there is considerable information on past and future changes in these variables across most of Canada. In much of the country, the proportion of total precipitation falling as snow is declining, the extent and duration of snow cover are decreasing, glaciers are receding, permafrost is thawing, air temperature and resulting evapotranspiration are increasing, and precipitation is increasing. These trends are projected to continue, and all affect the amount and timing of freshwater availability.

In this chapter, freshwater availability is defined as water available at the surface (streams, lakes, and wetlands), in the soil, and in aquifers (groundwater). The assessment focuses primarily on water bodies unaffected by human management, using information from federal and provincial/territorial monitoring networks. Since floods and droughts are directly related to freshwater availability, past and future changes in these events are also assessed (Chapter 6, Sections 6.2.4 and 6.4.2). Climate change impacts on water quality are not addressed in this assessment.


6.2

Surface runoff: streamflow

Key Message 1

The seasonal timing of peak streamflow has shifted, driven by warming temperatures. Over the last several decades in Canada, spring peak streamflow following snowmelt has occurred earlier, with higher winter and early spring flows (high confidence). In some areas, reduced summer flows have been observed (medium confidence). These seasonal changes are projected to continue, with corresponding shifts from more snowmelt-dominated regimes toward rainfall-dominated regimes (high confidence).

Key Message 2

There have been no consistent trends in annual streamflow amounts across Canada as a whole. In the future, annual flows are projected to increase in most northern basins but decrease in southern interior continental regions (medium confidence).

Key Message 3

Streamflow-related floods result from many factors, and in Canada these mainly include excess precipitation, snowmelt, ice jams, rain-on-snow, or a combination of these factors. There have been no spatially consistent trends in these flood-causing factors or in flooding events across the country as a whole. Projected increases in extreme precipitation are expected to increase the potential for future urban flooding (high confidence). Projected higher temperatures will result in a shift toward earlier floods associated with spring snowmelt, ice jams, and rain-on-snow events (medium confidence). It is uncertain how projected higher temperatures and reductions in snow cover will combine to affect the frequency and magnitude of future snowmelt-related flooding.

Canada has more than 8500 rivers and streams of various lengths (Monk and Baird, 2011141). Many are affected by human alterations, such as flow regulation (dams, weirs, and locks), water withdrawals, and diversions, often associated with hydroelectric facilities (CDA, 201641). Studies on climate-related past changes in streamflow rely heavily on data from streams that are not subject to these forms of human regulation (i.e., unregulated) or those with limited regulation (see Box 6.1). In a few cases, studies have attempted to account for regulation by determining naturalized flow using various hydrological models (Peters and Buttle, 2010158). Future streamflow changes are assessed using climate output (e.g., precipitation and temperature) from various GCMs and/or RCMs that provide input to a hydrological model. The multitude of climate and hydrological models used in these studies adds uncertainty to future streamflow changes (e.g., Seneviratne et al., 2012186).

6.2.1

Streamflow magnitude

Streamflow magnitude (runoff) is a key indicator for evaluating changes in surface water. It is assessed at monthly, seasonal, and annual timescales to determine changes in overall flow volumes, and on daily to weekly scales to assess high and low streamflow extremes. In all cases, pan-Canadian analyses are infrequent and, in most cases, older than regional studies. For Canada as a whole, annual streamflow trends were mixed. Significant declines occurred at 11% of stations and significant increases at 4% of stations for the 1967–1996 period. Most decreases were in southern Canada (Zhang et al., 2001239; similar results in Burn and Hag Elnur, 200228). Seasonal runoff over the 1970–2005 period, in most of the 172 stations evaluated, was dominated by natural variability. Twelve per cent of stations showed significant increases in winter runoff (December to February), while only 5% had significant winter decreases. Spring and summer trends were mixed, with no spatial pattern (Monk et al., 2011142). From 1960 to 1997, significant increases in April flow occurred at almost 20% of stations, and significant decreases in summer flow (May to September) were observed at 14% of the sites (Burn and Hag Elnur, 200228). The increases in April flow were also found (25% of stations) for the longer 1950–2012 period (Vincent et al., 2015221).


Regional studies of trends in annual and seasonal streamflow magnitudes are summarized in Table 6.1. Although these individual studies use different time periods, hydrometric stations, and analysis techniques, the findings are mostly consistent with the Canada-wide analyses. Annual flows over western Canada have varied from one region to another, with both increasing and decreasing trends since approximately the 1960s and 1970s (e.g., DeBeer et al., 201657). Most declines were observed in rivers draining the eastern slopes of the central/southern Rocky Mountains, including the Athabasca, Peace, Red Deer, Elbow, and Oldman rivers (Burn et al., 2004a31; Rood et al., 2005176; Schindler and Donahue, 2006180; St. Jacques et al., 2010200; Yip et al., 2012238; Peters et al., 2013159; Bawden et al., 201410). Long-term streamflow records (over more than 30 years) from the Northwest Territories, including the Mackenzie River, indicated increasing annual flows (St. Jacques and Sauchyn, 2009197; Rood et al., 2017174). However, annual runoff from rivers draining into northern Canada as a whole (western Arctic Ocean, western Hudson and James Bay, and Labrador Sea) showed no significant trends for the period 1964–2013 (Déry et al., 201661). Rivers in Yukon, British Columbia, Ontario, and Quebec reported mixed annual trends (Fleming and Clarke, 200379; Brabets and Walvoord, 200926; Fleming, 201078; Fleming and Weber, 201280; Déry et al., 201259; Nalley et al., 2012149; Hernández-Henríquez et al., 201797).

Table 6.1

Observed trends in annual, winter, and summer streamflow magnitudes from basin-wide case studies in Canada

Watershed (west to east) Annual runoff or streamflow trend Winter runoff or streamflow trend Summer runoff or streamflow trend Source
Pan-Arctic → (no significant trend) 1964–2013 into Bering Sea, western Arctic Ocean, western Hudson and James Bay, and Labrador Sea

↑ and ↓ to the eastern Hudson and James Bay (eastern Arctic Ocean)

Déry et al. (2016)
Yukon River (YT) →1944–2005; ↑during warm Pacific Decadal Oscillation (PDO) 1976–2005 ↑1944–2005, due to warm PDO, 1976–2005 ↓ During warm PDO, 1976–2005 Brabets and Walvoord (2009)
White River, Alsek River; glacier in basins (YT) ↑1975–1999 Fleming and Clarke (2003)
Dezadeash River, no glacier in basin (YT) ↓1953–1999 Fleming and Clarke (2003)
Big Creek, no glacier in basin (YT) ↓1975–1999 Fleming and Clarke (2003)
BC region Mixture of trends 1966–2015 Most positive detectable trends occur in spring in glacierized westward rivers located > 1200 m Hernández-Henríquez et al. (2017)
Campbell, Stave, Cheakamus, and other rivers in south coastal BC ↑ 1984–2007 ↑December–January, ↓ February, 1984–2007 Fleming and Weber (2012)
Cowichan River (BC) ↓ August, 1961–2006 Fleming (2010)
Fraser River (BC) Variability increasing Déry et al. (2012)
Fraser River (BC) ↓ June–August 1958–2012 BCMOE (2016)
Castle River near Beaver Mines (BC) ↓ 1946–1948, 1951–2002 Rood et al. (2005)
Bridge River (BC) Possible small ↑1984–2007 Small ↑1984–2007 Possible small ↑June–July,↓ August, 1984–2007 Fleming and Weber (2012)
Columbia River (BC) Possible small ↑ 1984–2007 ↑ 1984–2007 Possible small ↑ June, ↓ August, 1984–2007 Fleming and Weber (2012)
Columbia River at Fairmont Hot Springs (BC) ↓ 1946–1995 Rood et al. (2005)
Peace River (BC) → 1984–2007 → 1984–2007 → 1984–2007 Fleming and Weber (2012)
Peace River at town of Peace River (AB) ↓ −57%, 1912–2003 Schindler and Donahue (2006)
↑ 1916–2013 Rood et al. (2017)
Mackenzie River (BC, AB, YT, SK, NT) 1961–2002 Yip et al. (2012)
↑ 1965-2007 St. Jacques and Sauchyn (2009)
↑1940–2013 Rood et al. (2017)
Liard River (YT, BC, AB, NT) ↓ annual mean, 1960–1999

↑ annual minimum, 1960–1999

↓ annual maximum, 1975–1999

↑ 1975–1999, and 1960–1999 ↓ June and August, 1975–1999 Burn et al. (2004a)
↑ 1944–2013 ↑ 1944–2013 ↑ 1944–2013 Rood et al. (2017)
Peel River above Fort McPherson (NT) → 1975–2013 Rood et al. (2017)
Athabasca River below Fort McMurray (AB) Significant ↓ 1958–2009 ↓ –19% from 1958–2003

↓ –33.3% 1970–2003

↓ –30% to  –20%, 1958–2009

Schindler and Donahue (2006)

Peters et al. (2013)

Athabasca River at Athabasca (AB) → 1913–2013 Rood et al. (2017)

Peters et al. (2013)

Athabasca and Peace River sub-basins (BC, AB, SK) ↓ 1966–2010 Mostly ↓ 1966–2010, with increases in several sub-basins Majority ↓1966–2010 Bawden et al. (2014)
Red Deer River (AB) Bow River (AB) ↓ 1913–2002

Small ↓1911–2002
and 1912–2007

Rood et al. (2005)

St. Jacques et al. (2010)

Elbow River below Glenmore Dam (AB) ↓ 1912–2001 St. Jacques et al. (2010)
Oldman River near Lethbridge (AB) ↓ 1912–2001 St. Jacques et al. (2010)
↓ –42% 1915–2003 Schindler and Donahue (2006)
South Saskatchewan River at Medicine Hat (AB) ↓ 1913–1930, 1936–2002;

↑ 1912–2001 (naturalized, climate only)

Rood et al. (2005); St. Jacques et al. (2010)
South Saskatchewan River at Saskatoon (AB, SK) ↓ –84% 1912–2003 Schindler and Donahue (2006)
North Saskatchewan River at Edmonton (AB) ↓ 1911–2007 St. Jacques et al. (2010)
Prairie unregulated streams ↓ 1966–2005 ↓ 1966–2005 Burn et al. (2008)
Winnipeg River (MB) ↑ +58% since 1924 ↑ since 1924 → since 1924 St. George (2007)
Hudson Bay (MB) ↓ 1964–1980s; ↑ 1980s–2008 ↑ 1964–2008 ↓ 1964–2008 Déry et al. (2011)
Churchill (MB) ↓ 1964–2008 Déry et al. (2011)
Nagagami River (ON) ↑ 1954–2008 Nalley et al. (2012)
Missinaibi River (ON) ↑ 1954–2008 Nalley et al. (2012)
Black River (ON) ↑ 1954–2008 Nalley et al. (2012)
Richelieu River (QC) ↑ 1954–2008 Nalley et al. (2012)
Eaton River (QC) Small ↓ 1954–2007 Nalley et al. (2012)
St. Lawrence River, south shore tributaries (QC) ↓ 1950–2000 Assani et al. (2012)
St. Lawrence River, tributaries north and west of Montreal (QC) ↑ 1950–2000 Assani et al. (2012)
Thirteen rivers in New Brunswick ↑ 11/13 (5 significant at 70%), ↓ 2/13, 1969–2006 ↓9/13 (5 significant at 70%) 1969–2006 Arisz et al. (2011)
Table source: Updated from Mortsch et al. (2015).

Seasonally, there has been a consistent pattern of increasing winter flows in many regions (see Table 6.1), particularly for more northern basins, such as the Mackenzie and Yukon rivers and those draining into Hudson Bay. Summer flows have been generally declining over most regions of Canada, although the declines are not as widespread as for winter. Note that these studies are mostly consistent on the direction of change, but there are large differences in the rate of these changes. Many of these regional trends in flow were linked to precipitation trends or variability affecting the entire basin, although winter warming and associated snowmelt explained several of the increases in winter/early spring flow (e.g., DeBeer et al., 201657). In addition, several flows were associated with naturally occurring internal climate variability (mainly El Niño–Southern Oscillation, Pacific Decadal Oscillation [PDO], and Arctic Oscillation [AO]; see Chapter 2, Box 2.5), particularly for western Canada during winter (e.g., Bonsal and Shabbar, 200820; Whitfield et al., 2010233), the Mackenzie Basin (St. Jacques and Sauchyn, 2009197), and rivers draining into Hudson Bay (Déry and Wood, 200458).

Changes in extreme short-term streamflow are important indicators of flood risk. One-day maximum flow magnitudes (the highest one-day flow recorded during the year) from 1970 to 2005 revealed that 11% of hydrometric sites across Canada have significantly decreasing trends (lower maximum flow levels), while only less than 4% have increasing trends (higher maximum flow levels) (Monk et al., 2011142). A more recent study using an expanded set of RHBN stations (280) for the 1961–2010 period yielded very similar results, with 10% of the sites showing significant decreases and less than 4% significant increases (Burn and Whitfield, 201630) (see Figure 6.3).

Figure-6.3

Streamflow changes in Canada, trends in maximum flow, 1961–2010

A map of Canada showing the spatial locations of trends in one-day maximum streamflow amounts for the 1961–2010 period using stations on unregulated streams from the Reference Hydrometric Basin Network (see Box 6.1). There are very few stations showing significant increasing trends scattered throughout the country. More locations have significant decreasing trends, and these are located in the southern Yukon, much of British Columbia, northern Alberta, south-central Ontario, and western Newfoundland. The majority of stations show no significant change, and these are located in almost all regions of Canada.
Figure-6.3

Summary of trends in one-day maximum flow in Canada using stations on unregulated streams from the Reference Hydrometric Basin Network (see Box 6.1). Significant trends denote that there is only a 5% possibility that such changes are due to chance.

Source

Modified from Burn and Whitfield (2016).

Equally important to aquatic ecosystems and society are low flows, since they represent periods of decreased water availability. More stations show significantly lower one-day minimum flow trends (18%) than show significantly higher ones (8%) (see Figure 6.4) (Monk et al., 2011142). Results from a smaller subset of RHBN stations (Ehsanzadeh and Adamowski, 200772 for 1961–2000 and Burn et al., 201034, for 1967–2006) revealed similar tendencies in seven-day low flows, with more sites having significantly lower values (36% and 18% for each study, respectively) than higher values (7% and 5%, respectively).

Figure-6.4

Streamflow changes in Canada, trends in minimum flow, 1970–2005

A map of Canada showing the spatial locations of trends in one-day minimum streamflow amounts for the 1970–2005 period using stations on unregulated streams from the Reference Hydrometric Basin Network (see Box 6.1). There are several significant increasing trends, primarily located in northern areas of the country, and several significant decreasing trends, primarily located in southern areas of the country, with the exception of a few stations in north-central Saskatchewan and Manitoba. Many stations show no significant change, and these are scattered throughout the country.
Figure-6.4

Summary of trends in one-day minimum flow in Canada using stations on unregulated streams from the Reference Hydrometric Basin Network (see Box 6.1). Significant trends denote that there is only a 10% possibility that such changes are due to chance.

Source

Modified from Monk et al. (2011).

Another indicator of freshwater availability is baseflow, the portion of streamflow resulting from seepage of water from the ground (related to groundwater; see Section 6.5). Baseflow often sustains river water supply during low-flow periods. For the vast majority of sites in Canada, annual baseflow trends did not significantly change from 1966 to 2005 (Rivard et al., 2009170). However, an analysis of a baseflow index across Canada found some locations with significantly decreasing trends (11% of stations) and others with increasing trends (9%) (Monk et al., 2011142). Additionally, in northwestern Canada, winter baseflow has increased significantly in 39% of the 23 rivers analyzed. The likely explanation is enhanced water infiltration from permafrost thawing due to climate warming (St. Jacques and Sauchyn, 2009197).

Only one published study directly attributed changes in streamflow magnitude within Canada to anthropogenic climate change. This included recent observed declines in summer (June–August) streamflow in four British Columbia rivers (Najafi et al., 2017b148). The decreases were due to smaller late-spring snowpacks (and consequently, lower summer runoff), which were attributed to the human influence on warming of cold-season temperatures (Najafi et al., 2017a147) (see Chapter 4, Section 4.3.1.2).

Projected future changes in Canadian streamflow magnitudes have not been extensively examined on a national scale, although several regional assessments have been conducted (see Table 6.2 and Figure 6.5). The majority of these studies are based on the third phase of the Coupled Model Intercomparison Project (CMIP3) climate models and SRES emission scenarios (see Chapter 3, Section 3.3) unless otherwise specified. The findings are mostly consistent on the direction of change, although there are large uncertainties in magnitude. In general, for the mid-21st century, watersheds in British Columbia and northern Alberta are projected to have increases in annual and winter runoff, whereas some watersheds in Alberta, southwest British Columbia, and southern Ontario are projected to have declines in summer flow (Kerkhoven and Gan, 2011111; Poitras et al., 2011163; Bennett et al., 201215; Bohrn, 201217; Harma et al., 201292; Schnorbus et al., 2011181; 2014182; Shrestha et al., 2012a192; Eum et al., 201774; Islam et al., 2017104). In the Prairie region, most rivers in southern Alberta and Saskatchewan are projected to have decreases in both annual and summer runoff (Lapp et al., 2009118; Shepherd et al., 2010189; Forbes et al., 201181; Kerkhoven and Gan, 2011111; Kienzle et al., 2012113; Tanzeeba and Gan, 2012208; St. Jacques et al., 2013199, 2017198). However, rivers in southern and northern Manitoba are projected to have increasing flow (Poitras et al., 2011163; Shrestha et al., 2012b191; Stantec, 2012201). Projected changes in future annual runoff are mixed in Ontario (EBNFLO Environmental and AquaResource Inc., 201070; Grillakis et al., 201188), while in Quebec the majority of studies project increasing annual flows (Quilbe et al., 2008165; Minville et al., 2008139, 2010140; Boyer et al., 201025; Chen et al., 201147; Guay et al., 201590). A Quebec study using several models from the fifth phase of the Coupled Model Intercomparison Project (CMIP5) found that mid-century (2041–2070) flows for southern rivers under both medium and high emission scenarios (RCP4.5 and RCP8.5) will be characterized by earlier and smaller spring peak flow and lower summer runoff. Annual mean flow is anticipated to increase in northern regions and decrease in the south (CEHQ, 201542). Annual streamflow is projected to increase for New Brunswick (El-Jabi et al., 201373) and Labrador (Roberts et al., 2012173). In northwestern Canada, there is evidence that watersheds such as the Mackenzie and Yukon river basins will see an increase in annual flow, mainly due to the higher precipitation amounts projected at higher latitudes (e.g., Poitras et al., 2011163; Thorne, 2011210; Vetter et al., 2017219).

Table 6.2

Projected changes in annual and seasonal streamflow from basin-wide case studies across Canada

Watershed (west to east) Projections Key references
Table source: Modified and updated from Cohen et al. (2015).
Baker River (BC) Most scenarios for the 2050s project increased winter runoff and decreased summer runoff, including decreased snow water equivalent Bennett et al. (2012)
Campbell River (BC) Increase in 2050s winter runoff, and decrease in summer runoff; no consensus on changes in mean annual runoff Schnorbus et al. (2011); Bennett et al. (2012)
Trepanier Creek, Okanagan Basin (BC) Decrease in 2050s mean annual and summer streamflow, with spring freshet occurring two weeks earlier, compared with 1983–1993 period Harma et al. (2012)
Ingenika River (BC) Increase in 2050s winter runoff; no consensus on changes in summer runoff Bennett et al. (2012)
Fraser River (BC) No consensus for 2050s mean annual flow projection for the Fraser River; flow during summer would decline in all scenarios Shrestha et al. (2012a)
Earlier spring snowmelt in the 2050s (approximately 25 days), yielding more runoff in the winter and spring, and earlier recession to low-flow volumes in summer at mouth Islam et al. (2017)
Columbia River (BC); Peace River (BC, AB) Streamflow projections for the 2050s indicate these rivers will retain the characteristics of a nival regime by mid-century, although streamflow-timing shifts result in the form of generally higher winter, earlier freshet onset, higher spring runoff, and reduced summer runoff. An overall increase in annual runoff is projected Schnorbus et al. (2014)
Liard River (NT) General increase in annual flow under warming climate scenarios Thorne (2011)
Mackenzie River (NT) Increasing tendency for mean annual runoff over the 21st century Vetter et al. (2017)
Athabasca River (AB) Projected increases in spring and winter flows, increases in minimum and maximum flows, with summer flows projected to decrease in the 2050s and 2080s; overall increase in annual runoff reaching the river mouth Eum et al. (2017)
Southern Prairies (tributaries of Saskatchewan River) (AB, SK) Decreases in 2050s annual runoff, except for increase in Cline River, AB, due to large increase in winter runoff; increases in Red River and decreases in Old Man River, AB; a shift to an earlier spring peak in runoff and drier late summer expected Lapp et al. (2009); Shepherd et al. (2010); Forbes et al. (2011); Kienzle et al. (2012); St. Jacques et al. (2013, 2017)
Churchill (MB) In a hydrological model intercomparison, two of three hydrological model projections for a range of climate scenarios projected increases in annual runoff, while a third model projected decreases Bohrn (2012)
Lake Winnipeg – Upper Assiniboine and Morris Basins (MB) Increased annual runoff projected for the Upper Assiniboine and for most scenarios in the Morris Basin Shrestha et al. (2012b); Stantec (2012)
Western Canada basins: Columbia, Fraser, Yukon, Mackenzie, Churchill, Nelson, Saskatchewan rivers Increased annual mean flow projected for 2050s; increase in magnitude of winter streamflow and earlier spring peak flow for northern basins; significant increase in 10-year return frequency of 15-day winter and fall low flows and one-day high flows for high-latitude western Canadian basins; decrease in high-flow events for the more southern basins (Churchill, Saskatchewan, and Athabasca) Poitras et al. (2011)
Spencer Creek (ON) Increase in mean annual and fall–winter streamflow and decrease in March–April spring peak flow Grillakis et al. (2011)
Credit River (ON) Mixed projections of annual streamflow EBNFLO Environmental and AquaResource Inc. (2010)
305 Tributaries in QC Increase in mean annual streamflow for majority of Quebec watersheds; decreased June–August contribution to annual streamflow Guay et al. (2015)
Quebec Rivers south of approximately 50 degrees north Mean annual flows are projected in 2050s to decrease in southern regions and increase in more northern areas; spring floods projected to be earlier, with the volume and peak decreasing in the south; summer–fall peak flood flows projected to be higher over a large portion of southern Quebec; summer flows lower CEHQ (2015)
Tributaries of the St. Lawrence (QC) (including Richelieu, St. François, Yamachiche, St. Maurice and Batiscan rivers) Increases in 2050s mean winter runoff, with most scenarios projecting decreased summer runoff and increased annual runoff Boyer et al. (2010)
Chaudière (QC) Slight decrease in annual runoff for the 2020s Quilbe et al. (2008)
Chute-du-Diable (QC) Most scenarios suggest increases in the winter, spring, and fall runoff, whereas summer is expected to see a decrease, with increases in annual runoff for 2050s and 2080s Minville et al. (2008)
Peribonka River (QC) Generally earlier spring freshet timing, slightly higher spring peak, and slightly higher annual runoff projected for 2050s and 2080s Minville et al. (2010)
Saint John, Nashwaak, Canaan, Kennebecasis, Restigouche, and Miramichi Rivers (NB) Increase in 2050s mean annual streamflow; depending on the scenario and the time slice used, increase in flood and drought frequencies El-Jabi et al. (2013)
Pinus River Basin (Labrador, NL) Increase in 2050s mean annual streamflow, with spring peak occurring two weeks earlier compared with the 1971–2000 period Roberts et al. (2012)


Figure-6.5

Projected future changes to annual streamflow in Canada

A map of Canada showing the locations of projected changes to the amount of annual streamflow in the future (mid- to late 21st century). Decreases are mainly projected in south-central Alberta and extreme southern Ontario. The remainder of the country primarily shows projected increases, although a few scattered locations show both increases and decreases.
Figure-6.5

Summary of projected future changes to annual streamflow across Canada for the mid- to late 21st century based on various emission scenarios.

Source

Updated from Bush et al. (2014) and Cohen et al. (2015).

6.2.2

Streamflow timing

Reliable streamflow is important for water users and aquatic ecosystems, which have become accustomed to having adequate water supplies at certain times of the year. As a result, streamflow timing and related streamflow regimes (see Section 6.2.3) are important indicators of freshwater availability. The timing of streamflow events is significantly influenced by climate. Such events include the spring freshet, when flow dramatically increases due to snowmelt, and shorter-duration (usually one- to seven-day) maximum and minimum flows during the year. Pan-Canadian studies have generally reported that the spring high-flow season is coming earlier (Zhang et al., 2001239; Déry et al., 200962; Vincent et al., 2015221). This finding is supported by a study using 49 RHBN hydrometric stations with more than 30 years of data up to 2010 (Jones et al., 2015108; see Figure 6.6). The average rate of change for stations with earlier trends was approximately two days per decade, consistent with other studies showing earlier freshets (e.g., Prowse et al., 2002164).

Figure-6.6

Past changes in timing of spring freshet

A map of Canada using proportional triangles to depict past trends in the timing of spring freshet for 49 stations on unregulated streams. The period of records for the stations ranges between 30 and 100 years. The majority of stations show earlier spring freshet trends over most of the country; these trends range between one and five days per decade. Very few stations show later trends.
Figure-6.6

Trends in spring freshet timing (in days per decade with magnitude proportional to the size of the triangle) for 49 stations in unregulated streams from the Reference Hydrometric Basin Network (RHBN; see Box 6.1). Downward-pointing triangles represent earlier freshets and upward-pointing triangles represent later freshets. Green triangles indicate the trend is not significant. Significant trends denote that there is only a 5% possibility that such changes are due to chance. Data lengths range from 30 to 100 years.

Source

Modified from Jones et al. (2015).

Several regional studies in western Canada, including the Northwest Territories, have also found an earlier onset of spring freshet over the past several decades (Burn et al., 2004a31, 2004b32; Abdul Aziz and Burn, 20061; Burn, 200827; Rood et al., 2008175; Cunderlik and Ouarda, 200954). For example, the Fraser River in British Columbia displayed a trend toward smaller mountain snowpacks and earlier melt onsets that resulted in a 10-day advance of the spring freshet (with subsequent reductions in summer flows) for the 1949–2006 period (Kang et al., 2016110). In the Mackenzie Basin (British Columbia, Alberta, and Northwest Territories), spring freshet advanced by approximately 2.7 days per decade over the last 25 years (Woo and Thorne, 2003236). These trends are consistent with increasing spring temperatures (see Chapter 4, Section 4.2.1.1) and the resulting earlier spring snowmelt (e.g., DeBeer et al., 201657).

The timing of annual low flows of various durations (one, seven, 15, and 30 days) was significantly earlier in the year over the 1954–2003 period in southern British Columbia, central and southwestern Alberta, central Saskatchewan, much of Ontario, as well as Quebec and the Atlantic provinces. Northern British Columbia, Yukon, Northwest Territories, Nunavut, and the Laurentian Great Lakes region had significant trends toward later dates. Similar spatial results were also observed for winter and summer low flows (Khaliq et al., 2008112). For the timing of high flows, summer rainfall-driven peak events in some regions of the Prairies were found to occur earlier (Burn et al., 200827); however, western Canada as a whole showed no consistent trends in the timing of rainfall-dominated high flows (e.g., Cunderlik and Ouarda, 200954).

No Canadian studies have directly attributed change in streamflow timing to anthropogenic climate change. However, since earlier spring freshets are the result of strong winter and spring warming, and most the observed warming in Canada is due to human influence (see Chapter 4, Section 4.2.1.2), there is strong reasoning that observed changes in streamflow seasonality are at least partly attributable to anthropogenic warming. Furthermore, trends toward earlier snowmelt-driven streamflow in the western United States since 1950 (including the Columbia River basin that extends into southern British Columbia) have been attributed to anthropogenic climate warming (Hidalgo et al., 200998).

There are few studies of future streamflow timing in Canada. An earlier snowmelt peak and resulting spring freshet is projected for mid-century (2041–2070) over western Canada, particularly for northern basins, using the Canadian Regional Climate Model and a high emission scenario (A2). For the majority of western Canada basins, this earlier shift was also projected for the end-of-winter low-flow events (Poitras et al., 2011163). Earlier spring freshet flows for the mid-century period (2041–2070) are also projected using several CMIP5 models under a medium (RCP4.5) and a high (RCP8.5) emission scenario. Spring freshets are projected to advance by an average of 25 days (RCP4.5 and RCP8.5) in the Fraser River, British Columbia (Islam et al., 2017104), and by 15 days (RCP4.5) and 20 days (RCP8.5) for rivers in southern Quebec (CEHQ, 201542). Given the continued spring warming projected for Canada (see Chapter 4, Section 4.2.1.3), earlier spring freshet flows in the future are also probable in other regions of Canada.

6.2.3

Streamflow regime

In a warming climate, the following changes to current streamflow regimes (see Box 6.2) are expected: (1) earlier onset of spring freshet; (2) smaller magnitude of snowmelt events; (3) more rainfall-generated flows; (4) a transition from nival catchments to mixed regimes and from mixed regimes to pluvial regimes (Burn et al., 201635). Regional studies have yielded similar results. For example, trends in southern areas of western Canada (Fraser and Columbia river watersheds) are associated with changes in runoff timing, including a shorter snow- and glacier-melt season, earlier onset of spring melt, and decreased summer flows during approximately the last 50 years (e.g., Rood et al., 2008175; Déry et al., 200962). Shifts from nival to mixed or even pluvial regimes were observed for small prairie streams (Burn et al., 200827; Shook and Pomeroy, 2012190; Dumanski et al., 201569).

6.2.4

Streamflow-related floods

A flood is the overflowing of the normal confines of a stream or other body of water, or the accumulation of water over areas that are not normally submerged. Flooding typically occurs at local to watershed scales. There are several types, including streamflow (fluvial), urban, flash, and coastal flooding (see FAQ 6.1 and, for coastal flooding, Chapter 7, Section 7.5.3; Seneviratne et al., 2012186). This section assesses only streamflow-related floods, although implications for urban floods are discussed. The main causes of streamflow floods are intense and/or long-lasting precipitation, snow/ice melt, rain-on-snow, river ice jams, or a combination of these causes. Flood risk is also affected by drainage basin conditions, such as pre-flood water levels in the rivers; the presence of snow and ice; soil character (e.g., whether it is frozen, its moisture content); urbanization; and the existence of dikes, dams, and reservoirs (e.g., Bates et al., 20089).

Streamflow flooding is a common and natural occurrence, but large events are often a costly disaster for Canadians (Buttle et al., 201637; Peters et al., 2016160). Given the range of potential drivers, flooding can occur any time of the year somewhere in Canada. Flooding from snowmelt and ice jams typically occurs during the spring but can also result from mid-winter melts. Floods generated by intense and/or excessive rainfall typically occur in late spring and summer, when atmospheric convective precipitation (generally brief but intense rain showers resulting from heat convection forming cumulonimbus clouds) is more common. An example of a costly event was the June 2013 southern Alberta flood, which was driven mainly by extreme rainfall (including rain-on-snow at higher elevations) associated with an intense weather system (Liu et al., 2016124; Teufel et al., 2017209) (see Chapter 4, Section 4.4.1.1). By contrast, ice jams on the lower Peace and Athabasca Rivers in northern Alberta in 2014 led to widespread inundation of delta wetland areas, which was beneficial to maintaining the aquatic ecosystem in the region (Peters et al., 2016160). In 2014 as well, a delayed spring onset of snowmelt and an extremely wet May and June resulted in major flooding in the southeastern Canadian prairies (Szeto et al., 2015206).

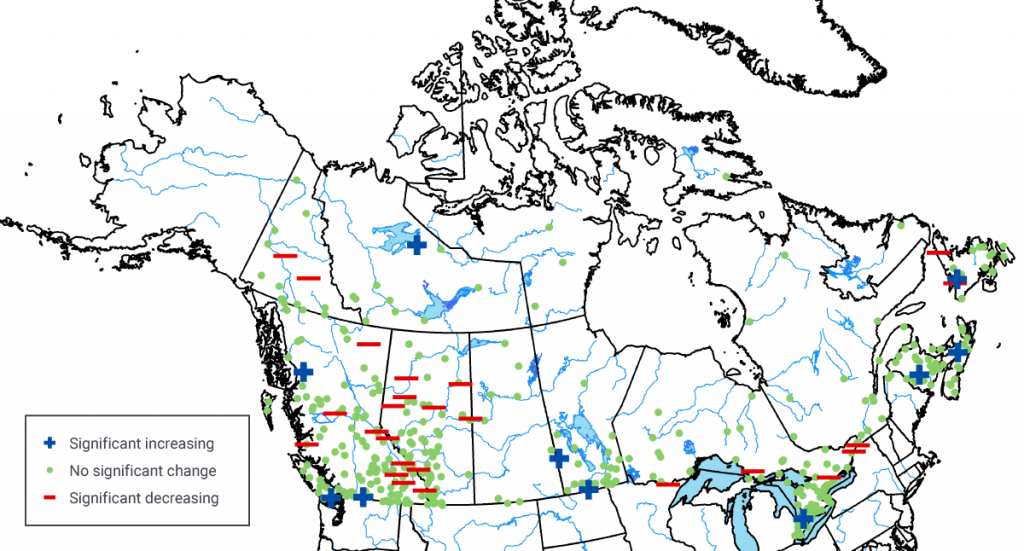
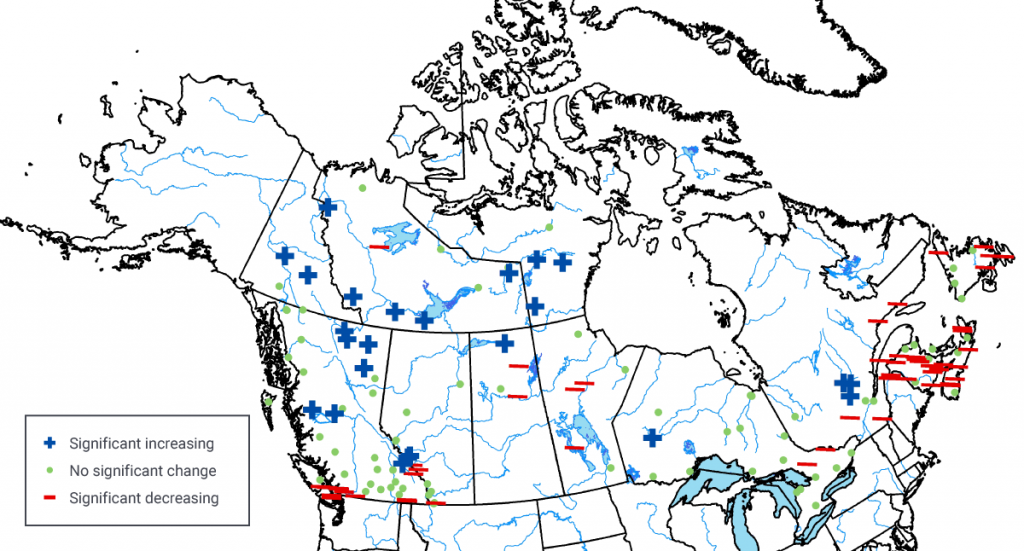
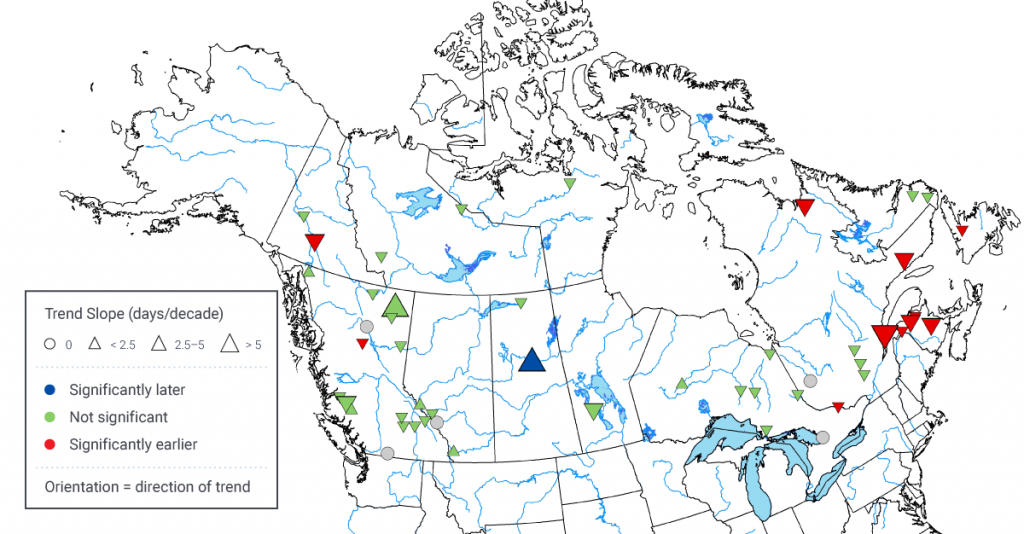
Different areas of Canada are classified according to the type of floods they generally experience. Across the country, 32% of 136 stream gauge sites (1913–2006) are classified as spring freshet/ice breakup flood–dominated, 42% as open-water flood–dominated (i.e., during the warm season), and 23% as a mix of these two classes. The timing of ice-influenced peak water levels and ice breakup (which can lead to flooding) has shifted earlier since the late 1960s (von de Wall et al., 2009; 2010) (see also Chapter 5, Section 5.5). There are also areas of Canada, such as the Saint John River, New Brunswick, where floodplains have been subject to more frequent mid-winter ice jams and higher April flows, both of which increase the risk of major flooding (Beltaos, 2002). However, more recent analyses of both spring freshet– and open-water flood–dominated rivers across Canada revealed that changes in magnitude, timing, number, and duration of high-flow events showed varying trends across Canada, increasing in some cases and decreasing in others. For nival catchments, this included trends toward smaller and earlier flood events; both consistent with a reduction in winter snowpack (Burn and Whitfield, 2016). In addition, examination of the seasonality of past flood regimes in 132 RHBN stations over four periods ranging from 50 to 80 years revealed the decreased importance of snowmelt flood events and the increased importance of both rain-on-snow and rainfall-driven flood events (Burn et al., 2016). To the authors’ knowledge, no studies have assessed past trends in urban flooding across Canada.

Complex interactions among the many factors that lead to streamflow floods complicate the attribution of these events to anthropogenic climate change. An event-attribution study of the 2013 southern Alberta flood determined that human-induced warming increased the likelihood of extreme precipitation, at least as large as the amount observed during this event (Teuful et al., 2017209). However, since the flood resulted from a combination of many meteorological and hydrological factors, human influence could not be detected for the flood itself (see Chapter 4, Section 4.4.1.1). Similarly, an event-attribution study of the 2014 flood in the southeastern prairies was unable to detect human influence on that flood, owing to multiple contributing factors (Szeto et al., 2015206).

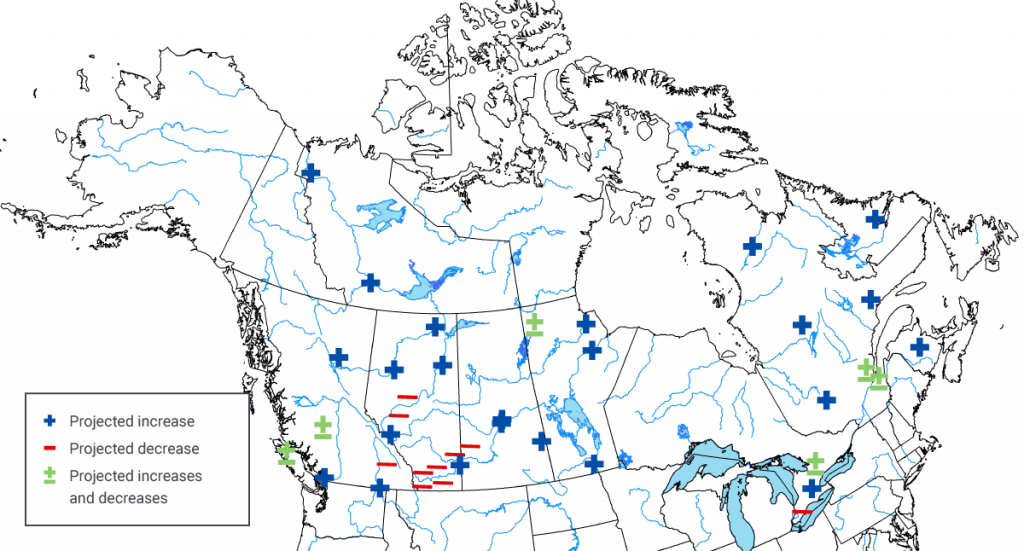
It is expected that a changing climate will impact several of the factors affecting future streamflow flood occurrence (see FAQ 6.1). These include precipitation amount, type, and intensity; the amount and duration of snow cover; the timing and frequency of ice jams; and the potential for rain-on-snow events. However, interactions between flood-generating factors at the watershed scale lead to large uncertainties regarding the frequency and intensity of future floods (Whitfield, 2012230). Some studies have suggested that the contribution of snowmelt to spring floods is expected to generally decline due to depleted snowpacks (e.g., Whitfield and Cannon, 2000231; Zhang et al., 2001239; Peters et al., 2006161). However, there are only a few watershed-scale studies on future streamflow flooding (and/or their related factors) in Canada, which use climate model projections as input into a hydrological model. For example, depletion of the snowpack by mid-winter melt events are projected to lead to a major reduction in the frequency of spring ice jam flooding, but could increase the potential for mid-winter ice jam flooding in the Peace–Athabasca delta in northern Alberta (Beltaos et al., 200614). Two British Columbia watersheds, one on the coast and one in the interior, are both projected to experience increased flooding potential, due to more rainfall and winter rain-on-snow events in the coastal watershed and to more spring rain and more rapid snowmelt events in the interior watershed (Loukas et al., 2000125; 2002126). For the Red River Basin in Manitoba, snow accumulation during winter is expected to decrease, while rainfall is expected to increase during the snowmelt period. However, due to the variability among climate models, it is difficult to project whether flood magnitude will increase or decrease (Rasmussen, 2015167). In the Châteauguay watershed in Quebec, spring, summer, and autumn peak flood events are projected to be reduced in magnitude under a medium emission scenario (B2), but there are large differences among the three models used (Mareuil et al., 2007129). The only study of projected changes in rain-on-snow events suggested general increases in these events from November to March for most of Canada by mid-century (2041–2070) for both medium (RCP4.5) and high (RCP8.5) emission scenarios (Jeong and Sushama, 2018106). To the authors’ knowledge, no studies have assessed projected changes to urban floods across Canada; however, increases in extreme precipitation are considered a factor that will affect their future occurrence (e.g., Buttle et al., 201637; Sandink, 2016177).


Section summary

In summary, numerous regional and a few national studies have examined past changes to surface runoff over the last several decades. Most have incorporated RHBN stations (see Box 6.1), thus minimizing the effects of water regulation. There is high agreement among these analyses — and thus high confidence —that the spring freshet has shifted earlier, with higher winter and early-spring flows (see Table 6.1 and Figure 6.6). There is less evidence — and thus medium confidence — that summer flows have decreased, which has been mainly documented in western Canada (see Table 6.1). All of these changes are consistent with the observed winter and spring warming (see Chapter 4, Section 4.2.1.1) and resulting changes to snow cover, including less snow at higher elevations, which often sustains summer runoff (see Chapter 5, Section 5.2.1). They also may be partly attributed to anthropogenic climate change. National and regional studies on past annual flow revealed little consistency across Canada (see Table 6.1) and generally reflect regional variations in precipitation and natural climate variability (see Chapter 2, Section 2.3.3).

Given the projected warming (see Chapter 4, Section 4.2.1.3) and resulting reductions in snow cover and mountain glaciers and increased permafrost thaw (see Chapter 5), there is high confidence that the observed seasonal changes in streamflow will continue. Consistent evidence for these projected changes, characterized by even earlier spring freshets, higher winter flows, and reduced summer flows, is provided in numerous regional studies (see Table 6.2). These changes in physical climate are expected to cause streams to shift from nival (snowmelt-dominated) toward pluvial (rainfall-dominated) regimes. There are, however, large uncertainties in the magnitude of projected changes. Regional studies project both increases and decreases in annual streamflow, with increases mainly in more northern basins, and decreases mainly in western interior basins (see Table 6.2 and Figure 6.5). Due to modelling uncertainties, and the complexity of factors associated with annual flow, there is medium confidence in these projected annual changes.

Streamflow-related floods result from many factors, including intense and/or long-lasting precipitation, snowmelt, ice jams, rain-on-snow, or a combination of these factors. Studies reveal no spatially consistent trends in these factors, including extreme one-day high streamflow events (see Figure 6.3), across the country. There is also no indication of spatially consistent trends in streamflow-related or urban flooding events for Canada as a whole. It is expected that a changing climate will affect these flood-causing factors in various ways. For example, although no studies assessing future changes to urban floods were identified, it follows directly — and thus there is high confidence, — that projected increases in extreme precipitation (see Chapter 4, Section 4.3.2.2) will result in a higher incidence of rain-generated urban flooding in some regions. Projected higher temperatures (see Chapter 4, Section 4.2.1.3) suggest a shift toward earlier snowmelt-related floods, including those associated with spring snowmelt, ice jams, and rain-on-snow events. This shift is consistent with observed earlier spring freshet trends (see Section 6.2.2) and with a few studies that have found trends toward earlier snowmelt-related flood events and earlier ice-affected peak streamflow levels during the last few decades. However, given the complexity of factors associated with snowmelt-related flooding, and the limited studies, there is only medium confidence in this shift. There is considerable uncertainty as to how these higher temperatures and reductions in snow cover (see Chapter 5, Section 5.2.2) will affect the frequency and magnitude of future snowmelt-related floods. Smaller snowpacks imply that the contribution of snowmelt to flooding will decline, including floods induced by river ice jams or rain-on-snow events. Individual studies have identified smaller snowmelt-related flood events in some nival catchments across the country during the last few decades and a projected decrease in future ice-jam flooding in the Peace-Athabasca Delta due to smaller snow packs. Warmer temperatures also imply a higher potential for rain-on-snow, and one study has shown projected increases in these events across Canada. However, given that snowpacks are expected to be smaller in the future, it is uncertain whether an increase in rain-on-snow will lead to greater flood potential. As a result, there is a lack of consistent evidence regarding the effects of climate change on future snowmelt-related flooding across the country.

6.3

Surface water levels: lakes and wetlands

Key Message

In regions of Canada where there are sufficient data, there is no indication of long-term changes to lake and wetland levels. Future levels may decline in southern Canada, where increased evaporation may exceed increased precipitation (low confidence). Projected warming and thawing permafrost has the potential to cause future changes in many northern Canadian lakes, including rapid drainage (medium confidence).

Canada has more than 2 million lakes covering 7.6% of the country’s area, with 578 having an area greater than 100 km2 (Canadian National Committee, 197538; Monk and Baird, 2011141). There is a wide range of lake types, including the Laurentian Great Lakes (Superior, Michigan, Huron, Erie, and Ontario) and Mackenzie Great Lakes (Great Slave and Great Bear), Arctic and sub-Arctic lakes, glacial, boreal, prairie, and shallow enclosed saline lakes (Schertzer et al., 2004179). Some lake levels are monitored by Canada’s Hydrometric Network (see Box 6.1). Other than in a select few cases, there is limited information on past trends and projected future changes in lake levels. Furthermore, many of the larger lakes are regulated by humans, and there is no comprehensive national dataset for unregulated lakes. Thus, a Canada-wide assessment of past trends and future changes is challenging. This section focuses on major lakes and water bodies, reflecting the available literature and monitoring data.

The levels of freshwater lakes and wetlands are governed by a simple equation:

Inputs Outputs = Change in storage (i.e., water level, or net basin supplies [NBS])

The main inputs include river inflow (runoff), direct precipitation onto the water body, snowmelt, and groundwater inflow. Outputs involve river outflow, evaporation, and exchange with groundwater. The contribution from these variables varies greatly with the size of the water body. Larger lakes within very large drainage basins are affected by events far upstream, in addition to local/regional climate. Smaller lakes and wetlands are more responsive to local climatic conditions. Surface water bodies in Canada are becoming increasingly vulnerable to a variety of stresses, both climate-related and from human management (flow regulation and land-use change) (e.g., Schertzer et al., 2004179).

6.3.1

Laurentian Great Lakes

Given their importance to Canada and the United States, the Laurentian Great Lakes are among the most studied water bodies in North America. Levels of these lakes have been monitored for more than 100 years by Canadian and US federal agencies. The levels show a large degree of variability due to natural climate variations, as well as to direct human management (e.g., dredging, diversions). These fluctuations have significant impacts on shoreline erosion, flooding of property, navigation, recreation, economy, aquatic ecosystems, and human health. Seasonally, water levels typically progress from a summer maximum to a minimum in the winter/spring (Argyilan and Forman, 20035). The lakes also exhibit year-to-year and multi-year fluctuations of less than 2.0 m, varying by lake (Wilcox et al., 2007234; DFO, 201363).

All of the Laurentian Great Lakes have experienced considerable variability in overall NBS and its primary individual components (basin-wide precipitation, lake evaporation, and river runoff) during the last several decades (see Figure 6.9). This year-to-year and multi-year variability is significantly influenced by naturally occurring large-scale modes of climate variability including PDO, AO, and the Atlantic Multi-decadal Oscillation (see Chapter 2, Box 2.5) (e.g., Ghanbari and Bravo, 200884; Hanrahan et al., 201091). Given the large geographic expanse of the Laurentian Great Lakes basin, trends in NBS and individual components vary from one lake to another. In Lake Superior, evaporation is increasing and runoff is decreasing, resulting in a significant decrease in NBS. These trends are also seen for Lake Erie (although not at statistically significant levels). In Lake Ontario, NBS has increased significantly, mainly due to increases in precipitation and runoff, although changes in these individual components are not significant. For the other lakes, trends are insignificant and mixed. For example, runoff is declining for Lake Erie, but rising for Lakes Michigan, Huron, and Ontario. Evaporation has increased over the last 70 years in Lakes Superior and Erie but shows relatively little change in the other lakes (although values have been higher since around 1998). Precipitation has increased in Lake Ontario but decreased in Lake Superior, while no trend is evident in the other lakes.

Figure-6.9

Historical time series for water variables, Laurentian Great Lakes, 1950–2016

A series of line graphs and corresponding linear trends in various water variables that affect net basin supplies in the Laurentian Great Lakes for the 1950 to 2016 period. Figures (a) to (d) have three graphs each, which show mean over-lake precipitation, evaporation, and river runoff, for (a) Lake Superior, (b) Lakes Michigan/Huron, (c) Lake Erie, and (d) Lake Ontario. These variables are measured as the effect on lake level in millimetres per year. Figure (e) shows time series of net basin supplies for Lakes Superior, Michigan/Huron, Erie, and Ontario. All Laurentian Great Lakes show considerable year-to-year and multi-year variability in overall net basin supplies and the various water variables. In Lake Superior, evaporation is increasing and runoff is decreasing, resulting in a significant decrease in NBS. These trends are also seen for Lake Erie, but not at statistically significant levels. In Lake Ontario, NBS has increased significantly, mainly due to increases in precipitation and runoff, although changes in these individual components are not significant. For the other lakes, trends are insignificant and mixed.
Figure-6.9

Time series of mean over-lake precipitation, evaporation, and river runoff (measured as the effect on lake level) for the 1950–2016 period for (a) Lake Superior, (b) Lakes Michigan/Huron, (c) Lake Erie, and (d) Lake Ontario. (e) Time series of net basin supplies (NBS) for the 1950–2016 period for Lakes Superior, Michigan/Huron, Erie, and Ontario. Red lines and text represent linear trends. *Significant trends (there is only a 5% possibility that such changes are due to chance). Lakes Michigan and Huron are connected by the Straits of Mackinac and thus have the same water level. They are therefore considered as one lake.

Source

GLERL (2017).

From 1998 to 2013, all the Laurentian Great Lakes experienced a long period of low levels, including record lows in Lakes Michigan and Huron in December 2012 and January 2013. This period ended with a quick rise in all lake levels starting in 2013. September 2014 was the first month since 1998 that all lakes were above long-term (1918–2013) average levels. The 2013 rise was attributed to increased precipitation, while the 2014 rise resulted from a combination of below-average evaporation and above-average precipitation and runoff (Gronewold et al., 201689). During spring 2017, a series of above-average precipitation events caused the level of Lake Ontario to reach its highest level since reliable measurements began in 1918 (IJC, 2017103). These two opposite extremes, occurring within a few years of each other, reveal the variability in the Laurentian Great Lakes’ levels and illustrate the difficulty in projecting future lake levels in response to climate change.

Most studies of future levels have been based on CMIP3 GCM projections (see Chapter 3, Box 3.1) that have been run through RCMs (Angel and Kunkel, 20104; Hayhoe et al., 201096; IUGLS, 2012105; MacKay and Seglenieks, 2013128). RCMs are essential for modelling the Laurentian Great Lakes, since their finer spatial resolution (typically around 50 km versus GCM grids of around 200 to 250 km; see Chapter 3, Section 3.5) allows explicit modelling of the individual lakes. As a result, models include phenomena that can have significant effects on water balance, such as lake-effect snow, which transfers large amounts of water from the lake to the land surface. Projected NBS shows considerable changes to the seasonal cycle of Lakes Michigan and Huron for 2041–2070 compared with 1961–2000 (see Figure 6.10). These changes include an increase in NBS during the winter and early spring and a decrease in summer and early fall, largely due to projected changes in seasonal precipitation. Other lakes have similar results. Overall, these projected seasonal changes are expected to result in a decrease in NBS of 1.7% to 3.9% in Lakes Superior, Michigan, Huron, and Erie, and of 0.7% in Lake Ontario (IUGLS, 2012105). On average, under a range of emission scenarios, most RCM studies project a lowering of future lake levels by 0.2 m for the 30-year time period centred on the 2050s, as compared to the 1971–2000 mean. However, there is a considerable range (from a 0.1 m increase to a 0.5 m decrease) (Angel and Kunkel, 20104; Hayhoe et al., 201096; IUGLS, 2012105). These changes are less than those projected using statistically downscaled GCM output that does not incorporate the individual lakes (MacKay and Seglenieks, 2013128). All studies agree that there will continue to be large year-to-year and multi-year variability in lake levels, possibly even above and below the historically observed extremes (IUGLS, 2012105; Music et al., 2015146).

Interactive Figure 6.10

Differences in future monthly Lake Michigan/Huron net basin supply

Interactive Figure 6.10

Difference in monthly Lake Michigan/Huron net basin supply (NBS) between 2041–2070 and 1961–2000 using the Canadian Regional Climate Model (CRCM) driven by three global climate models used in the third phase of the Coupled Model Intercomparison Project (CMIP3): Canadian Global Climate Model version 3 (CGCM) (five separate simulations), ECHAM Climate Model version 5 (ECHAM5) (two separate simulations), and Centre National de Recherches Meteorologiques version 5.1 (CNRM) (one simulation).

Source

Adapted from IUGLS, 2012.

6.3.2

Other lakes

Although levels of most other large lakes in Canada (e.g., Lakes Winnipeg, Athabasca, and Great Slave Lake) are monitored, these lakes are influenced by human regulation, making it difficult to assess past climate-related trends. An exception is Great Bear Lake in the Northwest Territories, which is unregulated. Figure 6.11 illustrates recurring high and low levels of this lake, with no discernible long-term trend. The levels have varied, in part, due to regional climatic conditions. In particular, the driest years were in the late 1940s and early 1950s, when water levels reached an all-time low, with another low recorded in the mid-1990s. The wettest years and highest levels were in the early to mid-1960s, with another peak in the early 1970s (MacDonald et al., 2004127).

Interactive Figure 6.11

Water levels for Great Bear Lake, 1944–2014

Interactive Figure 6.11

Annual (September to August) surface water levels for Great Bear Lake from 1944 to 2014.

Source

Original figure from MacDonald et al. (2004) <http://www.dfo-mpo.gc.ca/Library/278592.pdf>. The figure has been modified and updated through 2014 using daily flow level data obtained from Water Survey of Canada (ECCC, 2017) <https://wateroffice.ec.gc.ca/>.

In the Prairie region, glaciation and dry climate have resulted in numerous closed-basin saline lakes, which drain internally and rarely spill runoff. Water storage in these lakes is sensitive to climate, driven by precipitation, local runoff, and evaporation. From 1910 to 2006, levels in several closed-basin lakes across the Prairie region showed an overall decline of 4 to 10 m (see Figure 6.12), due, in part, to higher warm-season temperatures (and resulting increased evaporation) and declining snowmelt runoff to the lakes. However, climate variables alone did not explain the declines, and other contributing factors, such as land-use changes (dams, ditches, wetland drainage, and dugouts) and changes in agricultural practices, were also involved (van der Kamp et al., 2008217). From the late 2000s through 2016 (see Figure 6.12), there has been an abrupt reversal in levels of many of these lakes (a rise of as much as 6 to 8 m), reflecting the exceptionally wet conditions on the Prairies over these years (e.g., Bonsal et al., 201722). The reversal has resulted in several cases of overland flooding, exemplifying the natural hydroclimatic variability in this region and the susceptibility of surface water bodies to precipitation extremes, both dry and wet. Although no studies have investigated future climate impacts on these lake levels, they will continue to be affected by dry and wet extremes. However, given the projected higher temperatures (see Chapter 4, Section 4.2.1.3) and resulting increased evaporation, future levels are expected to decline, although the magnitude will depend on how much future precipitation increases will offset evaporation.

Figure-6.12

Water-level changes for 10 representative lakes across the southern Canadian prairies, 1910–2016

A series of line graphs showing relative water-level changes, in metres, for 10 lakes across the southern Canadian prairies. The period of record varies for each lake, with a few extending back to the 1910s and all ending in 2016. From the beginning of their records until 2006, levels in these lakes show an overall decline of 4 to 10 metres. From the late 2000s through 2016, there has been an abrupt reversal in levels of many of these lakes, with some increasing by as much as 6 to 8 metres.
Figure-6.12

Relative water-level changes for 10 representative closed-basin lakes across the southern Canadian Prairies for their period of record. Dashed lines connecting separated data points are not representative of measured water levels between the points. “D” indicates that the lake was dry at the time of measurement.

Source

van der Kamp et al. (2008); data updated through 2016.

Smaller lakes and ponds are a characteristic feature of the Canadian Arctic, with large numbers of permafrost thaw lakes found in northern Yukon and the Northwest Territories (see Chapter 5, Section 5.6). These water bodies are variable in size, with diameters of 10 to 10,000 m and depths of 1 to 20 m (Plug et al., 2008162; Vincent et al., 2012222). Warming due to Arctic amplification at high latitudes can affect the size of permafrost lakes. In particular, those in continuous permafrost may expand due to acceleration of the permafrost thaw processes that formed them, whereas those in discontinuous permafrost (i.e., patches of permafrost) may shrink and even disappear due to rapid drainage as the underlying permafrost completely thaws (e.g., Hinzman et al., 200599; Smith et al., 2005194). Some evidence for these processes has been observed in certain high-latitude regions, including Canada. For example, total lake area in the Old Crow Flats (Yukon) declined by approximately 6000 hectares between 1951 and 2007, with close to half of this loss being caused by rapid and persistent drainage of 38 large lakes. This drainage also resulted in the formation of numerous smaller residual ponds. Catastrophic lake drainages in this region have become more than five times more frequent in recent decades, and it has been suggested that these changes are associated with increases in regional temperature and precipitation (Lantz and Turner, 2015117). This observation is consistent with local perceptions that lakes in the Old Crow Flats are showing declining water levels (e.g., Wolfe et al., 2011235). However, other Canadian Arctic studies have revealed mixed results. For example, aerial photographs and topographic maps showed that, in a 10,000 km2 region east of the Mackenzie delta in the Northwest Territories, 41 lakes drained between 1950 and 2000, but the rate of drainage has decreased over time (Marsh et al., 2009131). Similarly, total lake area on the Tuktoyaktuk Peninsula on the Arctic Ocean coast of the Northwest Territories from 1978 to 2001 ranged from a 14% increase to an 11% decrease. The increases occurred primarily between 1978 and 1992 and decreases between 1992 and 2001, depending strongly on annual precipitation (Plug et al., 2008162).

Future warming and further permafrost thaw (see Chapter 5, Section 5.6.2) are anticipated to have a substantial impact on surface water in the Arctic. Permafrost thaw lakes currently have natural cycles of expansion, erosion, drainage, and reformation (e.g., van Huissteden et al., 2011218), which may accelerate under warmer climate conditions. GCMs project increased precipitation over the Canadian Arctic (see Chapter 4, Section 4.3.1.3); however, these increases will be partially offset by greater evaporation due to both warmer temperatures in summer and decreased duration of ice cover. In addition, many high Arctic lakes depend on year-round snow and glaciers and are thus vulnerable to the rapid warming of the cryosphere. As a result, the extent of northern lakes is highly vulnerable to change as a result of increased water loss from evaporation and/or drainage (e.g., Vincent et al., 2012222).

6.3.3

Wetlands and deltas

Wetlands are land saturated with water all or most of the time, with poorly drained soils and vegetation adapted to wet environments. They are often associated with standing surface water, and depths are generally less than 2 m. Canada has approximately 1.5 million km2 of wetlands — commonly referred to as swamps, marshes, bogs, muskegs, ponds, and sloughs — representing about 16% of the country’s landmass (National Wetlands Working Group, 1988150, 1997151). The majority of wetlands are peatlands in the Arctic, sub-Arctic, boreal, prairie, and temperate regions (van der Kamp and Marsh, 2004216). Canada also has several deltas that form from sediments deposited by rivers entering a large lake or ocean. The most prominent examples include the Mackenzie (with more than 25,000 shallow lakes and wetlands), Fraser, Peace–Athabasca, Slave, Saskatchewan, and St. Clair river deltas. Critical to the resilience of delta ecosystems are occasional low- and high-water events. High-water events can result in overland flow (ice jam and open-water flooding) and are a crucial source of water replenishment to disconnected water bodies perched above the main flow system (see below; Peters et al., 2013159).

By storing water and releasing it slowly, wetlands and deltas are important to Canada’s freshwater availability. Under certain conditions, wetlands can alleviate floods, maintain groundwater levels and streamflow, filter sediments and pollutants, cycle nutrients, and sequester carbon (Federal, Provincial and Territorial Governments of Canada, 201076). They are closely linked with climate, as they gain water from direct precipitation, runoff from surrounding uplands, and groundwater inflow. They lose water via evapotranspiration and surface/groundwater outflow. Some wetlands also owe their existence in part to cold Canadian winters and resulting permafrost, snowmelt, and river ice jams. Thus, both shorter winters and increased evaporation due to longer summers will increase stress on wetland environments, unless increases in precipitation offset the loss of water through evaporation (van der Kamp and Marsh, 2004216).

Despite the importance of wetlands, a comprehensive inventory or monitoring program for the entire country does not exist (Fournier et al., 200782). However, since 1979, Ducks Unlimited Canada has used aerial photography and satellite imagery to inventory millions of hectares of wetlands across Canada. In addition, the US Fish and Wildlife Service produces an annual report that summarizes the status of North American waterfowl populations and their habitats, with input from Canada (US Fish and Wildlife Service, 2017215). Figure 6.13 shows Canadian prairie pond counts during May from 1961 to 2017. The series shows substantial multi-year variability and no long-term trends. The levels closely correspond to long-term precipitation variability in the region. In many regions of Canada, wetlands are being lost due to land conversion, water-level control, and climate change (e.g., Watmough and Schmoll, 2007227; Ducks Unlimited Canada, 201067).

Figure-6.13

Ponds in the Canadian Prairies, 1961–2016

A line graph showing the total number ponds (in millions) during May across the Canadian prairies from 1961 to 2016. There is substantial year-to-year and multi-year variability in the number of ponds, with no long-term trend. The number of ponds range from a low of approximately 1.5 million in 1981, 1989, and 2002, to a high of almost 6.5 million in 1974.
Figure-6.13

Number of ponds during May in the Canadian Prairies. Vertical bars show 90% confidence intervals.

Source

Adapted from US Fish and Wildlife Service (2017).

Many small lakes in freshwater delta systems are “perched basins,” located at a higher elevation than the nearby rivers. These basins typically experience declines in water levels during drier periods and replenishment during flood events in a continuous cycle (e.g., Marsh and Lesack, 1996130; Peters et al., 2006161; Lesack and Marsh, 2010120). For example, in the Peace–Athabasca delta, evaporation exceeded precipitation from 1900 to 1940; opposite conditions prevailed from 1940 to the mid-1970s; and this was followed by a return to drier conditions that has continued through 2009 (Peters et al., 2006161; Peters, 2013157). The Mackenzie, Slave, and Saskatchewan river deltas had similar variability (e.g., Lesack and Marsh, 2010120; Peters, 2013157). Under a warmer and wetter future climate (2070–2099; ensemble of CMIP3 GCMs; high emission (A2) and medium emission (B2) scenarios), a shorter ice season (by two to four weeks), thinner ice cover, and depletion of the snowpack by mid-winter melt events are projected to lead to a major reduction in the frequency of spring ice jam flooding in the Peace–Athabasca delta (Beltaos et al., 200614). This reduction would have serious ecological implications, including accelerated loss of aquatic habitat, unless summer flood levels can reach the perched basins (Peters et al., 2006161).


Section summary

In summary, changes in surface water levels are affected by many factors, including the seasonal distribution of precipitation, inputs from snowmelt and rivers, evaporation (influenced by duration of ice cover and surface temperature), outflows, exchanges with groundwater, and the presence of permafrost. Many of the larger lakes are regulated by humans, while most other surface water bodies in Canada are monitored infrequently or not at all. For the few regions where analyses have been carried out (primarily the prairies and the Laurentian Great Lakes), evidence reveals that water levels have varied on year-to-year and multi-year timescales, with no long-term trends (see Figures 6.9, 6.11, 6.12, 6.13). Precipitation appeared to be the main driver of these fluctuations, with some of this variation being influenced by naturally occurring internal climate variability (see Chapter 2, Box 2.5). There is some evidence that high-latitude warming (see Chapter 4, Section 4.2.1.1) and associated permafrost thaw (see Chapter 5, Section 5.6.1) have affected the levels of lakes in northwestern Canada, including a higher incidence of rapid lake drainage; however, results are inconsistent.

The Laurentian Great Lakes are the only region of Canada where projected changes to future surface water levels have been examined, and these lakes are projected to show small average declines (0.2 m) in levels by the mid-21st century. However, water levels are expected to change seasonally, with an increase in water levels during the winter and early spring and a decrease in summer and early fall (see Figure 6.10). Given the close association between past water levels and surface climate, projected changes to precipitation and temperature are expected to affect future levels. However, the direction and magnitude of change will depend on the balance between future precipitation increases and increases in evaporation due to higher temperatures and longer ice-free periods. Regions of southern Canada may see declines in future water levels due to projected decreases in summer precipitation under a high emission (RCP8.5) scenario (see Chapter 4, Section 4.3.2.2) and higher evaporation associated with projected higher temperatures. There is, however low confidence in this assessment, due to the lack of future water-level studies and the complexity of factors that affect surface water levels. Since high-latitude warming (see Chapter 4, Section 4.2.1.1) and associated permafrost thaw (see Chapter 5, Section 5.6.1) have affected the levels of permafrost thaw lakes in northwestern Canada, projected warming in northern Canada (see Chapter 4, Section 4.2.1.3) and continued permafrost thaw (Chapter 5, Section 5.6.2) are expected to alter many Arctic lakes, including causing rapid drainage. Since no studies have directly assessed future water-level changes across northern Canada, there is only medium confidence in this assessment.

6.4

Soil moisture and drought

Key Message

Periodic droughts have occurred across much of Canada, but no long-term changes are evident. Future droughts and soil moisture deficits are projected to be more frequent and intense across the southern Canadian Prairies and interior British Columbia during summer, and to be more prominent at the end of the century under a high emission scenario (medium confidence).

Soil moisture directly influences runoff and flooding, since it strongly affects the amount of precipitation/snowmelt that makes its way into surface water bodies. It also determines the exchange of water and heat energy between the land surface and the atmosphere through evaporation and plant transpiration, and influences occurrence of precipitation through the recycling of moisture (see Seneviratne et al., 2010185 for a detailed explanation of soil moisture–climate interactions). There are few direct measurements of soil moisture in Canada, and amounts are therefore estimated through remote sensing (e.g., with satellites) and/or modelling. The lack of an extensive monitoring network makes it difficult to make large-scale assessments of past trends (e.g., Mortsch et al., 2015144). Future changes in soil moisture are primarily assessed using direct soil moisture output from GCMs. These changes are influenced by future precipitation and evaporation (the latter of which may be affected by changes in vegetation). However, modelled soil moisture is associated with large uncertainties, due to complexities in the representation of actual evapotranspiration, vegetation growth, and water use efficiency under enhanced atmospheric carbon dioxide concentrations (e.g., Seneviratne et al., 2010185; Wehner et al., 2017228). Longer-term climate variability, including droughts and excessive wet periods, are often directly related to soil moisture (and other aspects of freshwater availability). As a result, this section also assesses past and future changes to relevant indicators of drought.

6.4.1

Soil moisture

Quantifying soil moisture over large domains is challenging, as a result of the variability of soil moisture over time and among regions (Famiglietti et al., 200875). Several national-scale soil moisture networks exist globally (Doringo et al., 201166), including two in the United States (Schaefer et al., 2007178; Bell et al., 201312). While there is no national network across Canada, there are some regional/provincial sites. For example, Alberta has monitored drought for the past 15 years, including soil moisture conditions, over a large network within the province, while Saskatchewan, Manitoba, and Ontario have established soil moisture and weather monitoring stations for selected regions. These networks have been used for validation of remote sensing data (described below) (e.g., Adams et al., 20152; Pacheco et al., 2015154; Champagne et al., 201645) and for calibration and validation of hydrological models (Hayashi et al., 201095). Due to the difficulties (including high costs) of direct soil moisture monitoring, numerous remote sensing approaches have been used (Chan et al., 201646; Colliander et al., 201752). At present, continuous estimates of soil moisture for Canada as a whole are available from the Soil Moisture and Ocean Salinity (SMOS) satellite mission (2010–present) and more recently as part of the Soil Moisture Active Passive (SMAP) Mission (2015–present) (e.g., Champagne et al., 201144, 201243). SMOS data are distributed by Agriculture and Agri-Food Canada (<http://open.canada.ca/data/en/dataset/723bbb4c-d209-4599-b39b-0ede5a0a0371>).

A limitation to estimates of soil moisture from remote sensing is the relatively shallow observation depth, which is generally limited to the top few centimetres from the surface. Deeper values within the root zone (i.e., the top metre) are often determined using data assimilation systems, in which soil moisture data from satellite sensors are merged with estimates from a hydrological model (e.g., Reichle et al., 2017168). In Canada, this is done operationally and nationally as part of the Canadian Land Data Assimilation System (Carrera et al., 201539). Due to the relatively short record, no studies have examined trends in these data. Daily soil moisture values in the Canadian prairie provinces for three soil layer depths (0–20 cm, 20–100 cm and 0–100 cm) were, however, reconstructed from 1950 to 2009 using the Variable Infiltration Capacity (VIC) land-surface hydrology model. The reconstructed soil moisture matched past observations across the prairies, but no trends were reported (Wen et al., 2011229).

There have been a few global studies of future soil moisture using GCM output. An ensemble of 15 CMIP3 GCMs projected a decrease in June–August soil moisture for most of Canada for the late century under a medium-high emission scenario (SRES 1Ab) (Wang, 2005225). Projected late-century changes in surface, total, and layer-by-layer soil moisture from 25 GCMs included in CMIP5 under a high emission scenario (RCP8.5) indicated that, in most mid-latitudes of the Northern Hemisphere, including southern Canada, the top 10 cm of soil will become drier during the summer, but the remainder of the soil, down to 3 m, will stay wet (Berg et al., 201616; Wehner et al., 2017228).

6.4.2

Drought

Drought is often defined as a period of abnormally dry weather long enough to cause a serious hydrological imbalance (e.g., Seneviratne et al., 2012186) and therefore impacts on several components of the water cycle. These impacts can also be exacerbated by increases in evapotranspiration associated with high temperatures. Drought impacts differ, however, depending on their timing. In general, warm-season droughts affect not only agricultural production (usually due to soil moisture deficits) but also surface and subsurface water levels. Precipitation deficits associated with the runoff season (including winter snow accumulation) primarily affect the replenishment of freshwater systems.

Numerous indices of drought (which also identify moisture surplus) have been used to characterize their occurrence and intensity. The indices incorporate various hydroclimatic inputs (e.g., precipitation, temperature, streamflow, groundwater, and snowpack), and each index has its own strengths and weaknesses (see WMO, 2016237 for a comprehensive list). Some indices are based on precipitation alone (e.g., the Standardized Precipitation Index [SPI] (McKee et al., 1993134) and do not take into account that higher temperatures are often associated with below-normal precipitation. As a result, enhanced evapotranspiration is not considered. A few indices incorporate precipitation and estimates of potential evapotranspiration (based on air temperature) — for example, the Palmer Drought Severity Index (PDSI) (Palmer, 1965156) and the Standardized Precipitation Evapotranspiration Index (SPEI) (Vicente-Serrano et al., 2010220). A shortcoming of these indices is that they use potential evapotranspiration as a proxy for actual evapotranspiration and, thus, do not consider how soil moisture and vegetation may limit evapotranspiration and subsequent drought development. This can lead to overestimation of drought intensity, particularly for climate change projections (e.g., Donohue et al., 201065; Milly and Dunne, 2011137, 2016138; Shaw and Riha, 2011187). The vast majority of global-scale and Canadian analyses of historical trends and projected future changes to drought have used indices based on precipitation alone or on the combined effects of temperature and precipitation (e.g., Bonsal et al., 201123), and these are the focus of this assessment.

A few global studies have highlighted past trends in specific regions, including, for example, drying over mid-latitude regions of Canada from 1950 to 2008 (Dai, 201155 using PDSI). However, since the beginning of the 20th century, the frequency of global drought remains generally unchanged; it appears that, over this longer period, increases in global temperature and potential evapotranspiration have been offset by increases in annual precipitation (e.g., Sheffield et al., 2012188; McCabe and Wolock, 2015133). Trend analyses in Canadian drought are fragmented, with no comprehensive country-wide analyses to date. The majority have focused on the Prairie region, because of the greater frequency of drought in this region (e.g., Mortsch et al., 2015144). A Canadian drought review (Bonsal et al., 201123) provided examples of 20th-century changes in PDSI for individual stations in various regions of the country (1900 to 2007) (see Figure 6.14). Considerable multi-year variability is evident, with no discernible long-term trends. This variability was also apparent in regional studies of SPEI (1900–2011) in summer (June–August) and over the “water year” (October–September) in southeastern Alberta and southwestern Saskatchewan (Bonsal et al., 201722) and the Athabasca River Basin (Bonsal and Cuell, 201718). Other Canadian Prairie region drought studies have highlighted periodic droughts during the 1890s, 1910s, 1930s, 1980s, and early 2000s (e.g., Chipanshi et al., 200650; Bonsal and Regier, 200719; Bonsal et al., 201321). From the mid-to-late 2000s to approximately 2014, the Prairie region has experienced exceptionally wet conditions, highlighting the high variability in this region (e.g., Bonsal et al., 201722).

Figure-6.14

Annual Palmer Drought Severity Index for four selected Canadian locations, 1900–2007

Line graphs show annual values and corresponding 10-year running means of the Palmer Drought Severity Index from 1900 to 2007 for (a) Kamloops, British Columbia, (b) Saskatoon, Saskatchewan, (c) Sherbrooke, Quebec, and (d) Yarmouth, Nova Scotia. For all locations, there is considerable multi-year variability, with extended years of negative values (drier conditions) followed by extended years of positive values (wetter conditions) throughout the period. There are no discernible long-term trends.
Figure-6.14

Annual Palmer Drought Severity Index (PDSI) values from 1900 to 2007 for (a) Kamloops, British Columbia, (b) Saskatoon, Saskatchewan, (c) Sherbrooke, Quebec, and (d) Yarmouth, Nova Scotia. Solid lines represent 10-year running means. Positive values indicate wetter conditions, negative values indicate drier conditions.

Source

Bonsal et al. (2011).

In other areas of the country, the Canadian Drought Code (based on maximum temperature and precipitation) showed that drought severity over the southern boreal forest regions of Canada was variable, with no long-term trend from 1913 to 1998 (Girardin et al., 200485). A more recent analysis using PDSI and the Climate Moisture Index (difference between annual precipitation and annual potential evapotranspiration) indicated that, for the Canadian boreal zone as a whole, several regions experienced significant drying between 1951 and 2010, but there were also some areas with significant wetting (Wang et al., 2014226). An analysis of 20th century (1920–1999) drought events in southern Ontario revealed occurrences in 1930, 1933, 1934, 1936, 1963, 1998, and 1999, with no long-term trend (Klaassen, 2002114). Canada-wide trends in actual evapotranspiration from 1960 to 2000 showed significant increasing values at 35% of the station locations, mainly on the Pacific and Atlantic coasts and in the Laurentian Great Lakes/St. Lawrence zones (Fernandes et al., 200777). Other studies found that annual actual evapotranspiration trends in the Prairie region were mixed (e.g., Gan, 199883). Observed pan evaporation and estimated potential evapotranspiration for 11 Prairie region sites from the 1960s to early 2000s showed significant decreasing and increasing trends at different sites. Overall, more locations had decreases in potential evapotranspiration, and these were concentrated during June and July (Burn and Hesch, 200629).

No Canadian studies have attempted to directly attribute past trends in drought to anthropogenic climate change, although there has been some research on the 2015 extreme drought event in western Canada. Anthropogenic climate change increased the likelihood of the extremely warm spring, but no human influence was detected on the persistent drought-producing weather pattern (Szeto et al., 2016207).

To date, no Canada-wide studies of future drought projections have been carried out. There are, however, several regional-scale analyses, with the majority focusing on the Prairie region and incorporating one or more drought indices. For example, output from three CMIP3 GCMs incorporating high (A2), medium-high (A1B), and medium (B2) emission scenarios were used to project future (2011–2100) summer PDSI over the southern Canadian prairies. More persistent droughts are projected, particularly after 2040, and multi-year droughts of 10 or more years are projected to become more probable (Bonsal et al., 201321). Similarly, the Canadian Regional Climate Model, under a high emission (A2) scenario, projected that long droughts of six to 10 months will increase and become more severe by mid-century across southern Manitoba and Saskatchewan and the eastern slopes of the Rocky Mountains. However, in the northern Prairie region, long drought events will be less severe and less frequent (PaiMazumder et al., 2012155). A number of other studies of the Prairie region have examined drought changes for the mid-century period using several climate models that are part of the North American Regional Climate Change Assessment Program (Mearns et al., 2009135). For the southern Prairie region, results under a high emission scenario (A2) indicated an overall increased drought risk for both summer and winter. There were considerable differences among models, with projections ranging from a substantial increase in drought with a higher degree of year-to-year variability, to relatively no change from current conditions (Jeong et al., 2014107; Masud et al., 2017132; Bonsal et al., 201722). Further north, in the Athabasca River Basin, projections revealed an average change toward more summer drought, but, again, there was a substantial range among the climate models (Bonsal and Cuell, 201718). Future annual and summer SPEI changes over all western Canadian river basins were assessed with six CMIP5 GCMs for the periods 2041–2070 and 2071–2100 (relative to 1971–2000) using medium emission (RCP4.5) and high emission (RCP8.5) scenarios. Southern watersheds showed a gradual increase in annual water deficit throughout the 21st century, while the opposite was true for northern basins. For summer, however, all river basins except those in the extreme north are expected to experience decreasing water availability (see Figure 6.15) (Dibike et al., 201764). Twelve CMIP3 GCMs incorporating medium (B1), medium-high (A1B), and high (A2) emission scenarios showed that, by the end of the 21st century, the combined changes in precipitation and temperature will lead to generally drier conditions in much of the boreal forest region of western Canada and to a higher likelihood of drought. However, some regions in the east may become slightly wetter (Wang et al., 2014226).

Figure-6.15

Changes in mean annual Standardized Precipitation Evapotranspiration Index for western Canadian watersheds

Four maps show projected annual and summer changes to the Standardized Precipitation Evapotranspiration Index for western Canada, extending from 50° north latitude to 70° north latitude and from 140° west longitude to 100° west longitude. Major western Canadian watersheds are also shown. The top two maps show projected annual and summer changes for the 2041 to 2070 period, and the bottom two maps show projected annual and summer changes for the 2071 to 2100 period. For annual values, projected drier areas encompass only the extreme southern regions in the 2041 to 2070 period and expand northward and intensify for the 2071 to 2100 period. For summer values, the southern half of the map shows drier conditions in the 2041 to 2070 period, but, for the 2071 to 2100 period, drier conditions encompass almost the entire map, with very dry conditions projected for the southern half of the region.
Figure-6.15

Changes in mean annual Standardized Precipitation Evapotranspiration Index (SPEI) (left) and summer (June–August) SPEI (right) between the baseline (1971–2000) and 2041–2070 (top) and between baseline and 2071–2100 (bottom) for western Canadian watersheds. SPEI is determined from temperature and precipitation output from an ensemble of six CMIP5 GCMs under a high emission (RCP8.5) scenario. Positive values indicate wetter conditions, negative values indicate drier conditions.

Source

Dibike et al. (2017).

These future projections are consistent with other North American and global-scale studies using similar drought indices. For instance, drought projections using numerous CMIP5 GCMs (medium emission (RCP4.5) scenario) showed that the frequency of severe-to-extreme drought conditions is expected to increase by the late 21st century for much of southern Canada, including southeast British Columbia, the prairies and Ontario (as measured by PDSI and soil moisture) (Dai, 201256; Zhao and Dai, 2015240, 2016241). Similar results have been projected using PDSI and SPEI under a high emission (RCP 8.5) scenario (Cook et al., 201453; Touma et al., 2015211). This included increases in drought magnitude and frequency over western, central, and eastern North America, with the greatest change over western and central regions. Year-to-year variability in SPI was projected to increase by the end of century (2080–2099) in various regions of North America, suggesting more extremes; however, there was considerable uncertainty in these results, due to large differences among regions and among the 21 CMIP5 GCMs (Swain and Hayhoe, 2015205). Although there is overall consistency regarding the increased likelihood of future drought over southern interior continental regions of Canada, there is uncertainty concerning the magnitude of these changes. This is primarily due to shortcomings of the indices that estimate potential evapotranspiration, which may lead to an overestimation of drought intensity (e.g., Sheffield et al., 2012188; Trenberth et al., 2014213; Milly and Dunne, 2016138).


Section summary

In summary, records of directly measured and/or remotely sensed soil moisture are not long enough to assess past changes. Climate change impacts on soil moisture specifically for Canada have not been studied, although there have been a few global-scale studies. Results revealed a general consensus that summer soil moisture will decrease at the end of this century under medium to high emission scenarios in several interior continental regions of the globe, including southern Canada (interior British Columbia and the southern prairies). These are also the areas of Canada where droughts are projected to become more frequent, due to increased evapotranspiration from higher temperatures. However, there is considerable uncertainty in future soil moisture projections, due to the complexity of interactions among precipitation, evapotranspiration, and vegetation, which are inherently difficult to model and simulated in varying ways among individual models . Therefore, there is medium confidence that summer soil moisture will decrease in future in southern interior regions of Canada.

There have been several regional-scale assessments of past drought occurrence, with the majority focusing on the Prairie region. Results revealed that, for the most part, droughts have been characterized by year-to-year and multi-year variations (see Figure 6.14). This finding is consistent with the assessment of surface water levels (see Section 6.3). No Canada-wide studies of projected future droughts are currently available, but several have been carried out in western Canada (primarily the Prairie region). There is agreement among these studies concerning increased frequency and intensity of droughts, particularly at the end of century under higher emission scenarios. This is consistent with several global-scale drought studies that primarily showed increased drought potential in summer over continental interior regions (including interior British Columbia and the southern Prairie region). However, all of these studies incorporated drought indices in which large increases in potential evapotranspiration (based solely on future temperature changes) were considered the major reason for widespread drying. Approaches using potential evapotranspiration as a proxy for actual evapotranspiration do not consider how soil moisture and vegetation may limit evapotranspiration and subsequent drought development. Therefore, these studies tend to overestimate future drought intensity, thus increasing the uncertainty of future drought projections. As a result, there is only medium confidence in the projected increased frequency and intensity of droughts over southern interior regions of Canada (see FAQ 6.1).

6.5

Groundwater

Key Message

The complexity of groundwater systems and a lack of information make it difficult to assess whether groundwater levels have changed since records began. It is expected that projected changes to temperature and precipitation will influence future groundwater levels; however, the magnitude and even direction of change is not clear. Spring recharge of groundwater aquifers over most of the country is anticipated to occur earlier in the future, as a result of earlier snowmelt (medium confidence).

Groundwater is water found underground in the cracks and spaces in soil, sand, and rock. It is formed from precipitation and surface water that seeps into the ground to form aquifers (a body of saturated rock through which water can easily move). Ground and surface water are inextricably interconnected, as groundwater discharges into rivers, lakes, wetlands, and reservoirs. Thus, the amount and availability of groundwater influence surface water. In addition, groundwater plays an important role in sustaining baseflow for many Canadian rivers (see Section 6.2.1). Groundwater is generally measured at local (individual wells) or aquifer scales (hundreds of square kilometres). In Canada, the principal source of data is provincial government agencies, which hold observations of groundwater levels, water well records, hydrogeological maps, and information on groundwater extraction (CCME, 201040). Although provincial wells represent direct data for the estimation of aquifer recharge, the data are localized and typically short-term (around 30 years, with none longer than 50 years) (Rivard et al., 2009170). Wells may not be located near climate and/or streamflow stations, making comparisons with surface conditions difficult, and can also be affected by groundwater withdrawal (Rivera et al., 2004172). Recently, however, large-scale aquifers have been mapped using remote sensing, a method that shows great future potential (see Box 6.3). Future groundwater changes are assessed using climate output (e.g., precipitation and surface air temperature) from numerous GCMs that are incorporated into various groundwater and hydrological models. These numerous models and the complexity of groundwater systems make for a large degree of uncertainty in assessing future groundwater changes (e.g., Smerdon, 2017193).

Groundwater recharge (replenishment) occurs several ways: through infiltration of rain and/or snowmelt water, via exchange from rivers or reservoirs, and from depressions in the landscape fed by surface runoff (Allen et al., 20143). Most studies consider recharge as a percentage of precipitation, but the percentage varies greatly, depending on the region’s climate and the geological and hydraulic characteristics of the aquifer. In Canada, recharge rates are typically 65% or less of annual precipitation (Rivera, 2014171) but are difficult to quantify, particularly over large regions. Determining these rates normally requires measuring precipitation and then performing a water balance by approximating all the other surface water fluxes (runoff, evaporation, and transpiration). There are marked regional differences in groundwater recharge estimates across the Canadian landmass. In eastern Canada, these vary between 1000 and 1500 mm per year; in the Prairie region, between 50 and 400 mm per year; and in British Columbia, 500 to 2000 mm per year (although considerable uncertainty exists) (Allen et al., 20143). There is not enough information to estimate recharge rates for northern Canada.

Groundwater discharge (i.e., loss of water) occurs through discharge to a surface water body, flow through formations, or pumping from a well. In semi-arid regions, such as the Canadian prairies, direct evaporation and/or evapotranspiration from the shallow water table is the primary mechanism for groundwater loss. Groundwater discharge is also difficult to quantify, especially in areas dominated by well pumping or evaporation.

Only one study of trends in groundwater levels in Canada has been carried out. Analyses of available data from provincial wells (138 with 30 years’ data and 53 with 40 years’ data, distributed over six provinces) showed that approximately 80% of the wells had significant trends (see Figure 6.18). Mixed trends were generally observed across most of western Canada, while, for the Maritime provinces, decreasing trends dominated in the 30-year record. Overall, the number of upward and downward trends was similar, and, in some cases, nearby wells had opposite trends. This is not surprising, since some wells are more affected by pumping than others. The authors stated that these trends could be attributed to climate variations (e.g., more rain that has not been counterbalanced by increased evapotranspiration) but also to human activities (changes in land use, pumping, artificial recharge) or to the statistical methods used for trend estimation (Rivard et al., 2009170).

Figure-6.18

Annual mean groundwater level trends for selected areas of Canada

Figure shows two maps of Canada that use proportional triangles to depict past trends in annual mean groundwater levels, measured in metres per year. The top map shows locations with 30 years of records, and the bottom map shows locations with 40 years of records. There are 138 locations with 30 years of data and 53 with 40 years of data, and these are distributed over British Columbia, Alberta, Saskatchewan, Manitoba, New Brunswick, and Nova Scotia. Both maps show a mixture of significant increasing and significant decreasing trends across most of western Canada. For the Maritime provinces, significant decreasing trends dominated in the 30-year record. Overall, the number of upward and downward trends is similar.
Figure-6.18

Trends for annual mean groundwater levels for 30-year (1976–2005, top) and 40-year (1966–2005, bottom) series. b represents the magnitude of the trend in metres per year. Significant trends denote that there is only a 10% possibility that such changes are due to chance.

Source

Modified from Rivard et al. (2009).

Some case studies have compared groundwater levels with precipitation (i.e., wet and dry periods) and determined that the two variables tend to mirror each other, with groundwater levels responding to precipitation after a delay, which varies depending on the region (e.g., Chen et al., 200248, 200449). For example, Figure 6.19 shows annual precipitation at the Winnipeg James Armstrong Richardson International Airport and average water levels from 24 groundwater wells in the Winnipeg area. The groundwater response has a delay of approximately 2.2 years (upper graph). If annual precipitation is shifted forward by 2.2 years, the two variables are significantly correlated (there is only a 5% possibility that such changes are due to chance) (r = 0.85, lower graph). Annual mean temperature had a significant negative correlation (= −0.72) with groundwater levels (Chen et al., 200449). Over the last few decades, the annual recharge in a small prairie watershed in Alberta was significantly correlated with a combination of growing season (May–September) precipitation and snowmelt runoff (Hayashi and Farrow, 201494). For eastern Canada, aquifer recharge in Quebec, New Brunswick, and Prince Edward Island varied in a similar fashion to precipitation (over the 1960–2000 period), particularly at the New Brunswick site (Allen et al., 20143). The relationship was most prevalent on long-term timescales (decades), but was not consistent over time. Therefore, there is some evidence that precipitation variability can affect groundwater recharge, with shallower systems responding more quickly than deeper aquifers (Allen et al., 20143).

Figure-6.19

Precipitation and groundwater levels in the Winnipeg area, 1968–2003

Two line graphs show annual precipitation (in millimetres) recorded at the Winnipeg James Armstrong Richardson International Airport and average standardized groundwater levels from 24 monitoring wells in the Winnipeg, Manitoba, area for the period 1968 to 2003. The top graph shows that the groundwater response has a delay of approximately 2.2 years relative to the precipitation. In the bottom map, annual precipitation is shifted forward by 2.2 years, and the two variables match very well.
Figure-6.19

Annual precipitation and average standardized groundwater levels in 24 monitoring wells in the Winnipeg, Manitoba, area. The upper graph shows actual values, while the lower graph provides values with precipitation shifted later by 2.2 years (as denoted by the Δτ in the upper graph).

Source

Allen et al. (2014).

Future changes in temperature and precipitation are expected to alter groundwater recharge (through changes to runoff, evapotranspiration, and snow accumulation). Several studies have reviewed various aspects of climate change and groundwater recharge over different regions of the world and emphasized the large degree of uncertainty in modelling future recharge. At present, it is not possible to clearly project the magnitude of future groundwater recharge or whether recharge will increase or decrease (e.g., Rivard et al., 2009170; Smerdon, 2017193). There have been a few regional-scale studies of the potential effect of climate change on future (various time periods) recharge across Canada, and these also show a wide range of results. For example, in south-central British Columbia, higher recharge is projected from spring to summer (Scibek and Allen, 2006183), whereas, in southern Manitoba’s shallow aquifers, recharge may decrease, mainly due to increasing temperature (Chen et al., 200449). For Ontario as a whole, projected recharge rates for several watersheds averaged between increases of 32% and decreases of 3% (Southarm et al., 1999195; Jyrkama and Sykes, 2007109; Sultana and Coulibaly, 2011204; Oni et al., 2014153; Nikolik and Simonovic, 2015152; Motiee and McBean, 2017145). Quebec tended to show lower recharge changes, ranging from decreases of 10% to increases of 20% (Sulis et al., 2011203, 2012202; Bourgault et al., 201424; Levison et al., 2014a121, 2014b122; CEHQ, 201542; Lemieux et al., 2015119; Levison et al., 2016123), while, in the Atlantic provinces, average changes were between decreases of 8% and increases of 30% (Kurylyk and MacQuarrie, 2013115; Green and MacQuarrie, 201487; Kurylyk et al., 2014116; Rivard et al., 2014169). In most of these eastern Canadian analyses, a shift to earlier recharge due to earlier snowmelt was consistently projected.


Section summary

In summary, groundwater levels are difficult to assess, due their complexity within the Canadian landscape and due to human pressures (e.g., withdrawals). The only national-scale analysis (for provinces where data were available) identified both increasing and decreasing trends in groundwater levels over the past 30 to 40 years; in some cases, nearby wells had opposite trends (see Figure 6.18). In some regional studies, observed changes in levels were reflected in longer-term variations in precipitation and snowmelt, particularly for shallow aquifers (see Figure 6.19). However, relationships in many regions of the country have not been analyzed, and, as a result, it is difficult to establish a direct climate-groundwater link for the period of observations.


A few studies have assessed impacts of climate change on groundwater recharge over different regions of the world and emphasized the large degree of uncertainty in modelling future recharge. Site-specific climate change studies in Canada revealed both increases and decreases. These studies incorporate different surface and groundwater models, as well as a variety of climate models, emission scenarios, and future time horizons. In addition, they do not include all regions of the country, with notable gaps in northern Canada. Since there is evidence for an association between precipitation, snowmelt, and — to a lesser extent — temperature, on the one hand, and groundwater recharge, on the other, it is anticipated that projected future changes in these variables will impact future groundwater levels. However, due to the complexities and lack of consistent evidence, there is a high degree of uncertainty in the magnitude and even the direction of change. Furthermore, the extent of future groundwater withdrawals is unknown, thus adding to the uncertainty. Nonetheless, many studies show a seasonal shift toward earlier recharge in association with projected earlier snowmelt and, thus, there is medium confidence that spring recharge of groundwater aquifers over most of the country will occur earlier in the future.


Acknowledgements

  • Hayley O’Neil, University of Victoria

Footnotes

  1. This report uses the same calibrated uncertainty language as in the IPCC’s Fifth Assessment Report. The following five terms are used to express assessed levels of confidence in findings based on the availability, quality and level of agreement of the evidence: very low, low, medium, high, very high. The following terms are used to express assessed likelihoods of results: virtually certain (99%–100% probability), extremely likely (95%–100% probability), very likely (90%–100% probability), likely (66%–100% probability), about as likely as not (33%–66% probability), unlikely (0%–33% probability), very unlikely (0%–10% probability), extremely unlikely (0%–5% probability), exceptionally unlikely (0%–1% probability). These terms are typeset in italics in the text. See chapter 1 for additional explanation.

References

  1. Abdul Aziz, O.I. and Burn, D.H. (2006): Trends and variability in the hydrological regime of the Mackenzie River Basin; Journal of Hydrology, v. 319, p. 282–294.
  2. Adams, J.R., McNairn, H., Berg, A.A. and Champagne, C. (2015): Evaluation of near-surface soil moisture data from an AAFC monitoring network in Manitoba, Canada: Implications for L-band satellite validation; Journal of Hydrology, v. 521, p. 582–592.
  3. Allen, D., Hayashi, M., Nastev, M., Chen, Z. and Turner, B. (2014): Recharge and Climate; Chapter 4 in Canada’s Groundwater Resources, (ed.) A. Rivera; Fitzhenry & Whiteside Limited, Markham, Ontario, p. 101–148.
  4. Angel, J.R. and Kunkel, K.E. (2010): The response of Great Lakes water levels to future climate scenarios with an emphasis on Lake Michigan-Huron; Journal of Great Lakes Research, v. 36, p. 51–58.
  5. Argyilan, E.P. and Forman, S.L. (2003): Lake level response to seasonal climatic variability in the Lake Michigan-Huron system from 1920 to 1995; Journal of Great Lakes Research, v. 29, p. 488–500.
  6. Arisz, H., Dalton, S., Scott, D. and Burrell, B.C. (2011): Trends in New Brunswick hydrometric data; in Proceedings of the Annual Conference of the Canadian Society for Civil Engineering, 14–17 June 2011, Ottawa, Ontario, p. 2995–3005.
  7. Assani, A.A., Landry, R. and Laurencelle, M. (2012): Comparison of interannual variability modes and trends of seasonal precipitation and streamflow in Southern Quebec (Canada); River Research and Applications, v. 28, p. 1740–1752.
  8. Barnett, T.P., Adam, J.C. and Lettenmaier, D.P. (2005): Potential Impacts of a warming climate on water availability in snow-dominated regions; Nature, v. 438, p. 303–309.
  9. Bates, B.C., Kundzewics, Z.W., Wu, S. and Palutikof, J.P. (2008): Climate Change and Water; Technical Paper of the Intergovernmental Panel on Climate Change, IPCC Secretariat, Geneva, Switzerland, 210 p.
  10. Bawden, A.J., Linton, H.C., Burn, D.H. and Prowse, T.D. (2014): A spatiotemporal analysis of hydrological trends and variability in the Athabasca River region, Canada; Journal of Hydrology, v. 509, p. 333–342.
  11. BCMOE [British Columbia Ministry of the Environment] (2016): Indicators of Climate Change for British Columbia 2016 Update; British Columbia Ministry of the Environment, <http://www2.gov.bc.ca/assets/gov/environment/research-monitoring-and-reporting/reporting/envreportbc/archived-reports/climate-change/climatechangeindicators-13sept2016_final.pdf>
  12. Bell, J.E., Palecki, M.A., Baker, C.B., Collins, W.G., Lawrimore, J.H., Leeper, R.D., Hall, M.E., Kochendorfer, J., Meyers, T.P., Wilson, T. and Diamond, H.J. (2013): U.S. Climate Reference Network soil moisture and temperature observations; Journal of Hydrometeorology, v. 14, p. 977–988.
  13. Beltaos S. (2002): Effects of climate on mid-winter ice jams; Hydrological Processes, v. 16, p. 789–804.
  14. Beltaos, S., Prowse, T., Bonsal, B., Carter, T., MacKay, R., Romolo, L., Pietroniro, A. and Toth, B. (2006): Climatic effects on ice-jam flooding of the Peace-Athabasca Delta; Hydrological Processes, v. 20, p. 4031–4050.
  15. Bennett, K.E., Werner, A.T. and Schnorbus, M. (2012): Uncertainties in hydrologic and climate change impact analyses in headwater basins of British Columbia; Journal of Climate, v. 25, p. 5711–5730.
  16. Berg, A., Sheffield, J. and Milly, P.C.D (2016): Divergent surface and total soil moisture projections under global warming; Geophysical Research Letters, v. 44, p. 236–244.
  17. Bohrn, S.K. (2012): Climate change impacts assessment and uncertainty analysis at the hydrology of a northern, data-sparse catchment using multiple hydrological models; Master’s thesis, Civil Engineering, University of Manitoba, Winnipeg, 207 p., <http://mspace.lib.umanitoba.ca//handle/1993/13692&gt;
  18. Bonsal, B.R. and Cuell, C. (2017): Hydro-climatic variability and extremes over the Athabasca river basin: Historical trends and projected future occurrence; Canadian Water Resources Journal, v. 42, p. 315–335. doi:10.1080/07011784.2017.1328288
  19. Bonsal, B.R. and Regier, M. (2007): Historical comparison of the 2001/2002 drought in the Canadian Prairies; Climate Research, v. 33, p. 229–242.
  20. Bonsal, B.R. and Shabbar, A. (2008): Impacts of large-scale circulation variability on low streamflows over Canada: A review; Canadian Water Resources Journal, v. 33, p. 137–154.
  21. Bonsal, B.R., Aider, R. Gachon, P. and Lapp, S. (2013): An Assessment of Canadian Prairie drought: Past, present, and future; Climate Dynamics, v. 41, p. 501–516.
  22. Bonsal, B.R., Cuell, C., Wheaton, E., Sauchyn, D.J. and Barrow E. (2017): An assessment of historical and projected future hydro-climatic variability and extremes over southern watersheds in the Canadian Prairies; International Journal of Climatology, v. 37, p. 3934–3948. doi:10.1002/joc.4967
  23. Bonsal, B.R., Wheaton, E.E., Chipanshi, A., Lin, C., Sauchyn, D.J. and Wen, L. (2011): Drought research in Canada: A review; Atmosphere-Ocean, v. 49, p. 303–319.
  24. Bourgault, M.A., Larocque, M. and Roy, M. (2014): Simulation of aquifer-peatland-river interactions under climate change; Hydrology Research, v. 45, p. 425–440.
  25. Boyer, C., Chaumont, D., Chartier, I. and Roy, A.G. (2010): Impact of climate change on the hydrology of St. Lawrence tributaries; Journal of Hydrology, v. 384, p. 65–83.
  26. Brabets, T.P. and Walvoord, M.A. (2009): Trends in streamflow in the Yukon River Basin from 1944 to 2005 and the influence of the Pacific Decadal Oscillation; Journal of Hydrology, v. 371, p. 108–119.
  27. Burn, D.H. (2008): Climatic influences on streamflow timing in the headwaters of the Mackenzie River Basin; Journal of Hydrology, v. 352, p. 225–238.
  28. Burn, D.H. and Hag Elnur, M.H. (2002): Detection of hydrologic trends and variability; Journal of Hydrology, v. 255, p. 107–122.
  29. Burn, D.H. and Hesch, N.M. (2006): A comparison of trends in potential and pan evaporation for the Canadian Prairies; Canadian Water Resources Journal, v. 31, p. 173–184.
  30. Burn D.H. and Whitfield, P.H. (2016): Changes in floods and flood regimes in Canada; Canadian Water Resources Journal, v. 41, p. 139–150. doi: 10.1080/07011784.2015.1026844
  31. Burn, D.H., Abdul Aziz, O.I. and Pietroniro, A. (2004a): A comparison of trends in hydrological variables for two watersheds in the Mackenzie River Basin; Canadian Water Resources Journal, v. 29, p. 283–298.
  32. Burn, D.H., Cunderlik, J.M. and Pietroniro, A. (2004b): Hydrological trends and variability in the Liard River basin; Hydrological Sciences Journal, v. 49, p. 53–67.
  33. Burn, D.H., Fan, L. and Bell, G. (2008): Identification and quantification of streamflow trends on the Canadian Prairies; Hydrological Sciences Journal, v. 53, p. 538–549.
  34. Burn, D.H., Sharif, M. and Zhang, K. (2010): Detection of trends in hydrological extremes for Canadian watersheds; Hydrological Processes, v. 24, p. 1781–1790. doi: 10.1002/hyp.7625
  35. Burn, D.H, Whitfield, P.H. and Sharif, M. (2016): Identification of changes in floods and flood regimes in Canada using a peaks over threshold approach; Hydrological Processes, v. 30, p. 3303–3314. doi: 10.1002/hyp.10861
  36. Bush, E.J., Loder, J.W., James, T.S., Mortsch, L.D. and Cohen, S.J. (2014): An Overview of Canada’s Changing Climate; Chapter 2 in Canada in a Changing Climate: Sector Perspectives on Impacts and Adaptation, (ed.) F.J. Warren and D.S. Lemmen; Government of Canada, Ottawa, Ontario, p. 23–64, <https://www.nrcan.gc.ca/sites/www.nrcan.gc.ca/files/earthsciences/pdf/assess/2014/pdf/Chapter2-Overview_Eng.pdf>
  37. Buttle, J.M., Allen, D.M., Cassie, D., Davison, B., Hayashi, M., Peters, D.L., Pomeroy, J.W., Simonovic, S., St-Hilaire, A. and Whitfield, P.H. (2016): Flood processes in Canada, regional and special aspects; Special Issue on Floods in Canada; Canadian Water Resources Journal, v. 41, p. 7–30. doi: 10.1080/07011784.2015.1131629
  38. Canadian National Committee (1975): Canadian survey on the water balance of lakes; in International Hydrological Decade Report; Environment Canada, Ottawa, Ontario.
  39. Carrera, M.L., Bélair, S. and Bilodeau, B. (2015): The Canadian land data assimilation system (CaLDAS): Description and synthetic evaluation study; Journal of Hydrometeorology, v. 16, p. 1293–1314. doi: 10.1175/JHM-D-14-0089.1
  40. CCME [Canadian Council of Ministers of the Environment] (2010): Review and assessment of Canadian groundwater resources, management, current research mechanisms and priorities; Canadian Council of Ministers of the Environment, <http://www.ccme.ca/files/Resources/water/groundwater/gw_phase1_smry_en_1.1.pdf>. 
  41. CDA [Canadian Dam Association] (2016): Dams in Canada; Canadian Dam Association, Toronto, Ontario <https://www.cda.ca/EN/Dams_in_Canada/EN/Dams_In_Canada.aspx?hkey=11c76c52-7794-4ddf-b541-584f9ea2dbe9>.
  42. CEHQ [Centre d’Expertise Hydrique Québec] (2015): Hydroclimatic atlas of southern Québec: The impact of climate change on high, low and mean flow regimes for the 2050 horizon; Centre d’expertise hydrique du Québec, Québec, Quebec, 81 p. <https://www.cehq.gouv.qc.ca/hydrometrie/atlas/Atlas_hydroclimatique_2015EN.pdf>
  43. Champagne, C., Berg, A.A., McNairn, H., Drewitt, G. and Huffman, T. (2012): Evaluation of soil moisture extremes for agricultural productivity in the Canadian prairies; Agricultural and Forest Meteorology, v. 165, p. 1–11.
  44. Champagne, C., McNairn, H. and Berg, A.A. (2011): Monitoring agricultural soil moisture extremes in Canada using passive microwave remote sensing; Remote Sensing of Environment, v. 115, p. 2434–2444.
  45. Champagne, C., Rowlandson, T., Berg, A., Burns, T., L’Heureux, J., Tetlock, E., Adams, J.R., McNairn, H., Toth, B. and Itenfisu, D. (2016) Satellite surface soil moisture from SMOS and Aquarius: Assessment for applications in agricultural landscapes; International Journal of Applied Earth Observation and Geoinformation, v. 45, p. 143–154.
  46. Chan, S.K., Bindlish, R., O’Neill, P.E., Njoku, E., Jackson, T., Colliander, A., Chen, F., Burgin, M., Dunbar, S., Piepmeier, J., Yuch, S., Entekhabi, D., Cosh, M.H., Caldwell, T., Walker, J., Wu, X., Berg, A., Rowlandson, T., Pacheco, A., McNairn, H., Thibeault, M., Martinez-Fernadez, J., Gonzalez-Zamora, A., Seyfried, M., Bosch, D., Starks, P., Goodrich, D., Prueger, J., Palecki, M., Small, E.E., Zreda, M., Calvet, J.C., Crow, W. and Kerr, Y. (2016): Assessment of the SMAP passive soil moisture product; IEEE Transactions on Geoscience and Remote Sensing, v. 54, p. 4994–5007.
  47. Chen, J., Brissette, F.P., Poulin, A. and Leconte, R. (2011): Overall uncertainty study of the hydrological impacts of climate change for a Canadian watershed; Water Resources Research, v. 47. doi: 10.1029/2011WR010602
  48. Chen, Z., Grasby, S. and Osadetz, K. (2002): Predicting groundwater variation from climatic variables: an empirical model; Journal of Hydrology, v. 260, p. 102–117.
  49. Chen, Z., Grasby, S. and Osadetz, K. (2004): Relation between climate variability and groundwater levels in the upper carbonate aquifer, southern Manitoba, Canada; Journal of Hydrology, v. 290, p. 43–62.
  50. Chipanshi, A.C., Findlater, K.M., Hadwen, T. and O’Brien, E.G. (2006): Analysis of consecutive droughts on the Canadian Prairies; Climate Research, v. 30, p. 175–187.
  51. Cohen, S., Koshida, G. and Mortsch, L. (2015): Climate and water availability indicators in Canada: Challenges and a way forward. Part III – Future scenarios; Canadian Water Resources Journal, v. 40, p. 160–173.
  52. Colliander, A., Jackson, T.J., Bindlish, R. Chan, S., Das, N., Kim, S.B., Cosh, M.H., Dunbar, R.S., Dang, L., Pashaian, L., Asanuma, J., Aida, K., Berg, A., Rowlandson, T., Bosch, D., Caldwell, T., Caylor, K., Goodrich, D., al Jassar, H., Lopez-Baeza, E., Martínez-Fernandez, J., Gonzalez-Zamora, A., Livingston, S., McNairn, H., Pacheco, A., Moghaddam, M., Montzka, C., Notarnicola, C., Niedrist, G., Pellarin, T., Prueger, J., Pulliainen, J., Rautiainen, K., Ramos, J., Seyfried, M., Starks, P., Su, Z., Zeng, Y., van der Velde, R., Thibeault, M., Dorigo, W., Vreugdenhil, M., Walker, J.P., Wu, X., Monerris, A., O’Neill, P.E., Entekhabi, D., Njoku, E.G. and Yueh, S. (2017): Validation of SMAP surface soil moisture products with core validation sites; Remote Sensing of Environment, v. 191, p. 215–231.
  53. Cook, B.I., Smerdon, J.E., Seager, R. and Coats, S. (2014): Global Warming and 21st Century Drying; Climate Dynamics, v. 43, p. 2607–2627.
  54. Cunderlik, J.M. and Ouarda, T.M.B.J. (2009): Trends in the timing and magnitude of floods in Canada; Journal of Hydrology, v. 375, p. 471–480.
  55. Dai, A. (2011): Characteristics and trends in various forms of the Palmer Drought Severity Index during 1900–2008; Journal of Geophysical Research, v. 116, D12115. doi: 10.1029/2010JD015541
  56. Dai, A. (2012): Increasing Drought under Global Warming in Observations and Models; Nature Climate Change, v. 3, p. 52–58.
  57. DeBeer, C.M., Wheater, H.S., Carey, S.K. and Chun, K.P. (2016): Recent, climatic, cryospheric, and hydrological changes over the interior of western Canada: A review and synthesis; Hydrology and Earth System Sciences, v. 20, p. 1573–1598.
  58. Déry, S.J. and Wood, E.F. (2004): Teleconnection between the Arctic Oscillation and Hudson Bay river discharge; Geophysical Research Letters, v. 31, L18205. doi: 10.1029/2004GL020729
  59. Déry, S.J., Hernández-Henríquez, M.A., Owens, P.N., Parkes, M.W. and Petticrew, E.L. (2012): A century of hydrological variability and trends in the Fraser River Basin; Environmental Research Letters, v. 7, 024019. doi:10.1088/1748-9326/7/2/024019
  60. Déry, S.J., Mlynowski, T.J., Hernández-Henriquez, M.A. and Straneo, F. (2011): Interannual variability and interdecadal trends in Hudson Bay streamflow; Journal of Marine Systems, v. 88, p. 341–351.
  61. Déry, S.J., Stadnyk, T.A., MacDonald, M.K. and Gauli-Sharma, B. (2016): Recent trends and variability in river discharge across northern Canada; Hydrology and Earth System Sciences, v. 20, p. 4801–4818.
  62. Déry, S.J., Stahl, K., Moore, R.D., Whitfield, P.H., Menounos, B. and Burford, J.E. (2009): Detection of runoff timing changes in pluvial, nival, and glacial rivers of western Canada; Water Resources Research, v. 45, W04426. doi:10.1029/2008WR006975
  63. DFO [Fisheries and Oceans Canada] Canadian Hydrographic Service (2013): Water levels, Great Lakes and Montreal harbour; Monthly Water Level Bulletin, http://publications.gc.ca/site/eng/9.500663/publication.html.
  64. Dibike, Y.D., Prowse, T.D., Bonsal, B.R. and O’Niel, H.C.L. (2017): Implications of future climate on water availability in the western Canadian river basins; International Journal of Climatology, v. 37, p. 3247–3263.
  65. Donohue, R.J., McVicar, T.R. and Roderick, M.L. (2010): Assessing the ability of potential evaporation formulations to capture the dynamics in evaporative demand within a changing climate; Journal of Hydrology, v. 386, p. 186–197.
  66. Doringo, W.A., Wagner, W., Hohensinn, R., Hahn, S., Paulik, C., Xaver, A., Gruber, A., Drusch, M., Mecklenburg, S., van Oevelen, P., Robock, A. and Jackson, T. (2011): The international soil moisture network: a data hosting facility for global in situ soil moisture measurements; Hydrology and Earth System Sciences, v. 15, p. 1675–1698.
  67. Ducks Unlimited Canada (2010): Southern Ontario wetland conversion analysis: final report; Ducks Unlimited; Barrie, Ontario, 23 p. <http://www.ducks.ca/assets/2010/10/duc_ontariowca_optimized.pdf>.
  68. Duguay, C., Ernou, Y. and Hawkings, J. (1999): SAR and optical satellite observations of ice covered thermokarst lakes, Old Crow Flats, Yukon Territory; paper presented at 56th Eastern Snow Conference, , Fredericton, New Brunswick, Canada.
  69. Dumanski, S., Pomeroy, J.W. and Westbrook, C.J. (2015): Hydrological regime changes in a Canadian Prairie basin; Hydrological Processes, v. 29, p. 3893–3904.
  70. EBNFLO Environmental and AquaResource Inc. (2010): Guide for assessment of hydrologic effects of climate change in Ontario; prepared for the Ontario Ministry of Natural Resources and Ministry of the Environment in partnership with Credit Valley Conservation, <https://www.researchgate.net/profile/Linda_Mortsch/publication/309565142_Guide_for_assessment_of_hydrologic_effects_of_climate_change_in_Ontario/links/58adeba892851cf7ae85b0db/Guide-for-assessment-of-hydrologic-effects-of-climate-change-in-Ontario.pdf>.
  71. ECCC [Environment and Climate Change Canada] (2017): Water level and flow; Environment and Climate Change Canada, <https://wateroffice.ec.gc.ca/>.
  72. Ehsanzadeh, E. and Adamowski, K. (2007): Detection of trends in low flows across Canada; Canadian Water Resources Journal, v. 32, p. 251–264.
  73. El-Jabi, N., Turkkan, N. and Caissie, D. (2013): Regional climate index for floods and droughts using Canadian Climate Model (CGCM3.1); American Journal of Climate Change, v. 2, p. 106–115.
  74. Eum, H., Dibike, Y. and Prowse, T. (2017): Climate-induced alteration of hydrologic indicators in the Athabasca River Basin, Alberta, Canada; Journal of Hydrology, v. 544, p. 327–342.
  75. Famiglietti, J.S., Ryu, D., Berg, A., Rodell, M. and Jackson, T.J. (2008): Field observations of soil moisture availability across scales; Water Resources Research, v. 44, W01423. doi:10.1029/2006WR005804
  76. Federal, Provincial and Territorial Governments of Canada (2010): Canadian Biodiversity: Ecosystem Status and Trends 2010; Canadian Councils of Resource Ministers, Ottawa, Ontario, 142 p.
  77. Fernandes, R., Korolevych, V. and Wang, S. (2007): Trends in land evapotranspiration over Canada for the period 1960–2000 based on in situ climate observations and a land surface model; Journal of Hydrometeorology, v. 8, p. 1016–1030.
  78. Fleming, S.W. (2010): Signal-to-noise ratios of geophysical and environmental time series; Environmental and Engineering Geoscience, v. 16, p. 389–399.
  79. Fleming, S.W. and Clarke, G.K.C. (2003): Glacial control of water resource and related environmental responses to climatic warming: Empirical analysis using historical streamflow data from Northwestern Canada; Canadian Water Resources Journal, v. 28, p. 69–86.
  80. Fleming, S.W. and Weber, F.A. (2012): Detection of long-term change in hydroelectric reservoir inflows: Bridging theory and practice; Journal of Hydrology, v. 470, p. 36–54.
  81. Forbes, K.A., Kienzle, S.W., Coburn, C.A., Byrne, J.M. and Rasmussen, J. (2011): Simulating the hydrological response to predicted climate change on a watershed in southern Alberta, Canada; Climatic Change, v. 105, p. 555–576.
  82. Fournier, R.A., Grenier, M., Lavoie, A. and Hélie, R. (2007): Towards a strategy to implement the Canadian Wetland Inventory using satellite remote sensing; Canadian Journal of Remote Sensing, v. 33, p. S1–S16.
  83. Gan, T.Y. (1998): Hydroclimatic trends and possible climatic warming in the Canadian Prairies; Water Resources Research, v. 34, p. 3009–3015.
  84. Ghanbari, R.N. and Bravo, H.R. (2008): Coherence between atmospheric teleconnections, Great Lakes water levels, and regional climate; Advances in Water Resources, v. 31, p. 1284–1298.
  85. Girardin, M.P., Tardif, J. Flannigan, M.D., Wotton, B.M. and Bergeron, Y. (2004): Trends and periodicities in the Canadian drought code and their relationships with atmospheric circulation for the southern boreal forest; Canadian Journal of Forest Research, v. 34, p. 103–119.
  86. GLERL [Great Lakes Environmental Research Laboratory] (2017): GLERL Great Lakes monthly hydrologic data (1860–Recent), <https://www.glerl.noaa.gov/ahps/mnth-hydro.html>.
  87. Green, N.R. and MacQuarrie, K.T.B. (2014): An evaluation of the relative importance of the effects of climate change and groundwater extraction on seawater intrusion in coastal aquifers in Atlantic Canada; Hydrogeology Journal, v. 22, p. 609–623.
  88. Grillakis, M.G., Koutroulis, A.G. and Tsanis, I.K. (2011): Climate change impact on the hydrology of Spencer Creek watershed in Southern Ontario, Canada; Journal of Hydrology, v. 409, p. 1–19.
  89. Gronewold, A.D., Bruxer, J., Durnford, D., Smith, J.P., Clites, A.H., Seglenieks, F., Qian, S.S., Hunter, T.S. and Fortin, V. (2016): Hydrological drivers of record-setting water level rise on Earth’s largest lake system; Water Resources Research, v. 52, p. 4026–4042. doi:10.1002/2015WR018209
  90. Guay C., Minville M. and Braun M. (2015): A global portrait of hydrological changes at the 2050 horizon for the province of Quebec; Canadian Water Resources Journal, v. 40, p. 285–302.
  91. Hanrahan, J.L., Kravtsov, S.V. and Roebber, P.J. (2010): Connecting past and present climate variability to the water levels of Lakes Michigan and Huron; Geophysical Research Letters, v. 37, L01701. doi:10.1029/2009GL041707
  92. Harma, K. J., Johnson, M.S. and Cohen, S.J. (2012): Future water supply and demand in the Okanagan basin, British Columbia: A scenario-based analysis of multiple, interacting stressors; Water Resources Management, v. 26, p. 667–689.
  93. Harvey, K.D., Pilon, P.J. and Yuzyk, T.R. (1999): Canada’s Reference Hydrometric Basin Network (RHBN); in Proceedings of the Canadian Water Resources Association 51st Annual Conference, Partnerships in Water Resources Management, Nova Scotia, Canada.
  94. Hayashi, M. and Farrow, C.R. (2014): Watershed-scale response of groundwater recharge to inter-annual and inter-decadal variability in precipitation (Alberta, Canada); Hydrogeology Journal, v. 22, p. 1825–1839.
  95. Hayashi, M., Jackson, J.F. and Xu, L. (2010): Application of the versatile soil moisture budget model to estimate evaporation from prairie grassland; Canadian Water Resources Journal, v. 35, p. 187–208.
  96. Hayhoe, K., VanDorn, J., Croley, T., Schlegal, N. and Wuebbles, D. (2010): Regional climate change projections for Chicago and the US Great Lakes; Journal of Great Lakes Research, v. 36, p. 7–21.
  97. Hernández-Henríquez, M.A., Sharma, A.R. and Déry, S.J. (2017): Variability and trends in runoff in the rivers of British Columbia’s Coast and Insular Mountains; Hydrological Processes, v. 31, p. 3269–3282.
  98. Hidalgo, H.G., Das, T., Dettinger, M.D., Cayan, D.R., Pierce, D.W., Barnett, T.P., Bala, G., Mirin, A., Wood, A.W., Bonfils, C., Santer, B.D. and Nozawa, T. (2009): Detection and attribution of streamflow timing changes to climate change in the western United States; Journal of Climate, v. 22, p. 3838–3855.
  99. Hinzman, L.D., Bettez, N.D., Bolton, W.R., Chapin, F.S., Dyurgerov, M.B., Fastie, C.L., Griffith, B., Hollister, R.D., Hope, A., Huntington, H.P., Jensen, A.M., Jia, G.L., Jorgenson, T., Kane, D.L., Klein, D.R., Kofinas, G., Lynch, A.H., Lloyd, A.H., McGuire, A.D., Nelson, F.E., Thomas, W.C., Osterkamp, E., Racine, C.H., Romanovsky, V.E., Stone, R.S., Stow, D.A., Sturm, M., Tweedie, C.E., Vourlitis, G.L., Walker, M.D., Walker, D.A., Webber, P.J., Welker, J.M., Winker, K.S., Yoshikawa, K. (2005): Evidence and implications of recent climate change in northern Alaska and other Arctic regions; Climatic Change, v. 72, p. 251–298.
  100. Houghton, J. (2004): Global Warming: The Complete Briefing (3rd edition); Cambridge University Press, Cambridge, United Kingdom, 351 p.
  101. Huang, J., Halpenny, J., van der Wal, W., Klatt, C., James, T.S. and Rivera, A. (2012): Detectability of groundwater storage change within the Great Lakes Water Basin using GRACE; Journal of Geophysical Research, v. 117. doi:10.1029/2011JB008876
  102. Huang, J., Pavlic, G., Rivera, A., Palombi, D. and Smerdon, B. (2016): Mapping groundwater storage variations with GRACE: a case study in Alberta, Canada; Hydrogeology Journal, v. 24, p. 1663–1680.
  103. IJC [International Joint Commission] (2017): Extreme conditions and challenges during high water levels on Lake Ontario and the St. Lawrence River, <https://ijc.org/en/extreme-conditions-and-challenges-during-high-water-levels-lake-ontario-and-st-lawrence-river>.
  104. Islam, S.U., Déry, S.J. and Werner, A.T. (2017): Future climate change impacts on snow and water resources of the Fraser River Basin, British Columbia; Journal of Hydrometeorology, v. 18, p. 473–496.
  105. IUGLS [International Upper Great Lakes Study] (2012): Lake Superior regulation: Addressing uncertainty in upper Great Lakes water levels; Final Report to the International Joint Commission, March 2012, 215 p.
  106. Jeong, D.I. and Sushama, L. (2018): Rain-on-snow events over North America based on two Canadian regional climate models; Climate Dynamics, v. 50, p. 303–316.
  107. Jeong, D.I, Sushama, L. and Khaliq, M.N. (2014): The role of temperature in drought projections over North America; Climatic Change, v. 127, p. 289–303.
  108. Jones, N.E., Petreman, I.C. and Schmidt, B.J. (2015): High flows and freshet timing in Canada: Observed trends; Climate Change Research Report CCRR-42, Ontario Ministry of Natural Resources and Forestry, Science and Research Branch, Peterborough, Ontario, <http://www.climateontario.ca/MNR_Publications/CCRR42.pdf>.
  109. Jyrkama, M.I. and Sykes, J.F. (2007): The impact of climate change on spatially varying groundwater recharge in the Grand River watershed (Ontario); Journal of Hydrology, v. 338, p. 237–250.
  110. Kang, D.H., Gao, H., Shi, H., Islam, S. and Dery, S.J. (2016): Impacts of a rapidly declining mountain snowpack on streamflow timing in Canada’s Fraser River basin; Scientific Reports, v. 6. doi: 10.1038/srep19299
  111. Kerkhoven, E. and Gan, T.Y. (2011): Differences and sensitivities in potential hydrologic impact of climate change to regional-scale Athabasca and Fraser River basins of the leeward and windward sides of the Canadian Rocky Mountains respectively; Climatic Change, v. 106, p. 583–607.
  112. Khaliq, M.N., Ouarda, T.B.M.J., Gachon, P. and Sushama, L. (2008): Temporal evolution of low-flow regimes in Canadian rivers; Water Resources Research, v. 44. doi:10.1029/2007WR006132
  113. Kienzle, S.W., Nemeth, M.W., Byrne, J.M. and MacDonald, R.J. (2012): Simulating the hydrological impacts of climate change in the upper North Saskatchewan River basin, Alberta, Canada; Journal of Hydrology, v. 412–413, p. 76–89.
  114. Klaassen, J. (2002): A climatological assessment of major 20th century drought in southern Ontario, Canada; Proceedings of the 13th Conference on Applied Climatology, 13–16 May 2002; American Meteorological Society, Portland, Oregon.
  115. Kurylyk, B.L. and MacQuarrie, K.T.B. (2013): The uncertainty associated with estimating future groundwater recharge: A summary of recent research and an example from a small unconfined aquifer in a northern humid-continental climate; Journal of Hydrology, v. 492, p. 244–253.
  116. Kurylyk, B.L., MacQuarrie, K.T.B. and Voss, C.I. (2014): Climate change impacts on the temperature and magnitude of groundwater discharge from shallow, unconfined aquifers; Water Resources Research, v. 50, p. 3253–3274.
  117. Lantz, T.C. and Turner, K.W. (2015): Changes in lake area in response to thermokarst processes and climate in Old Crow Flats, Yukon; Journal of Geophysical Research: Biogeosciences, v. 120, p. 513–524.
  118. Lapp, S., Sauchyn, D.J. and Toth, B. (2009): Constructing scenarios of future climate and water supply for the SSRB: Use and limitations for vulnerability assessment; Prairie Forum, v. 34, p. 153–180.
  119. Lemieux, J.M., Hassaoui, J., Molson, J., Therrien, R., Therrien, P., Chouteau, M. and Ouellet, M. (2015): Simulating the impact of climate change on the groundwater resources of the Magdalen Islands, Québec, Canada; Journal of Hydrology: Regional Studies, v. 3, p. 400–423.
  120. Lesack, L.F.W. and Marsh, P., (2010): River-to-lake connectivities, water renewal, and aquatic habitat diversity in the Mackenzie River Delta; Water Resources Research, v. 46. doi:10.1029/2010WR009607
  121. Levison, J., Larocque, M., Fournier, V., Gagné, S., Pellerin, S. and Ouellet, M.A. (2014a): Dynamics of a headwater system and peatland under current conditions and with climate change; Hydrological Processes, v. 28, p. 4808–4822.
  122. Levison, J., Larocque, M. and Ouellet, M.A. (2014b): Modeling low-flow bedrock springs providing ecological habitats with climate change scenarios; Journal of Hydrology, v. 515, p. 16–28.
  123. Levison, J., Larocque, M., Ouellet, M.A., Ferland, O. and Poirier, C. (2016): Long-term trends in groundwater recharge and discharge in a fractured bedrock aquifer – past and future conditions; Canadian Water Resources Journal, v. 41, p. 500–514.
  124. Liu, A.Q., Mooney, C., Szeto, K., Thériault, J.M., Kochtubajda, B., Stewart, R.E., Boodoo, S., Goodson, R., Li, Y. and Pomeroy, J. (2016): The June 2013 Alberta Catastrophic Flooding Event: Part 1—Climatological aspects and hydrometeorological features; Hydrological Processes, v. 30, p. 4899–4916.
  125. Loukas, A., Vasiliades, L. and Dalezios, N.R (2000): Flood producing mechanisms identification in southern British Columbia, Canada; Journal of Hydrology, v. 227, p. 218–235.
  126. Loukas, A., Vasiliades, L. and Dalezios, N.R. (2002): Climatic impacts on the runoff generation processes in British Columbia, Canada; Hydrology and Earth System Sciences, v. 6, p. 211–227.
  127. MacDonald, D.D., Levy, D.A., Czarnecki, A., Low, G. and Richea, N. (2004): State of the Aquatic Knowledge of Great Bear Watershed; Prepared for: Water Resources Division Indian and Northern Affairs Canada, Yellowknife, Northern Territory <http://www.dfo-mpo.gc.ca/Library/278592.pdf>.
  128. MacKay, M. and Seglenieks, F. (2013): On the simulation of Laurentian Great Lakes water levels under projections of global climate change; Climatic Change, v. 117, p.55–67.
  129. Mareuil, A., Leconte, R., Rissette, F. and Minville, M. (2007): Impacts of climate change on the frequency and severity of floods in the Châteauguay River basin, Canada; Canadian Journal of Civil Engineering, v. 34, p. 1048–1060.
  130. Marsh P. and Lesack L. (1996): The hydrologic regime of perched lakes in the Mackenzie Delta: Potential responses to climate change; Limnology and Oceanography, v. 41, p. 849–856.
  131. Marsh, P., Russell, M., Pohl, S., Haywood, H. and Onclin, C. (2009): Changes in thaw lake drainage in the Western Canadian Arctic from 1950 to 2000; Hydrological Processes, v. 23, p. 145–158.
  132. Masud, M.B., Khaliq, M.N. and Wheater, H.S. (2017): Future changes to drought characteristics over the Canadian Prairie Provinces based on NARCCAP multi-RCM ensemble; Climate Dynamics, v. 48, p. 2685–2705.
  133. McCabe, G.J. and Wolock, D.M. (2015): Variability and trends in global drought; Earth and Space Science, v. 2, p. 223–228.
  134. McKee, T.B., Doeskin, N.J. and Kleist, J. (1993): The relationship of drought frequency and duration to time scales; Proceedings of the 8th Conference on Applied Climatology, 17–22 January 1993, American Meteorological Society, Boston, Massachusetts, p. 179–184.
  135. Mearns, L.O., Gutowski, W.J., Jones, R., Leung, L.Y., McGinnis, S., Nunes, A.M.B. and Qian, Y. (2009): A regional climate change assessment program for North America; EOS, v. 90, p. 311–312.
  136. Melillo, J.M., Richmond, T.C. and Yohe, G.W. (ed.) (2014): Highlights of Climate Change Impacts in the United States: The Third National Climate Assessment; U.S. Global Change Research Program, 148 p.
  137. Milly, P.C.D. and Dunne, K.A. (2011): Hydrologic adjustment of climate-model projections: The potential pitfall of potential evapotranspiration; Earth Interactions, v. 15, p. 1–14.
  138. Milly, P.C.D. and Dunne, K.A. (2016): Potential evapotranspiration and continental drying; Nature Climate Change Letters, v. 6, p. 946–949.
  139. Minville, M., Brissette, F. and Leconte, R. (2008): Uncertainty of the impact of climate change on the hydrology of a Nordic watershed; Journal of Hydrology, v. 358, p. 70–83.
  140. Minville, M., Krau, S., Brissette, F. and Leconte, R. (2010): Behaviour and performance of a water resource system in Québec (Canada) under adapted operating policies in a climate change context; Water Resources Management, v. 24, p. 1333–1352.
  141. Monk, W.A. and Baird, D.J. (2011): Ecosystem status and trends report: biodiversity in Canadian lakes and rivers; Canadian Biodiversity: Ecosystem Status and Trends 2010; Technical Thematic Report No. 20, Canadian Councils of Resource Ministers, Ottawa, Ontario, 79 p.
  142. Monk, W.A., Peters, D.L, Curry, R.A. and Baird, D.J. (2011): Quantifying trends in indicator hydroecological variables for regime-based groups of Canadian rivers; Hydrological Processes, v. 25, p. 3086–3100.
  143. Moore, R.D., Sidle, R.C., Eaton, B., Takahashi, G. and Wilford, D. (2017): Water and watersheds; Chapter 7 in Innes, (ed.) J.L. and Tikina, A.V.; Sustainable Forest Management: From Concept to Practice, Routledge, Taylor and Francis Group, New York, NY, USA 396 p.
  144. Mortsch, L., Cohen, S. and Koshida, G. (2015): Climate and water availability indicators in Canada: Challenges and a way forward. Part II – Historic trends; Canadian Water Resources Journal, v. 40, p. 146–159.
  145. Motiee, H. and McBean, E. (2017): Assessment of climate change impacts on groundwater recharge for different soil types-Guelph region in Grand River basin, Canada; ECOPERSIA, v. 5, p. 1731–1744.
  146. Music B., Frigon A., Longfren B.,Turcotte R. and Cyr J.F. (2015): Present and future Laurentian Great Lakes hydroclimatic conditions as simulated by regional climate models with an emphasis on Lake Michigan-Huron; Climate Change, v. 130, p. 603–618.
  147. Najafi, M.R., Zwiers, F. and Gillett, N. (2017a): Attribution of the observed spring snowpack decline in British Columbia to anthropogenic climate change; Journal of Climate, v. 30, p. 4113–4130.
  148. Najafi, M.R., Zwiers, F. and Gillett, N. (2017b): Attribution of observed streamflow changes in key British Columbia drainage basins; Geophysical Research Letters, v. 44, p. 11012–11020.
  149. Nalley, D., Adamowski, J. and Khalil, B. (2012): Using discrete wavelet transforms to analyze trends in streamflow and precipitation in Quebec and Ontario (1954–2008); Journal of Hydrology, v. 475, p. 204–228.
  150. National Wetlands Working Group (1988): Wetlands of Canada; Ecological Land Classification Series No. 24; Sustainable Development Branch, Environment Canada, Ottawa, ON, and Polyscience Publications Inc., Montréal, Quebec, 452 p.
  151. National Wetlands Working Group (1997): The Canadian wetland classification system (2nd edition), (Ed.) B.G. Warner and C.D.A. Rubec; The Wetlands Research Centre, University of Waterloo, Waterloo, Ontario, 68 p.
  152. Nikolik, V.V. and Simonovic, S.P. (2015): Multi-method modeling framework for support of integrated water resources management; Environmental Processes, v. 2, p. 461–483.
  153. Oni, S.K., Futter, M.N., Molot, L.A., Dillon, P.J. and Crossman, J. (2014): Uncertainty assessments and hydrological implications of climate change in two adjacent agricultural catchments of a rapidly urbanizing watershed; Science of the Total Environment, v. 473–474, p. 326–337.
  154. Pacheco, A., McNairn, H., Mahmoodi, A., Champagne, C. and Kerr, Y.H. (2015): The impact of national land cover and soils data on SMOS soil moisture retrieval over Canadian agricultural landscapes; IEEE Journal of Selected Topics in Applied Earth Observations and Remote Sensing, v. 8, p. 5281–5293.
  155. PaiMazumder, D., Sushama, L., Laprise, R., Khaliq, M.N. and Suachyn, D. (2012): Canadian RCM projected changes to short and long-term drought characteristics over the Canadian Prairies; International Journal of Climatology, v. 33, p. 1409–1423.
  156. Palmer, W.C. (1965): Meteorological Drought; Research Paper No. 45, Weather Bureau, Washington, District of Columbia, 58 pp.
  157. Peters, D.L. (2013): Multi-Scale Hydroclimatic Controls on the Duration of Ponded Water in Wetland-Lake Environments of a Cold Regions Delta. WSTD Contribution No. 11‐083; National Hydrology Research Centre, Saskatoon, Saskatchewan, 43 p.
  158. Peters, D.L. and Buttle, J.M. (2010): The effects of flow regulation and climatic variability on obstructed drainage and reverse flow contribution in a Northern river–lake–delta complex, Mackenzie basin headwaters; River Research and Application, v. 26, p. 1065–1089.
  159. Peters, D.L., Atkinson, D., Monk, W.A., Tenenbaum, D.E. and Baird, D.J. (2013): A multi-scale hydroclimatic analysis of runoff generation in the Athabasca, River, western Canada; Hydrological Processes, v. 27, p. 1915–1934.
  160. Peters D.L., Cassie, D., Monk, W.A., Rood, S. and St-Hilaire, A. (2016): Ecological Aspects of Floods in Canada: Special Issue on Floods in Canada; Canadian Water Resources Journal, v. 41, p. 288–306.
  161. Peters, D.L., Prowse, T.D., Pietroniro, A. and Leconte, R. (2006): Flood hydrology of the Peace-Athabasca Delta, northern Canada; Hydrological Processes, v. 20, p. 4073–4096.
  162. Plug, L.J., Walls, C. and Scott, B.M. (2008): Tundra lake changes from 1978 to 2001 on the Tuktoyaktuk Peninsula, western Canadian Arctic; Geophysical Research Letters, v. 35. doi:10.1029/2007GL032303
  163. Poitras, V., Sushama, L., Seglenieks, F., Khaliq, M.N. and Soulis, E. (2011): Projected changes to streamflow characteristics over western Canada as simulated by the Canadian RCM; Journal of Hydrometeorology, v. 12, p. 1395–1413.
  164. Prowse, T.D., Bonsal, B.R., Lacroix, M.P. and Beltaos, S. (2002): Trends in river-ice breakup and related temperature controls; in Ice in the Environment, (ed.) V.A. Squire and P. Lannghome; Proceedings of the 16th IAHR Conference on Sea Ice Processes, International Association of Hydraulic Engineering and Research, Dunedin, New Zealand, p. 64–71.
  165. Quilbe, R., Rousseau, A.N., Moquet, J.S., Trinh, N.B., Dibike, Y., Gachon, P. and Chaumont, D. (2008): Assessing the effect of climate change on river flow using general circulation models and hydrological modelling: Application to the Chaudière River, Quebec, Canada; Canadian Water Resources Journal, v. 33, p. 73–94.
  166. Radic, V., Cannon, A.J., Menounos, B. and Gi, N. (2015): Future changes in autumn atmospheric river events in British Columbia, Canada, as projected by CMIP5 global climate models; Journal of Geophysical Research: Atmospheres, v. 120, p. 9279–9302.
  167. Rasmussen, P.F. (2015): Assessing the impact of climate change on the frequency of floods in the Red River basin; Canadian Water Resources Journal, v. 41, p. 331–342.
  168. Reichle, R.H., Draper, C.S., Liu, Q., Girotto, M., Mahanama, S.P.P., Koster, R.D. and De Lannoy, G.J.M. (2017): Assessment of MERRA-2 land surface hydrology estimates; Journal of Climate, v. 30, p. 2937–2960.
  169. Rivard, C., Paniconi, C., Vigneault, H. and Chaumont, D. (2014): A watershed-scale study of climate change impacts on groundwater recharge (Annapolis Valley, Nova Scotia, Canada); Hydrological Sciences Journal, v. 59, p. 1437–1456.
  170. Rivard, C., Vigneault, H., Piggott, A.R., Larocque, M. and Anctil, F. (2009): Groundwater recharge trends in Canada; Canadian Journal of Earth Sciences, v. 46, p. 841–854.
  171. Rivera, A. (2014): Groundwater Basics; Chapter 2 in Canada’s Groundwater Resources (ed.) A. Rivera; Fitzhenry & Whiteside Limited, Markham, Ontario, p. 22–61.
  172. Rivera, A., Allen, D.M. and Maathuis, M. (2004). Climate Variability and Change: Groundwater Resources; Chapter 10 in Threats to Water Availability in Canada, NWRI Scientific Assessment Report Series No. 3 and ACSD Science Assessment Series No. 1.; National Water Research Institute, Burlington, Ontario, p. 77–83.
  173. Roberts, J., Pryse-Phillips, A. and Snelgrove, K. (2012): Modeling the potential impacts of climate change on a small watershed in Labrador, Canada; Canadian Water Resources Journal, v. 37, p. 231–251.
  174. Rood, S.B., Kaluthota, S., Philipsen, L.J., Rood, N.J. and Zanewich, K.P. (2017): Increasing discharge from the Mackenzie River system to the Arctic Ocean; Hydrological Processes, v. 31, p. 150–160.
  175. Rood, S.B., Pan, J., Gill, K.M., Franks, C.G., Samuelson, G.M. and Shepherd, A. (2008): Declining summer flows of Rocky Mountain rivers: Changing seasonal hydrology and probable impacts on floodplain forests; Journal of Hydrology, v. 349, p. 397–410.
  176. Rood, S.B., Samuelson, G.M., Weber, J.K. and Wywrot, K.A. (2005): Twentieth-century decline in streamflows from the hydrographic apex of North America; Journal of Hydrology, v. 306, p. 215–233.
  177. Sandink, D. (2016): Urban flooding and ground-related homes in Canada: an overview; Journal of Flood Risk Management, v. 9, p. 208–223.
  178. Schaefer, G.L., Cosh, M.H. and Jackson, T.J. (2007): The USDA natural resources conservation service soil climate analysis network (SCAN); Journal of Atmospheric and Oceanic Technology, v. 24, p. 2073–2077.
  179. Schertzer, W.M., Rouse, W.R., Lam, D.C.L., Bonin, D. and Mortsch, L.D. (2004): Chapter 12. Climate Variability and Change: Lakes and Reservoirs; Chapter 12 in Threats to Water Availability in Canada, NWRI Scientific Assessment Report Series No. 3 and ACSD Science Assessment Series No. 1.; National Water Research Institute, Burlington, Ontario, p. 91–99.
  180. Schindler, D.W. and Donahue, W.F. (2006): Inaugural article: An impending water crisis in Canada’s western prairie provinces; Proceedings of the National Academy of Sciences, v. 103, p. 7210–7216.
  181. Schnorbus, M.A., Bennett, K.E., Werner, A.T. and Berland, A.J. (2011): Hydrologic impacts of climate change in the Peace, Campbell and Columbia Watersheds, British Columbia, Canada; Hydrologic Modelling Project Final Report (Part II), Victoria British Columbia; University of Victoria, Pacific Climate Impacts Consortium, <https://pacificclimate.org/sites/default/files/publications/Schnorbus.HydroModelling.FinalReport2.Apr2011.pdf>.
  182. Schnorbus, M., Werner, A. and Bennett, K. (2014): Impacts of climate change in three hydrologic regimes in British Columbia, Canada; Hydrological Processes, v. 28, p. 1170–1189.
  183. Scibek, J. and Allen, D.M. (2006): Modeled impacts of predicted climate change on recharge and groundwater levels; Water Resources Research, v. 41. doi: 10.1029/2005WR004742
  184. Seiler, C., Zwiers, F.W., Hodges, K.I. and Scinocca, A.F. (2018): How does dynamical downscaling affect model biases and future projections of explosive extratropical cyclones along North America’s Atlantic coast?; Climate Dynamics, v. 50, p. 677–692.
  185. Seneviratne, S.I., Corti, T., Davin, E.L., Hirschi, M., Jaeger, E.B., Lehner, I., Orlowsky, B. and Teuling, A.J. (2010): Investigating soil moisture-climate interactions in a changing climate: a review; Earth-Science Reviews, v. 99, p. 125–161.
  186. Seneviratne, S.I., Nicholls, N., Easterling, D., Goodess, C.M., Kanae, S., Kossin, J., Luo, Y., Marengo, J., McInnes, K., Rahimi, M., Reichstein, M., Sorteberg, A., Vera, C. and Zhang, X. (2012): Changes in climate extremes and their impacts on the natural physical environment; in Managing the Risks of Extreme Events and Disasters to Advance Climate Change Adaptation, (ed.) C.B. Field, V. Barros, T.F. Stocker, D. Qin, D.J. Dokken, K.L. Ebi, M.D. Mastrandrea, K.J. Mach, G.K. Plattner, S.K. Allen, M. Tignor and P.M. Midgley; A Special Report of Working Groups I and II of the Intergovernmental Panel on Climate Change; Cambridge University Press, Cambridge, United Kingdom and New York, NY, USA, p. 109–230.
  187. Shaw, S.B. and Riha, S.J. (2011): Assessing temperature-based PET equations under a changing climate in temperate, deciduous forests; Hydrological Processes, v. 25, p. 1466–1478.
  188. Sheffield, J., Wood, E.F. and Roderick, M.L. (2012): Little change in global drought over the past 60 years; Nature, v. 491, p. 435–438.
  189. Shepherd, A., Gill, K.M. and Rood, S.B. (2010): Climate change and future flows of Rocky Mountain rivers: Converging forecasts from empirical trend projection and down-scaled global circulation modelling; Hydrological Processes, v. 24, p. 3864–3877.
  190. Shook, K. and Pomeroy, J. (2012): Changes in the hydrological character of rainfall on the Canadian Prairies; Hydrological Processes, v. 26, p. 1752–1766.
  191. Shrestha, R.R., Berland, A.J., Schnorbus, M.A. and Prowse, T.D. (2012b): Modelling of climate-induced hydrologic changes in the Lake Winnipeg watershed; Journal of Great Lakes Research, v. 38, p. 83–94.
  192. Shrestha, R.R., Schnorbus, M.A., Werner, A.T. and Berland, A.J. (2012a): Modelling spatial and temporal variability of hydrologic impacts of climate change in the Fraser River basin, British Columbia. Canada; Hydrological Processes, v. 26, p. 1840–1860.
  193. Smerdon, B.D. (2017): Synopsis of climate change effects on groundwater recharge; Journal of Hydrology, v. 555, p. 125–128.
  194. Smith, L.C., Sheng, Y., MacDonald, G.M. and Hinzman, L.D. (2005): Disappearing Arctic lakes; Science, v. 308, p. 1429.
  195. Southarm, C.F., Mills, B.N., Moulton, R.J. and Brown, D.W. (1999): The potential impact of climate change in Ontario’s Grand River basin: Water supply and demand issues; Canadian Water Resources Journal, v. 24, p. 307–328.
  196. St. George, S. (2007): Streamflow in the Winnipeg River basin, Canada: Trends, extremes and climate linkages; Journal of Hydrology, v. 332, p. 396–411.
  197. St. Jacques, J.M. and Sauchyn, D.J. (2009): Increasing winter baseflow and mean annual streamflow from possible permafrost thawing in the Northwest Territories, Canada; Geophysical Research Letters, v. 36. doi:10.1029/2008GL035822
  198. St. Jacques, J.M., Andreichuk, Y., Sauchyn, D.J. and Barrow, E. (2017): Projecting Canadian Prairie Runoff for 2041–2070 with North American Regional Climate Change Assessment Program (NARCCAP) Data; Journal of the American Water Resources Association. doi:10.1111/ 1752-1688.12642
  199. St. Jacques, J.M., Lapp, S.L., Zhao, Y., Barrow, E.M. and Sauchyn, D.J. (2013): Twenty-first century central Rocky Mountain river discharge scenarios under greenhouse forcing; Quaternary International, v. 310, p. 34–46.
  200. St. Jacques, J.M., Sauchyn, D.J. and Zhao, Y. (2010): Northern Rocky Mountain streamflow records: Global warming trends, human impacts or natural variability? Geophysical Research Letters, v. 37.
  201. Stantec (2012): Assiniboine River Basin Hydrologic Model – Climate Change Assessment; prepared for Manitoba Conservation, Climate Change Branch, 102 p., <http://www.parc.ca/rac/fileManagement/upload/2FINAL_AssiniboineRBasin_Hydrologic_Model_20120323.pdf>.
  202. Sulis, M., Paniconi, C., Marrocu, M., Huard, D. and Chaumont, D. (2012): Hydrologic response to multimodel climate output using a physically based model of groundwater/surface water interactions; Water Resources Research, v. 48.
  203. Sulis, M., Paniconi, C., Rivard, C., Harvey, R. and Chaumont, D. (2011): Assessment of climate change impacts at the catchment scale with a detailed hydrological model of surface-subsurface interactions and comparison with a land surface model; Water Resources Research, v. 47.
  204. Sultana, Z. and Coulibaly, P. (2011): Distributed modelling of future changes in hydrological processes of Spencer Creek watershed; Hydrological Processes, v. 25, p. 1254–1270.
  205. Swain, S. and Hayhoe, K. (2015): CMIP5 projected changes in spring and summer drought and wet conditions over North America; Climate Dynamics, v. 44, p. 2737–2750.
  206. Szeto, K., Brimelow, J., Gysbers, P. and Stewart, R. (2015): The 2014 extreme flood on the southeastern Canadian Prairies; in Explaining Extremes of 2014 from a Climatic Perspective, Bulletin of the American Meteorological Society, v. 96, S20–S24.
  207. Szeto, K., Zhang, X., White, R.E. and Brimelow, J. (2016): The 2015 extreme drought in western Canada; in Explaining Extremes of 2015 from a Climatic Perspective; Bulletin of the American Meteorological Society, v. 97, S42–S46.
  208. Tanzeeba, S. and Gan, T.Y. (2012): Potential impact of climate change on the water availability of South Saskatchewan River Basin; Climatic Change, v. 112, p. 355–386.
  209. Teufel, B., Diro, G.T., Whan, K., Milrad, S.M., Jeong, D.I., Ganji, A., Huziy, O., Winger, K., Gyakum, J.R., de Elia, R., Zwiers, F.W. and Sushama, L. (2017): Investigation of the 2013 Alberta flood from weather and climate perspectives; Climate Dynamics, v. 48, p. 2881–2899.
  210. Thorne, R. (2011): Uncertainty in the impacts of projected climate change on the hydrology of a subarctic environment: Liard River Basin; Hydrology Earth System Sciences, v. 15, p. 1483–1492.
  211. Touma, D., Ashfaq, M., Nayak, M.A., Kao, S.C. and Diffenbaugh, N.S. (2015): A multi-model and multi-index evaluation of drought characteristics in the 21st century; Journal of Hydrology, v. 526, p. 196–207.
  212. Trenberth, K.E., (2011): Changes in precipitation with climate change; Climate Research, v. 47, p. 123–138.
  213. Trenberth, K.E., Dai, A., van der Schrier, G., Jones, P.D., Barichivich, J., Briffa, K.R. and Sheffield, J. (2014): Global warming and changes in drought; Nature Climate Change, v. 4, p. 17–22.
  214. UK Met Office [United Kingdom Meteorological Office] (2018): Water cycle for kids, <http://www.metoffice.gov.uk/learning/weather-for-kids/water-cycle>.
  215. US Fish and Wildlife Service (2017): Waterfowl population status, 2017; U.S. Department of the Interior, Washington, District of Columbia, United States, <https://www.fws.gov/migratorybirds/pdf/surveys-and-data/Population-status/Waterfowl/WaterfowlPopulationStatusReport17.pdf>.
  216. van der Kamp, G. and Marsh, P. (2004). Climate Variability and Change: Wetlands; Chapter 13 in Threats to Water Availability in Canada, NWRI Scientific Assessment Report Series No. 3 and ACSD Science Assessment Series No. 1.; National Water Research Institute, Burlington, Ontario, p. 101–106.
  217. van der Kamp, G., Keir, D. and Evans, M.S. (2008): Long-term water-level changes in closed-basin lakes of the Canadian prairies; Canadian Water Resources Journal, v. 33, p. 23–38.
  218. van Huissteden, J., Berrittella, C., Parmentier, F.J.W., Mi, Y., Maximov, T.C. and Dolman, A.J. (2011): Methane emissions from permafrost thaw lakes limited by lake drainage; Nature Climate Change, v. 1, p. 119–123.
  219. Vetter, T., Reinhart, J., Florke, M., van Griensven, A., Hattermann, F., Huang, S., Koch, H., Pechlivanidis, I.G., Plotner, S. Seidou, O., Su, B., Vervoort, R.W. and Krysanova, V. (2017): Evaluation of sources of uncertainty in projected hydrological change under climate change in 12 large-scale river basins; Climatic Change, v. 141, p. 419–433.
  220. Vicente-Serrano, S.M., Begueria, S. and Lopez-Moreno, J.I. (2010): A multiscalar drought index sensitive to global warming: The Standardized Precipitation Evapotranspiration Index; Journal of Climate, v. 23, p. 1696–1718.
  221. Vincent, L.A., Zhang, X., Brown, R.D., Feng, Y., Mekis, E., Milewska, E.J., Wan, H. and Wang, X.L. (2015): Observed trends in Canada’s climate and influence of low frequency variability modes; Journal of Climate, v. 28, p. 4545–4560.
  222. Vincent, W.F., Laurion, I., Pienitz, R. and Walter-Anthony, K.M. (2012): Climate impacts on Arctic lake ecosystems; in Climatic Change and Global Warming of Inland Waters: Impacts and Mitigation for Ecosystems and Societies; (ed.) C.R. Goldman, M. Kumagai, and R.D. Robarts; John Wiley & Sons, 496 p.
  223. von de Wall, S., de Rham L.P. and Prowse, T.D. (2009): Open water and ice-induced extreme water levels on Canadian rivers; in Proceedings of the 17th International Northern Research Basins Symposium and Workshop, 12–18 August 2009; (ed.) K.L. Young and W. Quinton; Iqaluit-Pangnirtung-Kuujjaq, Nunavut, p. 337–347.
  224. von de Wall, S., de Rham, L.P. and Prowse, T.D. (2010): The river ice breakup season in Canada: Variations in water levels and timing; in Proceedings of the 67th Eastern Snow Conference, 8–10 June, 2010, Hancock, Massachusetts, p. 5–15.
  225. Wang, G. (2005): Agricultural drought in a future climate: Results from 15 Global Climate Models participating in the IPCC 4th assessment; Climate Dynamics, v. 25, p. 739–753.
  226. Wang, Y., Hogg, E.H., Price, D.T., Edwards, J. and Williamson, T. (2014): Past and projected future changes in moisture conditions in the Canadian boreal forest; The Forestry Chronicle, v. 90, p. 678–691.
  227. Watmough, M.D. and Schmoll, M.J. (2007): Environment Canada’s Prairie and Northern Region habitat monitoring program phase II: recent habitat trends in the Prairie Habitat Joint Venture; Technical Report Series No. 493; Environment Canada, Canadian Wildlife Service, Edmonton, Alberta, 135 p.
  228. Wehner, M.F., Arnold, J.R., Knutson, T. Kunkel, K.E. and LeGrande, A.N. (2017): Droughts, floods, and wildfires; in Climate Science Special Report: Fourth National Climate Assessment, v. 1, (ed.) D.J. Wuebbles, D.W. Fahey, K.A. Hibbard, D.J. Dokken, B.C. Stewart and T.K. Maycock, U.S. Global Change Research Program, Washington, District of Columbia, United States, p. 231–256.
  229. Wen, L., Lin, C.A., Wu, Z., Lu, G., Pomeroy, J. and Zhu, Y. (2011): Reconstructing sixty year (1950–2009) daily soil moisture over the Canadian Prairies using the Variable Infiltration Capacity model; Canadian Water Resources Journal, v. 36, p. 83–102.
  230. Whitfield, P.H. (2012): Floods in future climates: a review; Journal of Flood Risk Management, v. 5, p. 336–365.
  231. Whitfield, P.H. and Cannon, A.J. (2000): Recent variations in climate and hydrology in Canada; Canadian Water Resources Journal, v. 25, p. 19–65.
  232. Whitfield, P.H., Burn, D.H., Hannaford, J., Higgins, H., Hodgkins, G.A., Marsh, T. and Looser, U. (2012): Reference hydrologic networks: The status and potential future directions of national reference hydrologic networks for detecting trends; Hydrological Sciences Journal, v. 57, p. 1562–1579.
  233. Whitfield, P.H., Moore, R.D., Fleming, S.W. and Zawadzki, A. (2010): Pacific Decadal Oscillation and the hydroclimatology of western Canada — Review and prospects; Canadian Water Resources Journal, v. 35, p. 1–28.
  234. Wilcox, D.A., Thompson, T.A., Booth, R.K. and Nicholas, J.R. (2007): Lake-level variability and water availability in the Great Lakes; Circular 1311, US Geological Survey, National Water Availability and Use Program, Virginia, United States.
  235. Wolfe, B.B., Humphries, M.M., Pisaric, M.F.J., Balasubramaniam, A.M., Burn, C.R., Chan, L., Cooley, D., Froese, D.G., Graupe, S., Hall, R.I., Lantz, T., Porter, T.J., Roy-Leveillee, P., Turner, K.W., Wesche, S.D. and Williams, M. (2011): Environmental change and traditional use of the Old Crow Flats in Northern Canada: An IPY opportunity to meet the challenges of the New Northern Research Paradigm; Arctic, v. 64, p. 127–135.
  236. Woo, M.K and Thorne, R. (2003): Streamflow in the Mackenzie Basin, Canada; Arctic, v. 56, p. 328–340.
  237. World Meteorological Organization (WMO) and Global Water Partnership (GWP) (2016): Handbook of Drought Indicators and Indices; (ed.) M. Svoboda and B.A. Fuchs; Integrated Drought Management Programme (IDMP), Integrated Drought Management Tools and Guidelines Series 2, Geneva, Switzerland.
  238. Yip, Q.K.Y., Burn, D.H., Seglenieks, F., Pietroniro, A. and Soulis, E.D. (2012): Climate impacts on hydrological variables in the Mackenzie River Basin; Canadian Water Resources Journal, v. 37, p.209–230.
  239. Zhang, X., Harvey, K.D., Hogg, W.D. and Yuzyk, T.R. (2001): Trends in Canadian streamflow; Water Resources Research, v. 37, p. 987–998.
  240. Zhao, T. and Dai, A. (2015): The magnitude and causes of global drought changes in the twenty-first century under a low-moderate emissions scenario; Journal of Climate, v. 28, p. 4490–4512.
  241. Zhao, T. and Dai, A. (2016): Uncertainties in historical changes and future projections of drought: Part II: Model simulated historical and future drought changes; Climatic Change, v. 144, p. 535–548. doi:10.1007/s10584-016-1742-x
Next

Changes in Oceans Surrounding Canada