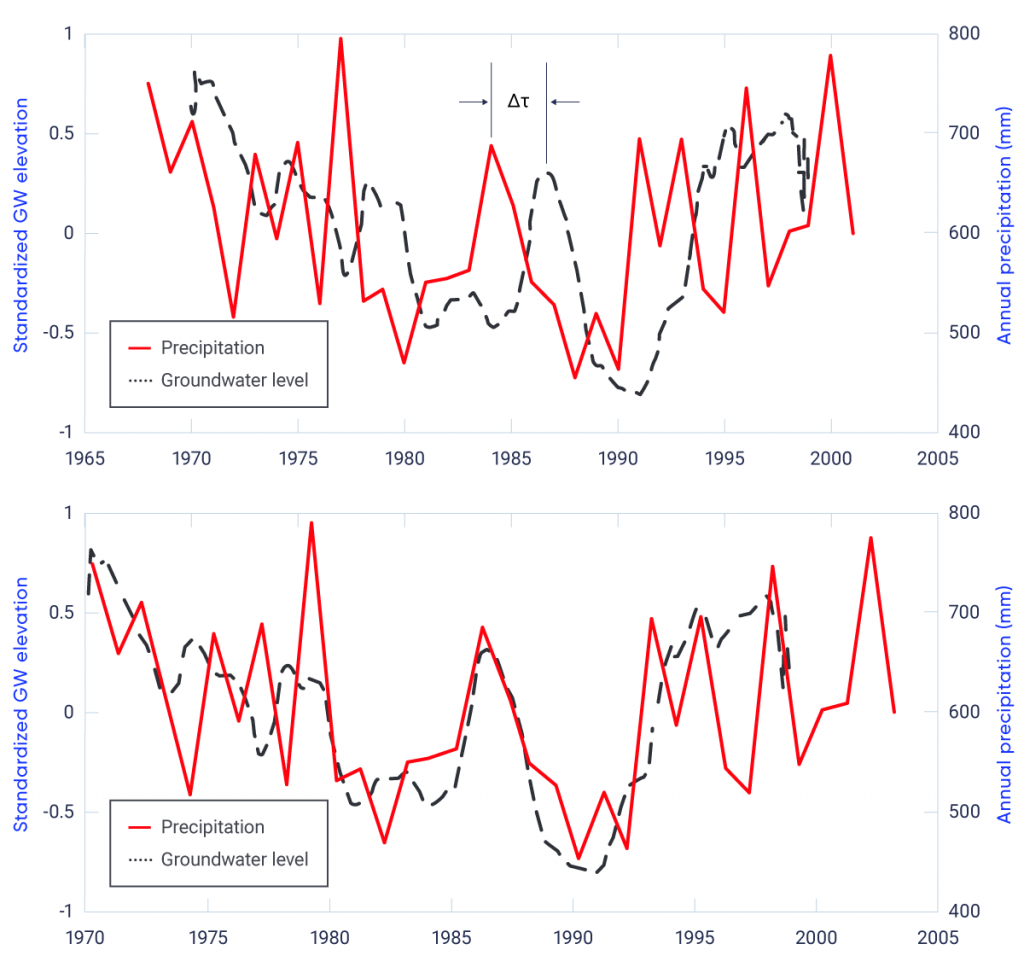
Annual precipitation and average standardized groundwater levels in 24 monitoring wells in the Winnipeg, Manitoba, area. The upper graph shows actual values, while the lower graph provides values with precipitation shifted later by 2.2 years (as denoted by the Δτ in the upper graph).
Source
Allen et al. (2014).