Chapter 8

Changes in Canada's Regions in a National and Global Context

This chapter synthesizes past and future changes for six regions of Canada, drawing from the other chapters of this report, and sets them within a global and national context.

Recommended citation

Cohen, S., Bush, E., Zhang, X., Gillett, N., Bonsal, B., Derksen, C., Flato, G., Greenan, B., Watson, E. (2019): Changes in Canada’s Regions in a National and Global Context, Chapter 8 in Canada’s Changing Climate Report, (ed.) E. Bush and D.S. Lemmen; Government of Canada, Ottawa, Ontario, p. 424-443.

Authors

Recommended citation: Cohen, S., Bush, E., Zhang, X., Gillett, N., Bonsal, B., Derksen, C., Flato, G., Greenan, B., Watson, E (2018): Changes in Canada’s Regions in a National and Global Context; Chapter 8 in Canada’s Changing Climate Report, (ed.) E. Bush and D.S. Lemmen; Government of Canada, Ottawa, Ontario, p. 424-443.

  • Stewart Cohen (Environment and Climate Change Canada)
  • Elizabeth Bush (Environment and Climate Change Canada)
  • Xuebin Zhang (Environment and Climate Change Canada)
  • Nathan Gillett (Environment and Climate Change Canada)
  • Barrie R. Bonsal (Environment and Climate Change Canada)
  • Chris Derksen (Environment and Climate Change Canada)
  • Greg Flato (Environment and Climate Change Canada)
  • Blair J. W. Greenan (Fisheries and Oceans Canada)
  • Emma Watson (Environment and Climate Change Canada)
Figure-8.1
View details
8.1

Introduction

Changes in climate have consequences for Canadians, their health, well-being, and livelihoods, as well as for natural ecosystems of Canada. Canada’s Changing Climate Report is the first report of the most recent national assessment process, Canada in a Changing Climate. This report assesses how Canada’s climate has changed, why, and what changes are projected for the future. It provides a physical science foundation for the other national assessment reports to be released in the coming years, which will assess recent knowledge on climate change impacts and progress in adaptation across regions and sectors in Canada (see Chapter 1, Section 1.1).

Given the large geographic expanse of Canada, historical changes in climate have varied across the country, and projected future changes will vary as well. Chapters 4, 5, 6, and 7 of this report provide assessments of changes in several aspects of physical climate for the country as a whole, including variations across the country. This chapter synthesizes information on historical climate trends and projected future climate changes for regions of Canada using information from these chapters. References to underlying sections in previous chapters are provided to link directly to the supporting evidence, along with detailed discussions of associated uncertainties, for the results presented here. This chapter begins, however, with an overview of global-scale climate change, which is the essential context for understanding changes in Canada.

8.2

Global context

There is overwhelming evidence that the Earth has warmed during the Industrial Era and that the main cause of this warming is human influence (see Chapter 2, Sections 2.2, 2.3, and 2.4). This evidence includes increases in near-surface and lower-atmosphere air temperature, sea surface temperature, and ocean heat content. Widespread warming is consistent with the observed increase in atmospheric water vapour and with declines in snow and ice. Global sea level has risen from the expansion of ocean waters caused by warming and from added water previously stored in land-based ice in glaciers and ice sheets. The observed warming and other climate changes cannot be explained by natural factors, either internal variations within the climate system or natural external factors such as changes in solar irradiance or volcanic eruptions. Only when human influences on climate are accounted for — changes in greenhouse gases, aerosols, and the land surface — can these observed changes in climate be explained. Of these human factors, the build-up of atmospheric greenhouse gases has been dominant, and carbon dioxide has been the dominant greenhouse gas emitted by human activity. Attribution studies provide quantitative assessments of the contribution of various climate drivers to observed warming over specified time periods. On the basis of such studies, it is extremely likely1 that human influences, especially emissions of greenhouse gases, have been the dominant cause of the observed global warming since the mid-20th century.

Further warming is unavoidable under all plausible future emission scenarios, as some additional greenhouse gas emissions are inevitable. However, the extent to which future emissions of greenhouse gases, particularly carbon dioxide, grow or decline will largely determine how much future climate will change (see Chapter 3, Sections 3.2, 3.3, and 3.4). Canada and the world face very different futures, depending on the level and speed at which measures to reduce greenhouse gas emissions are implemented. If and when net emissions of carbon dioxide and other long-lived greenhouse gases reach zero, global average temperature will remain approximately constant for centuries at about the peak temperature attained. Other aspects of the climate system will continue to change even after emissions cease; for example, sea level will continue to rise (see Chapter 7, Section 7.5).

Warming globally and for Canada will be similar under all plausible emission pathways over the next two decades. However, efforts to reduce greenhouse gas emissions, beginning in the next two decades and continuing thereafter, will have an increasing impact on the amount of additional warming beyond this time frame. Available estimates indicate that, by the late 21st century, the global climate will warm by a further 1°C for a low emission scenario (RCP2.6) compared to a further 3.7°C for a business-as-usual high emission scenario (RCP8.5) (relative to the reference period of 1986–2005, with a 5%–95% range of about 1°C above and below the multi-model average; see Chapter 3, Sections 3.2 and 3.3).2 These two scenarios reflect two very different global futures, as climate-related impacts and risks grow with increasing amounts of global warming. Only the low emission scenario (RCP2.6) is consistent with holding the increase in the global average temperature to below 2ᵒC above pre-industrial levels, in line with Article 2 of the Paris Agreement. This scenario requires global emissions to peak almost immediately, with rapid and deep reductions thereafter (see Chapter 3, Section 3.2).

8.3

Changes across Canada

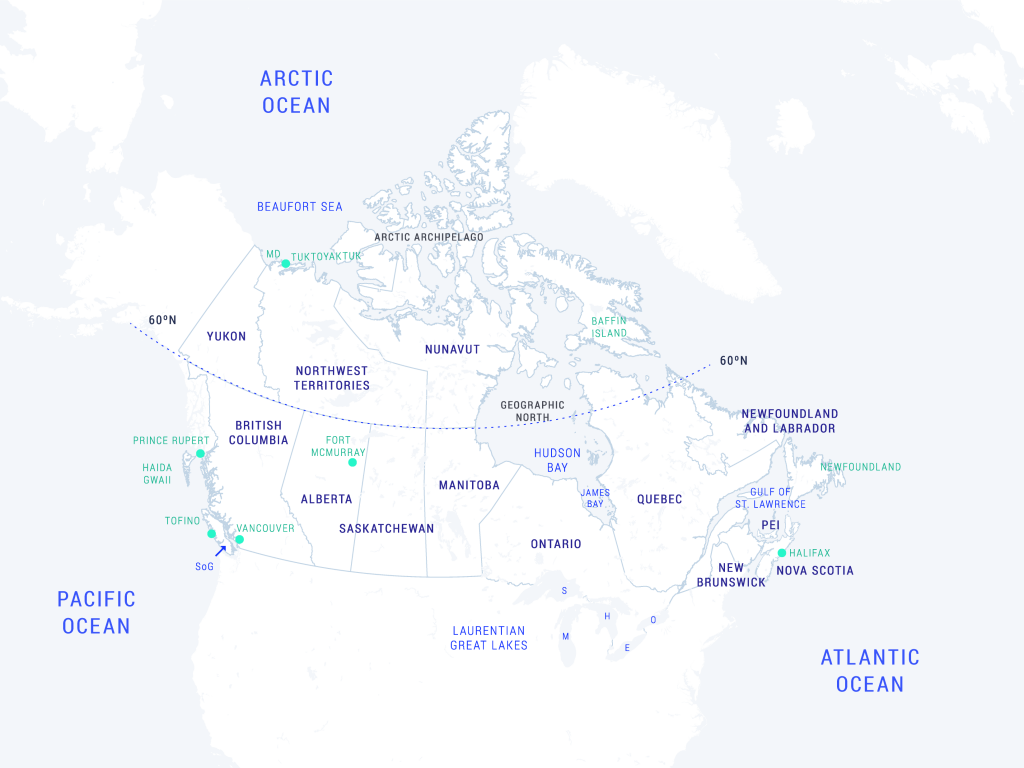
Because air in the Earth’s atmosphere and water in the global oceans flow freely, Canada’s climate is intimately linked to the global climate. Thus, changes in Canada’s climate are a manifestation of changes in the global system, modulated by the effects of Canada’s mountains, coastlines, and other geographical features. For example, a robust feature of both observed and projected global-scale climate change is the amplification of warming at high northern latitudes (so-called Arctic amplification), which means Canada’s climate is expected to warm more than the global average (see Chapter 2, Section 2.2 and Chapter 3, Section 3.3). Canadian temperature has increased, and is projected to increase further, at almost double the rate of global mean temperature (see Chapter 2, Section 2.2 and Chapter 4, Section 4.2). Precipitation changes in Canada are also closely linked to global-scale changes, such as the overall intensification of the global water cycle, the increase in high-latitude precipitation, and the intensification of precipitation extremes that are projected as a result of greenhouse gas increases. Precipitation has increased in Canada since mid-century, particularly in northern parts of the country. Many other aspects of climate that are important to Canadians are also changing as a consequence of global-scale climate change. These changes include the extent and duration of snow and ice cover, permafrost temperatures, freshwater availability, fire weather, other extremes of weather and climate, sea level, and other properties of the oceans surrounding Canada (Chapters 4 to 7). Locations of places in Canada referred to in this chapter are shown in Figure 8.1.

Figure-8.1

Map of Canada with place names referred to in this chapter

The map shows land, freshwater and marine locations in Canada mentioned in this chapter, as a reference for place names.
Figure-8.1

Map of Canada showing selected places mentioned in the text. PEI is Prince Edward Island, VI is Vancouver Island, SoG is Strait of Georgia, MD is Mackenzie Delta, S is Lake Superior, H is Lake Huron, M is Lake Michigan, E is Lake Erie, and O is Lake Ontario.

There is no doubt that Canada’s climate has warmed. Temperature has increased in all regions of the country and in the surrounding oceans. Since 1948, Canada’s annual average surface air temperature over land has warmed by 1.7°C (best estimate), with higher temperature increases observed in the North, the Prairies, and northern British Columbia (see Chapter 4, Section 4.2.1). The greatest warming has occurred in winter. Human influence is likely the main cause of the observed increase in Canada’s temperature, as more than half of the observed warming in annual temperature in Canada can be attributed to human influence (Chapter 4, Section 4.2.1). Temperature extremes are also changing, consistent with the increase in mean temperature. Extreme warm temperatures have become hotter, while extreme cold temperatures have become less cold (see Chapter 4, Section 4.2.2). Overall, there is high confidence that most of the observed increase in the coldest and warmest daily temperatures in Canada (1948–2012) can be attributed to anthropogenic influence. Warming has also been demonstrated to have led to an increased risk of extreme fire weather in parts of western Canada (see Chapter 4, Section 4.3 and Box 4.2).

Observed changes in snow and ice features across Canada provide a coherent picture of a warming climate: fall and spring snow cover and summer sea ice extent are decreasing; glaciers are losing extent and mass; and permafrost is warming (see Chapter 5, Sections 5.2.1, 5.3.1, 5.4.1, and 5.6.1). Changes in relative (or local) sea level at locations along Canadian coastlines are driven primarily by the observed rise in average global sea level — a response to global-scale warming — and by vertical land motion (i.e., land uplift or subsidence). As a result, some coastal regions have experienced a larger relative sea-level rise compared to average global sea level, while others have experienced more modest increases or even decreases in relative sea level (see Chapter 7, Section 7.5).

Canada’s climate will warm further, with warming projected in all seasons. Projected warming for Canada as a whole is almost double that of the global average, regardless of the emission scenario (see Chapter 3, Section 3.3.3, and Chapter 4, Section 4.2.1.3). Country-wide annual average temperature projections for the late century (2081–2100) range from an increase of 1.8°C3 (1.1, 2.5) for a low emission scenario (RCP2.6) to 6.3°C (5.6, 7.7) for a high emission scenario (RCP8.5), compared to the base period 1986–2005.4 Further warming of extreme warm and cold temperatures is projected to be substantial (see Chapter 4, Section 4.2.2.3). In the future, higher temperatures will contribute to an increased risk of extreme fire weather across much of Canada. It is very likely that snow cover duration will decline to mid-century across Canada due to increases in temperature under all emission scenarios. Projections with a high emission scenario show continued snow loss after mid-century (high confidence) (see Chapter 5, Section 5.2.2). Oceans surrounding Canada are projected to continue to warm over the 21st century, in response to past and future emissions of greenhouse gases, with the size of the increase depending on the emission scenario. The warming in summer will be greatest in the ice-free areas of the Arctic and off southern Atlantic Canada, where subtropical water is projected to shift further north (medium confidence). Atlantic Canada will be the region of Canada’s oceans that will warm the most during winter (medium confidence) (see Chapter 7, Section 7.2.2).

Canada’s annual precipitation has increased in all regions since 1948, with relatively larger percentage increases in northern Canada and parts of Manitoba, Ontario, northern Quebec, and Atlantic Canada, although there is low confidence in observed regional precipitation trends. Mean precipitation has also increased in all seasons, except during winter in British Columbia and the western Prairies (see Chapter 4, Section 4.3.1). As a result of warming, snowfall has been reduced as a proportion of total precipitation in southern Canada. Seasonal snow accumulation has declined over the period of record (1981–2015) on a country-wide basis (medium confidence) (see Chapter 5, Section 5.2.1). The most significant observed changes in freshwater availability are in the seasonal distribution of streamflow in many snow-fed catchments: winter flows have become higher the timing of spring peak flows has become earlier, and there has been an overall reduction in summer flows (high confidence) (see Chapter 6, Sections 6.2.1, 6.2.2, and 6.2.3). However, many other indicators — annual streamflow magnitudes, surface and shallow groundwater water levels, soil moisture content and droughts — have, for the most part, been variable, with no clear increasing or decreasing trends (see Chapter 6, Sections 6.2.1, 6.3, 6.4, and 6.5). This variability corresponds to observed year-to-year and multi-year variations in precipitation, which are influenced by naturally occurring large-scale climate variability (see Chapter 2, Box 2.5).

In the future, annual and winter precipitation is projected to increase in all regions, with larger relative changes for the North. Summer precipitation shows relatively smaller changes and is projected to decrease in southern regions of Canada by the end of the century under a high emission scenario (see Chapter 4, Section 4.3.1). Daily extreme precipitation (that is, changes in extreme precipitation amounts accumulated over a day or less) is projected to increase; thus, there is potential for a higher incidence of rain-generated local flooding, including in urban areas (high confidence) (see Chapter 6, Section 6.2.4). Significant reductions in seasonal snow accumulation are projected through to mid-century for much of southern Canada due to warming surface temperatures, while only small changes are projected for northern Canada because winter temperatures will remain sufficiently cold despite overall warming (see Chapter 5, Section 5.2.2). In association with warmer temperatures, seasonal changes in streamflow are expected to continue, including shifts from more snowmelt-dominated regimes toward rainfall-dominated regimes. Shifts toward earlier snowmelt-related floods, including those associated with spring snowmelt, ice jams, and rain-on-snow events, are also anticipated. However, changes to the frequency and magnitude of future snowmelt-related floods are uncertain (see Chapter 6, Section 6.2.1, 6.2.3, and 6.2.4). Freshening of the ocean surface is projected in most Canadian waters over the rest of this century due to increases in precipitation and melting of land and sea ice. However, salinity is expected to increase in waters off the continental shelf south of Atlantic Canada as a result of a northward shift of subtropical water. The freshening in the upper layers of the ocean, along with warming, is expected to increase the “vertical stratification” (changes in density of ocean water at greater depths), which will affect the oceans’ ability to sequester greenhouse gases, dissolved oxygen levels, and marine ecosystems (see Chapter 7, Section 7.3.2).

8.4

Changes in Canada’s regions

The assessments of changes in climate provided in the key messages of Chapters 4 to 7 are associated with a level of confidence or a statement of likelihood, when possible. This assessment of uncertainty is based on the quantity, quality, and agreement of supporting evidence for changes assessed at the national scale. Uncertainty assessments are not always included in the regional summaries that follow, because uncertainties in regional-scale changes were not formally assessed within the previous chapters of this report. However, in general, for assessments at regional and local scales, the level of confidence in changes is lower and the uncertainty is larger, especially when assessing the magnitude (rather than the direction) of change (see Box 8.1).

To demonstrate regional differences and similarities, mean quantities for temperature and precipitation for six regions of Canada are provided below. For details about other temperature and precipitation quantities, including temperature and precipitation extremes for regions of Canada, readers are referred to the tables and figures in Chapter 4, Section 4.2.2, specifically Table 4.3, Figures 4.10, 4.11, 4.13 and 4.14 (temperature extremes and indices) and Section 4.3.2, specifically Table 4.6 (precipitation extremes). In all cases, values represent averages for the whole of the region and do not capture the significant variability between locations in every region. Information on climate trends and projected changes at the subregional and local scale are available from the Canadian Centre for Climate Services (https://www.canada.ca/en/environment-climate-change/services/climate-change/canadian-centre-climate-services/about.html). For further information on regional changes to sea level and other coastal issues, readers are referred to the recent report on Canada’s Marine Coasts in a Changing Climate (https://www.nrcan.gc.ca/environment/resources/publications/impacts-adaptation/reports/assessments/2016/18388; see Chapter 1, Section 1.1).

8.4.1

Changes in northern Canada

Northern Canada is defined as the geographical region north of 60° north latitude, encompassing Yukon, Northwest Territories, most of Nunavut, and parts of Nunavik (northern Quebec) and Nunatsiavut (northernmost Newfoundland and Labrador)5. In this region as a whole, annual mean temperature has increased by 2.3°C from 1948 to 2016, roughly three times the warming rate of global mean temperature (see Chapter 2, Section 2.2.1, and Chapter 4, Section 4.2.1). This increase has been strongest during winter (4.3°C), and weakest during summer (1.6°C), over the same time period.

The observed temperature increase is associated with changes in other temperature-sensitive variables. Snow cover extent during spring (April–June) and fall (October–December) has been significantly reduced in northern Canada, with a commensurate reduction in annual snow cover duration (see Chapter 5, Section 5.2.1). As well, freshwater ice cover duration has decreased for most Arctic lakes (see Chapter 5, Section 5.5.1). Canada’s northernmost lake, Ward Hunt Lake, had previously maintained ice cover throughout the year, but the ice melted completely in 2011 and 2012. There has been a reduction in glaciers and ice caps in the Canadian Arctic, which has accelerated in the last decade (see Chapter 5, Section 5.4.1). Permafrost temperatures have increased throughout northern Canada, and this warming of the frozen ground has led to increases in active layer thickness, melting of ground ice, and the formation of thermokarst landforms (see Chapter 5, Section 5.6.1). There is also evidence that these processes have affected lake levels in northwestern Canada (see Chapter 5, Section 5.6.1), including a higher incidence of rapid lake drainage (see Chapter 6, Section 6.3.2). The extent of sea ice cover, including areas with multi-year ice, has diminished across the Canadian Arctic (see Chapter 5, Section 5.3.1). The rate of decline for both multi-year sea ice and summer sea ice in the Beaufort Sea and the Canadian Arctic Archipelago has accelerated since 2008. Acidification of the Arctic Ocean, resulting from human emissions of carbon dioxide, has been augmented by rapid increases in freshwater input from accelerated ice melt and increased river input (Chapter 7, Section 7.6.1).

At coastal locations, the sea-level change that is experienced relative to land is known as “relative” sea-level change. Relative sea level has risen along the Beaufort Sea coastline (including Tuktoyaktuk) at a rate higher than that for global sea-level rise but has fallen along much of the eastern Arctic and Hudson Bay coastal regions. This variability in sea-level changes reflects regional land uplift and subsidence that is still occurring following the retreat of the ice sheet that covered the region during the last ice age (see Chapter 7, Section 7.5.1). Changes in sea ice in the Beaufort region have resulted in increased wave heights and duration of the wave season (see Chapter 7, Sections 7.4.1 and 7.4.2).

Annual mean temperature for Canada’s North is projected to increase by approximately 1.8°C6 (1.2, 2.5) for a low emission scenario (RCP2.6) to 2.7°C (2.0, 3.5) for a high emission scenario (RCP8.5) for 2031–2050, and by 2.1°C (1.3, 2.5) (RCP2.6) to 7.8°C (6.2, 8.4) (RCP8.5) for 2081–2100; all values are relative to the 1986–2005 mean value (see Chapter 4, Section 4.2.1). Changes in winter (January–March) snow cover and in the amount of snow (measured as pre-melt maximum snow water equivalent) are projected to be minimal across northern Canada because increased snowfall at high latitudes is expected to be offset by increasing temperatures that will shorten the snow-accumulation season (see Chapter 5, Section5.2.2). Glaciers and ice caps will continue to shrink. Based on observed changes in recent decades, many small ice caps and ice shelves will disappear completely by 2100 (see Chapter 5, Section 5.4.2). Future warming of permafrost will be greater near the surface than in deeper layers of the ground, but the area of Canada underlain by deep permafrost is projected to decline by 16% to 20% by 2090, relative to 1990 (see Chapter 5, Section 5.6.2). This increase in permafrost thaw could lead to increases in thermokarst and affect levels of northern lakes (see Chapter 5, Section 5.6.2, and Chapter 6, Section 6.3.2). With respect to sea ice, there is a greater than 50% probability that, by 2050 under a high emission scenario, extensive regions in the Canadian Arctic will be free of sea ice in September, with additional ice-free months possible in some regions (see Chapter 5, Section 5.3.2). Hudson Bay, which is currently ice-free in August and September, has a high probability of becoming ice-free for four consecutive months (August through November). This reduction in ice cover is expected to lead to an increase in sea surface temperature of up to 4°C during these months (see Chapter 7, Section 7.2.2). With projected reductions in sea ice in the Arctic Ocean, wave heights and the duration of the summer wave season are expected to increase (see Chapter 7, Section 7.4.2). Relative sea-level is projected to rise in the Beaufort Sea coastal area, while most regions in Nunavut will experience little change or declining relative sea level due to continued land uplift (see Chapter 7, Section 7.5.2, and Figure 7.16). Under a high emission scenario, relative sea level in the Beaufort Sea coastal area, including the Mackenzie Delta region (Northwest Territories), is projected to rise between 50 and 75 cm by 2100 (median projection). In contrast, relative sea level is projected to fall substantially, by up to 90 cm, under the same scenario for Hudson Bay (Nunavut) and the Arctic Archipelago, including Baffin Island (Nunavut), as land uplift more than offsets global sea-level rise. All emission scenarios result in similar sea-level change by mid-century, with the higher emission scenarios leading to larger sea-level rise or smaller sea-level fall after 2050 (see Chapter 7, Section 7.5.2).

Long-term changes in total precipitation over northern Canada are difficult to accurately quantify because of the sparse observing network. However, all available sites in the region reveal large percentage increases in precipitation (see Chapter 4, Section 4.3.1), both annual and seasonal, with precipitation having increased in every season. During the summer, snowfall has decreased and is being replaced by rain (see Chapter 4, Section 4.3.1). However, on an annual basis, snowfall has increased, since total precipitation has increased and temperatures during the cold part of the year are still low enough for precipitation to fall as snow. In association with warming temperatures and resulting changes to snow and permafrost (see Chapter 5, Sections 5.2.1 and 5.6.1), winter streamflows have increased (see Chapter 6, Section 6.2.1), and the timing of spring freshet has shifted earlier (see Chapter 6, Section 6.2.2).

Annual mean precipitation for the North is projected to increase, by 8.2% (2.1, 14.6) for a low emission scenario (RCP2.6) to 11.3% (5.4, 18.1) for a high emission scenario (RCP8.5) for 2031–2050, and by 9.4% (2.8, 16.7) (RCP2.6) to 33.3% (22.1, 46.4) (RCP8.5) for 2081–2100; all values are relative to the 1986–2005 base period. Precipitation is projected to increase in all seasons, and daily extreme precipitation is also projected to increase (see Chapter 4, Section 4.3.2). There is high confidence in these projected precipitation increases, as this is a robust feature of multiple generations of climate models and can be explained by the expected increase in atmospheric moisture induced by warming (see Chapter 4, Section 4.3.1). In association with these increases, annual streamflow in the North is also projected to increase, along with continuing earlier spring freshets due to rising temperatures (see Chapter 6, Sections 6.2.1 and 6.2.2).

8.4.2

Changes in southern Canada

Southern Canada encompasses the provinces of Canada, with the exception of northernmost Quebec and Newfoundland and Labrador, which are included in the geographic definition of northern Canada. Some observed and projected changes in southern Canada were included in Section 8.2 on changes across Canada. This section characterizes broad spatial patterns in changes across southern Canada, with regional differences and similarities highlighted in the subsections below for the five regions of southern Canada.

Long-term climate observations for southern Canada extend back to 1900. Between 1900 and 2016, annual mean temperature increased by 1.9°C for southern Canada as a whole (see Chapter 4, Section 4.2.1). Projected warming under both low (RCP2.6) and high (RCP8.5) emission scenarios show a general pattern of change in winter, consistent across scenarios, with the smallest changes observed in southernmost Canada and the largest changes in Hudson Bay (and the Arctic, covered in the previous section) (see Chapter 4, Section 4.2.1). Projected warming in the summer season is more uniform across Canada, with less differentiation between southern and northern Canada. Warming is projected to continue, with larger increases in interior continental areas than in both eastern and western coastal regions.

Fall snow cover has decreased across all of southern Canada over the 35-year record, whereas spring snow cover has increased in the southwestern regions and decreased elsewhere during the same period (see Chapter 5, Section 5.2.1). Earlier spring freshet, along with an increase in winter streamflow, is a robust feature across southern Canada. Snow cover and maximum snow water equivalent are projected to decrease across southern Canada (see Chapter 5, Section 5.2.2). The extent and duration of ice cover on rivers and lakes are also projected to decrease. There is high confidence that streamflow regimes will shift from primarily snow-driven, snowmelt-dominated regimes, with one pronounced spring peak, toward more rainfall-dominated regimes, with smaller and earlier spring snowmelt peaks and several rainfall-dominated warm-season peaks (see Chapter 6, Sections 6.2.2 and 6.2.3).

An increase in average precipitation was observed over the five regions of southern Canada since 1900 (low confidence), and the proportion of precipitation falling as snow has steadily decreased (see Chapter 4, Section 4.3.1). Projected changes in precipitation show both increases and decreases, depending on location and season. This pattern is therefore different than that for temperature, which is projected to increase everywhere and in all seasons. In the near term, a small (generally less than 10%) increase in precipitation is projected in all seasons. Increases in precipitation are projected for southern Canada in all seasons and scenarios, with the exception of the southernmost latitudes in summer, where precipitation is projected to decrease toward the late century under a high emission scenario (RCP8.5) (see Chapter 4, Section 4.3.1), which could affect surface water levels and risk of drought in these regions (see Chapter 6, Sections 6.3 and 6.4). This southernmost area of Canada is at the northern edge of a general area where climate models project a decrease in summer precipitation.

8.4.2.1:

Atlantic region

In this region, annual mean temperature has increased at a modest rate, by 0.7°C from 1948 to 2016, which is below the average increase for Canada (see Chapter 4, Section 4.2.1). The trend is largest in summer, with an increase of 1.3°C, and smallest in winter, at 0.5°C. This is also in contrast with larger winter warming for most regions of Canada. Natural internal variability of the climate system may have played a role in this difference between Eastern Canada and other regions over this period. Small mountain glaciers in Labrador have contracted in area and thickness (see Chapter 5, Section 5.4.1). Sea ice in the Atlantic Ocean has declined in winter by 7.5% per decade since 1969.This is consistent with observed upper-ocean warming, which varies in magnitude across the Atlantic region (see Chapter 7, Section 7.2.1).The seawater pH of this region has been declining in response to human emissions of CO2. Oxygen content has also decreased steadily over the last three decades (Chapter 7, Section 7.6.1, 7.6.2).

In future, annual mean temperature for 2031–2050 is projected to increase by 1.3°C7 (0.9, 1.8) for a low emission scenario (RCP2.6) to 1.9°C (1.5, 2.4) for a high emission scenario (RCP8.5), and by 1.5°C (0.9, 2.0) (RCP2.6) to 5.2°C (4.5, 6.1) (RCP8.5) for 2081–2100, compared with a baseline of 1986–2005 (see Chapter 4, Section 4.2.1). Wave heights and the duration of the wave season are expected to increase in the Newfoundland/Labrador coastal area during winter because of reduced sea ice extent (Chapter 5, Section 5.3.2; Chapter 7, Section 7.4.2).

The coast of southern Atlantic Canada is sinking because of the retreat of the last ice sheet, and this will contribute to relative sea-level rise, which will be larger than the projected global sea-level rise. This region will experience the largest relative sea-level rise in Canada, reaching 75 to 100 cm for a high emission scenario by 2100 (see Chapter 7, Section 7.5.2). This combination of sea ice and sea-level changes, and continued sinking of coastlines, will lead to an increase in frequency and magnitude of extreme high water levels. For example, a 20 cm rise in relative sea level in Halifax (projected to occur within two to three decades under all emission scenarios) will increase the frequency of flooding by a factor of four (see Chapter 7, Section 7.5.3). Further north, in Labrador, a smaller relative sea-level rise is projected under a high emission scenario, primarily as a result of crustal (land) uplift following the retreat of the ice sheet (see Chapter 7, Section 7.5.2).

Annual mean precipitation has increased by 11% from 1948 to 2012, with seasonal trends ranging from 5.1% in winter to 18.2% in fall (see Chapter 4, Section 4.2.1), although there is low confidence in these trends. Annual precipitation for 2031–2050 is projected to increase by 3.8% (−0.8, 9.1) for a low emission scenario (RCP2.6) to 5.0% (0.6, 9.9) for a high emission scenario (RCP8.5), and by 4.7% (0.3, 9.0) (RCP2.6) to 12.0% (5.7, 19.3) (RCP8.5) for 2081–2100 (see Chapter 4, Section 4.3.1).

8.4.2.2

Quebec region

Annual mean temperature in Quebec has increased by 1.1°C over the period 1948–2016, a rate lower than for Canada as a whole. The trend is largest in summer and autumn, with an increase of 1.5°C, and smallest in spring, at 0.7°C. There has been earlier ice break-up and later freeze-up in small lakes in southern Quebec (see Chapter 5, Section 5.5.1). Permafrost in northern Quebec has warmed by 0.7°C or more since the 1990s, resulting in landscape changes throughout the region (see Chapter 5, Section 5.6.1). Sea ice cover in the Gulf of St. Lawrence and in eastern Hudson Bay and James Bay has declined (see Chapter 5, Section 5.3.1), resulting in impacts for marine ecosystems and coastal infrastructure. The deep waters of the Gulf of St. Lawrence have warmed by 0.25°C per decade during 1915–2017 (see Chapter 7, Section 7.2.1). In addition, recent satellite observations for May to November indicate a sea surface warming trend of 0.46°C per decade during 1985–2017 (see Chapter 7, Section 7.2.1). The pH of waters in the Gulf of St. Lawrence has been declining in response to increases in atmospheric carbon dioxide, and oxygen content has decreased (see Chapter 7, Sections 7.6.1 and 7.6.2).

Annual mean air temperature is projected to increase for 2031–2050 by  1.5°C8 (1.0, 2.1) for a low emission scenario (RCP2.6) to 2.3°C (1.7, 2.9) for a high emission scenario (RCP8.5), and by 1.7°C (1.0, 2.2) (RCP2.6) to 6.3°C (5.3, 6.9) (RCP8.5) for 2081–2100, compared with a baseline of 1986–2005 (see Chapter 4, Section 4.2.1).

Relative sea-level is expected to rise in the range of 25 to 75 cm this century for the Gulf of St. Lawrence under a high emission scenario (see Chapter 7, Section 7.5.2). Wave heights and the duration of the wave season are expected to increase in the Gulf of St. Lawrence during winter because of reduced sea ice extent, similar to what is expected in Newfoundland/Labrador (see Chapter 5, Section 5.3.2; Chapter 7, Section 7.4.2). But relative sea level is projected to fall for James Bay and Hudson Bay (northwestern Quebec), which is similar to what is expected in Nunavut (see Chapter 7, Section 7.5.2).

Annual precipitation has increased by 10.5% during 1948–2012, with seasonal trends ranging from 5.3% in winter to 20.9% in spring, although there is low confidence in the magnitude of these trends (see Chapter 4, Section 4.3.1). Corresponding projected changes in annual mean precipitation for 2031–2050 are increases of 7.1% (2.0, 12.2) for a low emission scenario (RCP2.6) to 9.4% (4.5, 14.7) for a high emission scenario (RCP8.5), and of 7.2% (2.2, 13.0) (RCP2.6) to 22.5% (14.8, 32.0) (RCP8.5) for 2081–2100 (see Chapter 4, Section 4.3.1). Projections of future streamflow reveal an earlier freshet, by as much as 20 days in southern Quebec rivers by the mid-century (RCP8.5) (see Chapter 6, Section 6.1.2).

8.4.2.3

Ontario region

Annual mean temperature has increased 1.3°C for the Ontario region over the period 1948–2016. The trend is largest in winter, with an increase of 2.0°C, and smallest in autumn, at 1.0°C (see Chapter 4, Section 4.2.1). Laurentian Great Lakes ice cover has varied considerably from year to year since 1971 (see Chapter 5, Section 5.5.1). Sea ice cover in southern Hudson Bay and western James Bay (northern Ontario) has also declined (see Chapter 5, Section 5.3.1).

Annual mean temperature for 2031–2050 is projected to increase by 1.5°C9 (1.1, 2.1) for a low emission scenario (RCP2.6) to 2.3°C (1.7, 2.9) for a high emission scenario (RCP8.5), and by 1.7°C (1.0, 2.1) (RCP2.6) to 6.3°C (5.3, 6.9) (RCP8.5) for 2081–2100, compared with a baseline of 1986–2005. Relative sea level is projected to fall along the James Bay and Hudson Bay coastlines (see Chapter 7, Section 7.4.2).

Annual precipitation has increased by 9.7% during 1948–2012, with seasonal trends ranging from 5.2% in winter to 17.8% in fall, although there is low confidence in the magnitude of these trends (see Chapter 4, Section 4.3.1). Lake levels in the Laurentian Great Lakes have exhibited large variability, including a rapid rise from below-average levels, with record lows for Lakes Michigan/Huron in 2012/2013, to above-average levels in 2014. However, no discernible long-term trend has been observed in the last 100 years (see Chapter 6, Section 6.2.1). There is satellite-based evidence that groundwater storage declined in the Laurentian Great Lakes region during 2002–2010, but, due to the short record, this is not necessarily indicative of a long-term trend (see Chapter 6, Section 6.4).

Annual mean precipitation for 2031–2050 is projected to increase by 5.5% (0.4, 11.1) for a low emission scenario (RCP2.6) to 6.6% (1.8, 12.4) for a high emission scenario (RCP8.5), and by 5.3% (−0.1, 10.8) (RCP2.6) to 17.3% (8.5, 26.1) (RCP8.5) for 2081–2100 (see Chapter 4, Section 4.3.1). In the future, overall lake levels in the Laurentian Great Lakes may decline as a result of higher evaporation in a projected warmer climate, exceeding projected increases in precipitation. However, there is considerable uncertainty in this projection (see Chapter 6, Section 6.3.1).

8.4.2.4

Prairies region

For the Prairie provinces, annual mean temperature has increased by 1.9°C over the period 1948–2016, at a rate above that for Canada as a whole. The trend is largest in winter, with an increase of 3.1°C, and smallest in fall, at 1.1°C (see Chapter 4, Section 4.2.1). Unlike in other southern regions, snow cover in spring increased during 1981–2015, probably as a result of natural variability (see Chapter 5, Section 5.2.1). Warming has led to an increased probability of extreme fire weather conditions in parts of western Canada, which are associated with wildfire occurrence, such as the 2016 Fort McMurray wildfire (see Chapter 4, Box 4.2 and Section 4.4).

Annual mean temperature for 2031–2050 is projected to increase by 1.5°C10 (1.1, 2.1) for a low emission scenario (RCP2.6) to 2.3°C (1.7, 3.0) for a high emission scenario (RCP8.5), and by 1.9°C (1.2, 2.2) (RCP2.6) to 6.5°C (5.2, 7.0) (RCP8.5) for 2081–2100, compared with a baseline of 1986–2005 (see Chapter 4, Section 4.3.1). Relative sea level is projected to fall along the Hudson Bay coastline of Manitoba, similar to what is expected in Nunavut, Quebec, and in Ontario (see Chapter 7, Section 7.4.2).

During 1948–2012, annual precipitation increased by 7.0%, with seasonal trends ranging from a decrease of 5.9% in winter to an increase of 13.6% in spring, although there is low confidence in the magnitude of these trends (see Chapter 4, Section 4.3.1). Exceptionally high precipitation from the late 2000s through 2016 has resulted in a dramatic increase in levels in some closed-basin lakes after a prolonged period of decline, illustrating their high hydro-climatic variability and sensitivity to excess precipitation (see Chapter 6, Section 6.3.2). Periodic droughts are a common occurrence in the Canadian Prairies, but no long-term changes are evident during the last century (see Chapter 6, Section 6.4.2).

Annual mean precipitation for 2031–2050 is projected to increase by 5.0% (−0.7, 10.8) for a low emission scenario (RCP2.6) to 6.5% (0.4, 13.1) for a high emission scenario (RCP8.5), and by 5.9% (−0.2, 12.1) (RCP2.6) to 15.3% (6.3, 24.9) (RCP8.5) for 2081–2100 (see Chapter 4, Section 4.3.1). Future droughts and soil moisture deficits are expected to be more frequent and intense over the southern Prairies during summer, when evaporation and transpiration due to increased temperatures exceed precipitation (see Chapter 6, Sections 6.4.1 and 6.4.2). Since many Prairie rivers have their headwaters in the western mountains, summer streamflow is projected to decrease in association with decreasing snow and ice (see Chapter 6, Section 6.2.1).

8.4.2.5

British Columbia region

The annual mean warming trend for British Columbia has been 1.9°C over the period 1948–2016. The trend is largest in winter, at 3.7°C, and smallest in fall, at 0.7° C (see Chapter 4, Section 4.2.1). Upper-ocean warming trends of 0.08°C per decade have been observed over the last century off the west coast of Vancouver Island and of 0.15°C per decade in the Strait of Georgia (see Chapter 7, Section 7.2.1). Ice thickness of the Place Glacier and Helm Glacier in southern British Columbia has declined by 30 to 50 m water equivalent since the early 1980s (see Chapter 5, Section 5.4.1). Changes in ice and snow have affected annual water cycles in snowmelt-dominated catchments (e.g., Peace, Fraser, Columbia basins), including earlier spring streamflow peaks, increased winter flows, and decreased summer flows (see Chapter 6, Sections 6.2.1 and 6.2.2). Relative sea level has risen along the British Columbia coast, except in certain areas experiencing land uplift, such as Tofino.

Annual mean temperature for 2031–2050 is projected to increase by 1.3°C11 (0.8, 1.9) for a low emission scenario (RCP2.6) to 1.9°C (1.4, 2.5) for a high emission scenario (RCP8.5), and by 1.6°C (1.1, 2.1) (RCP2.6) to 5.2°C (4.3, 6.2) (RCP8.5) for 2081–2100, compared with a baseline of 1986–2005 (see Chapter 4, Section 4.3.1).

The northeast Pacific Ocean sea surface temperature is projected to warm roughly 2°C in winter and 3°C in summer by the 2046–2065 period (see Chapter 7, Section 7.2.2) under a high emission scenario (RCP8.5), relative to 1986–2005. Wave heights off British Columbia have decreased significantly over the past three to four decades in summer and increased slightly in winter, with small decreasing annual mean trends (see Chapter 7, Section 7.4.2). Relative sea-level rise under a high emission scenario is projected to exceed 50 cm by 2100 for Prince Rupert, Haida Gwaii, and the Vancouver area (see Chapter 7, Sections 7.5.1 and 7.5.2). Oxygen content in the northeast Pacific has decreased, and ocean waters along the coast are expected to become more acidic (Chapter 7, Sections 7.6.1 and 7.6.2).

Annual mean precipitation has increased by 5% during 1948–2012, with seasonal trends ranging from a decrease of 9.0% in winter to an increase of 18.2% in spring, although there is low confidence in the magnitude of these trends (see Chapter 4, Section 4.3.1). The decrease in winter precipitation differs from observed seasonal precipitation change in other parts of Canada. Such regional differences arise from natural climate variability. Annual mean precipitation for 2031–2050 is projected to increase by 4.3% (−0.4, 9.8) for a low emission scenario (RCP2.6) to 5.7% (0.0, 11.4) for a high emission scenario (RCP8.5), and by 5.8% (0.4, 11.9) (RCP2.6) to 13.8% (5.7, 22.4) (RCP8.5) for 2081–2100 (see Chapter 4, Section 4.3.1). As in the southern Canadian Prairies, summer droughts in the interior region of British Columbia are expected to increase in frequency and intensity as a result of increased evapotranspiration due to higher temperatures (see Chapter 6, Section 6.4.2). Watersheds in British Columbia are projected to have continued increases in winter runoff, earlier spring freshets, and declines in summer flow (see Chapter 6, Sections 6.2.1 and 6.2.2).

8.5

Conclusions

Canada’s Changing Climate Report describes a Canada that has warmed and will warm further. Historical warming has led to changes in rain and snow, rivers and lakes, ice, and coastal zones, and these changes are challenging our sense of what a “normal” climate is. The world’s climate, including Canada’s climate, is changing because of human emissions of greenhouse gases, particularly carbon dioxide (see Chapter 2, Section 2.3, and Chapter 4, Section 4.2.1). Beyond the next few decades, the largest uncertainty about the magnitude of future climate change is rooted in uncertainty about human behaviour, that is, whether the world will follow a pathway of low, medium, or high emissions (see Chapter 3, Sections 3.2 and 3.3). Until climate is stabilized, there will not be a new “normal” climate.

Attribution studies have shown that anthropogenic climate change has influenced some recent extreme events, as well as long-term regional-scale trends (Chapters 4, 5, 6, and 7). In the future, anthropogenic climate change will continue to affect aspects of climate important for agriculture, forestry, engineering, urban planning, public health, and water management, and the preparation of guidance and standards. The challenge for users of climate information is to determine how best to incorporate climate change information into the various methods and tools used for assessment and planning across these sectors. The information brought together in this report is intended to guide this process, informing the preparation of new standards, the assessment and management of climate-related risks, and the design and implementation of climate adaptation plans.

The Canada in a Changing Climate series of reports, led by Natural Resources Canada, will assess available knowledge on climate change impacts and adaptation across regions and sectors. Canada’s Changing Climate Report is the first publication of this series, and it has established a foundation of knowledge about how Canada’s climate is changing and why, as context for assessing impacts and adaptation responses.

Footnotes

  1. This report uses the same calibrated uncertainty language as in the IPCC’s Fifth Assessment Report. The following five terms are used to express assessed levels of confidence in findings based on the availability, quality and level of agreement of the evidence: very low, low, medium, high, very high. The following terms are used to express assessed likelihoods of results: virtually certain (99%–100% probability), extremely likely (95%–100% probability), very likely (90%–100% probability), likely (66%–100% probability), about as likely as not (33%–66% probability), unlikely (0%–33% probability), very unlikely (0%–10% probability), extremely unlikely (0%–5% probability), exceptionally unlikely (0%–1% probability). These terms are typeset in italics in the text. See chapter 1 for additional explanation.
  2. These changes are over and above the roughly 0.6ᵒC increase in global average temperature that has already occurred between 1850–1900 and the reference period of 1986–2005.
  3. Values provided are the median projection based on multiple climate models. Values in brackets represent the 25th and 75th percentile values from the fifth phase of the Coupled Model Intercomparison Project (CMIP5) multi-model ensemble. See Chapter 4, Table 4.2.
  4. The linear warming trend from 1948 (start date for climate trend analysis for Canada as a whole based on observations) to 1996 (mid-point of 1986–2005) is calculated to be 1.2°C.
  5. In this section, where changes have been estimated for the Territories, based on political boundaries, results are identified as being for Canada’s North.
  6. Values provided are the median projection based on multiple climate models.Values in brackets represent the 25th and 75th percentile values from the CMIP5 multi-model ensemble. See Chapter 4, Table 4.2 for temperature projections, and Table 4.5 for precipitation projection.
  7. Values provided are the median projection based on multiple climate models. Values in brackets represent the 25th and 75th percentile values from the CMIP5 multi-model ensemble. See Chapter 4, Table 4.2 for temperature projections, and Table 4.5 for precipitation projection.
  8. Values provided are the median projection based on multiple climate models. Values in brackets represent the 25th and 75th percentile values from the CMIP5 multi-model ensemble. See Chapter 4, Table 4.2 for temperature projections, and Table 4.5 for precipitation projection.
  9. Values provided are the median projection based on multiple climate models. Values in brackets represent the 25th and 75th percentile values from the CMIP5 multi-model ensemble. See Chapter 4, Table 4.2 for temperature projections, and Table 4.5 for precipitation projection.
  10. Values provided are the median projection based on multiple climate models. Values in brackets represent the 25th and 75th percentile values from the CMIP5 multi-model ensemble. See Chapter 4, Table 4.2 for temperature projections, and Table 4.5 for precipitation projection.
  11. Values provided are the median projection based on multiple climate models. Values in brackets represent the 25th and 75th percentile values from the CMIP5 multi-model ensemble. See Chapter 4, Table 4.2 for temperature projections, and Table 4.5 for precipitation projection.
Back to Home Page

Canada’s Changing Climate Report