Chapter 2

Understanding Observed Global Climate Change

This chapter provides a synopsis of the evidence that the Earth’s climate system is warming, that other aspects of climate are changing consistent with this warming, and that human activities are the main cause of these changes.

Recommended citation

Bush, E., Gillett, N., Watson, E., Fyfe, J., Vogel, F. and Swart, N. (2019): Understanding Observed Global Climate Change; Chapter 2 in Canada’s Changing Climate Report, (ed.) E. Bush and D.S. Lemmen; Government of Canada, Ottawa, Ontario, p. 25-72.

Authors

  • Elizabeth Bush (Environment and Climate Change Canada)
  • Nathan Gillett (Environment and Climate Change Canada)
  • Emma Watson (Environment and Climate Change Canada)
  • John Fyfe (Environment and Climate Change Canada)
  • Felix Vogel (Environment and Climate Change Canada)
  • Neil Swart (Environment and Climate Change Canada)
Figure-2.1
View details
Figure-2.2
View details
Figure-2.3
View details
Figure-2.4
View details
Figure-2.5
View details
Figure-2.6
View details
Figure-2.7
View details
Figure-2.8
View details
Figure-2.9
View details
Figure-2.10
View details

Chapter Key Messages

OBSERVED CHANGES IN THE GLOBAL CLIMATE SYSTEM

Warming of the climate system during the Industrial Era is unequivocal, based on robust evidence from a suite of indicators. Global average temperature has increased, as have atmospheric water vapour and ocean heat content. Land ice has melted and thinned, contributing to sea level rise, and Arctic sea ice has been much reduced.

UNDERSTANDING THE CAUSES OF OBSERVED GLOBAL CHANGE

Warming has not been steady over time, as natural climate variability has either added to or subtracted from human-induced warming. Periods of enhanced or reduced warming on decadal timescales are expected, and the factors causing the early 21st century warming slowdown are now better understood. In the last several years, global average temperature has warmed substantially, suggesting that the warming slowdown is now over.

The heat-trapping effect of atmospheric greenhouse gases is well-established. It is extremely likely that human activities, especially emissions of greenhouse gases, are the main cause of observed warming since the mid-20th century. Natural factors cannot explain this observed warming. Evidence is widespread of a human influence on many other changes in climate as well.


Summary

The Earth’s climate system comprises interacting physical components — the atmosphere, the hydrosphere (liquid water on Earth), the cryosphere (frozen elements), the land surface, and the biosphere, which encompasses all living things on land and in water. Measurements of variables within all of these systems provide independent lines of evidence that the global climate system is warming. The consistency of the signals across multiple components of the climate system provides a compelling story of unequivocal change.

The best-known indicator for tracking climate change is global mean surface temperature (GMST), estimated as the average (or mean) temperature for the world from measurements of sea surface temperatures and of near-surface air temperatures above the land. This measure has risen an estimated 0.85°C (90% uncertainty range between 0.65°C and 1.06°C) over the period 1880–2012. Each of the last three full decades (1980s, 1990s, and 2000s) has broken successive records for average 10-year temperatures. A warming slowdown occurred in the early 21st century, even though decadal temperature for the 2000s was higher than that for the 1990s. Natural climate variability influences GMST on a variety of timescales; therefore, periods of reduced or enhanced warming on decadal timescales are expected. The causes of the early 21st century warming slowdown are now better understood, and it appears to have ended, with the years 2015, 2016, and 2017 being the warmest on record, with GMST more than 1°C above the pre-industrial average level.

Signals of climate warming are also evident in other components of the climate system. The shift toward a warmer global climate on average has been accompanied by an increase in warm extremes and a decrease in cold extremes. The amount of water vapour (atmospheric humidity) in the atmosphere has very likely increased, consistent with the capacity of warmer air to hold more moisture. Not only has the ocean warmed at the surface, it is virtually certain that the whole upper ocean (to a depth of 700 m) has warmed. Global mean sea level has risen an estimated 0.19 m over the period 1901−2010 (90% uncertainty range between 0.17 m and 0.21 m) as a consequence of the expansion of ocean waters due to warming (warmer water takes up more volume) and the addition of new meltwater from shrinking glaciers and ice sheets worldwide. The extent of Arctic sea ice has also been shrinking in all seasons, with declines most evident in summer and autumn.

Understanding how much human activity has contributed to the observed warming of the climate system also draws from multiple lines of evidence. This includes evidence from observations, from improved understanding of processes and feedbacks within the system that determine how the climate system responds to both natural and human-induced perturbations, and from climate models (see Chapter 3.3.1).

The ability of greenhouse gases (GHGs) in Earth’s atmosphere to absorb heat energy radiated from the Earth is well understood. Emissions of GHGs from human activities have led to a build-up of atmospheric GHG levels. This rise in atmospheric GHG levels, predominantly carbon dioxide, has been the main driver of climate warming during the Industrial Era. The strong warming effect of increases in GHGs has been offset to some extent by increases in levels of atmospheric aerosols, which have climate-cooling effects. Variations in the brightness of the sun during the Industrial Era have had a warming effect on climate that is at least 10 times smaller than that from human activity and cannot explain the observed rise in global temperature. Volcanic eruptions have cooling effects on global climate that can last several years but cannot explain the observed long-term change in global temperature.

Determining how much of the observed climate warming and other climatic changes are due to these drivers is a complex task, as the climate system does not respond to these drivers in a straightforward way. To accomplish this task, climate (or Earth system) models are essential tools for identifying the causes of observed climate changes. Experiments with these models simulate how the climate system responds to real-world changes, including the impacts of human activities, and compare this with idealized experiments without human interference. On the basis of analysis of observations and such experiments, it is extremely likely that human influences, primarily emissions of GHGs, have been the dominant cause of the observed global warming since the mid-20th century. Studies have confirmed that there is a human contribution to observed changes in the lower atmosphere, the cryosphere, and the ocean, on a global scale.

2.1

Introduction

The oscillation between cold ice ages and warm interglacial periods over the past two million years on Earth is a testament to the effect on Earth’s climate of changes in global average temperature on the order of 5°C (Jansen et al., 200734; Masson-Delmotte et al., 201347). In modern times, on century timescales, the globe has warmed by about 1°C since the beginning of the Industrial Era (see Section 2.2.1), and additional warming is unavoidable in this century. The Paris Agreement under the United Nations Framework Convention on Climate Change2 has a stated goal of holding the increase in global average temperature to well below 2°C above pre-industrial levels and pursuing efforts to limit the temperature increase to 1.5°C. Given that historic warming has already moved us close to this goal, it is important to understand how and why climate is changing. This chapter provides a summary of that understanding, based primarily on the evidence presented in multiple chapters of the Intergovernmental Panel on Climate Change (IPCC) Working Group 1 Fifth Assessment Report (AR5) (IPCC, 2013a31).

This is one of two chapters of this report that examine global-scale climate change. Together, Chapters 2 and 3 provide context and background information for the assessment of past and future climate change in Canada found in Chapters 4 to 7. This context allows the report to provide a complete narrative to Canadian audiences about how changes in Canada are a manifestation of global-scale climate change. The background information on climate change and climate variability in this chapter is referred to in subsequent chapters of the report. While drawing primarily from the IPCC AR5, this chapter also includes some recent studies to update trends for key indicators of global climate change and to highlight areas where scientific understanding has advanced significantly since 2013. This chapter focuses on contemporary climate change, covering recent periods in the past (from multi-decade to century timescales) for which instrumental records are available. For a recent assessment of changes in past climate over longer timescales (from multi-century to multi-millennia timescales) and their causes, readers are referred to chapter 5 in the IPCC AR5 (Masson-Delmotte et al., 201347).

This chapter first presents the evidence from observations of global-scale climate changes (see Section 2.2) and then addresses the causes of contemporary climate change. The chain of evidence that enables scientists to be confident that human activities have played the dominant role in observed climate change over the past century or so is presented in Section 2.3. This chapter assesses studies using models of the climate system. Such models are required to comprehensively evaluate the causes of observed climate change, because they incorporate the complex processes and feedbacks that determine the climate system’s response to both human-caused and natural factors. Descriptions of how climate models are constructed, evaluated, and used to project future changes in climate are presented in Chapter 3, Section 3.3.


2.2

Observed changes in the global climate system

Key Message 1

Warming of the climate system during the Industrial Era is unequivocal, based on robust evidence from a suite of indicators. Global average temperature has increased, as have atmospheric water vapour and ocean heat content. Land ice has melted and thinned, contributing to sea level rise, and Arctic sea ice has been much reduced.

The global climate system comprises a number of interacting components, encompassing the atmosphere, hydrosphere (liquid water in oceans, lakes, rivers, etc.), cryosphere (snow, ice, and frozen ground), biosphere (all living things on land and in water), and the land surface. Long-term changes that are consistent with an overall warming of the climate system can be observed throughout the various components of the system. In this section, observed changes in global mean surface temperature (GMST), precipitation, the cryosphere, and oceans are reviewed. These changes are summarized from Chapters 2, 3, and 4 of the IPCC AR5 (Hartmann et al., 201322; Rhein et al., 201362; Vaughan et al., 201385). More recent observations indicate a general continuation of warming and related changes, with short-term year-to-year variability evident, as it is in the earlier record (Blunden and Ardnt, 20174; USGCRP, 201784).

“Climate” can be considered the average, or expected, weather and related atmospheric, land, and marine conditions for a particular location. Climate statistics are commonly calculated for 30-year periods, as recommended by the World Meteorological Organization. “Climate change” refers to a persistent, long-term change in the state of the climate, measured by changes in the mean state and/or its variability (IPCC, 2013c33). Measuring climate change, therefore, requires long-term observations of climate parameters so that long-term trends can be distinguished from shorter-term variations (see Section 2.3.3).

Changes in the frequency, intensity, and duration of climate and weather extremes3 are expected to accompany a changing climate. These changes can have large impacts on human and natural systems. For some types of extremes (e.g., hot and cold days/nights), changes in frequency are a natural consequence of a shift toward a warmer climate on average. For other extremes, the factors underlying expected changes are more complicated and can involve changes in the water cycle, ocean temperatures, atmosphere-ocean circulation, and other factors.

Quantifying changes in many extremes of climate and weather is more challenging than quantifying changes in mean climate conditions, for several reasons (IPCC, 201230). By definition, extremes occur infrequently. Therefore, observational data spanning many decades or longer are needed to derive adequate statistics about the historical occurrence rate of extremes, but these are often lacking.

2.2.1

Global annual and extreme temperature changes

Global-scale records of surface temperatures, based on thermometer observations of surface air temperatures over land and measurements of sea surface temperatures, are available from the late 19th century onwards. From these observations, various research groups have developed global temperature datasets (see Figure 2.1) using different procedures for processing the available raw data, such as the treatment of gaps in observations (see Section 2.3.3). Based on these independently produced global temperature datasets, a best estimate of GMST has been calculated, which represents changes over both land and ocean. This estimate shows that GMST rose 0.85°C over the period 1880–2012 (based on a linear trend, with a 90% uncertainty range between 0.65°C and 1.06°C) (Hartmann et al., 201322). The last three full decades (1980–2010) have been the warmest on record, with the longest dataset extending back to 1850 (see Figure 2.1) (Hartmann et al., 201322). Global temperatures in the last three years with complete records (2015, 2016, and 2017) are the three warmest years on record for the globe on average (WMO, 2018), at more than 1°C above pre-industrial average levels (Blunden and Arndt, 20163, 20174; WMO, 201789, 201890; Hawkins et al., 201723).

Figure-2.1

Observed global mean annual surface temperatures anomalies, 1850–2016

Line graph showing departure (anomaly) of global mean annual surface temperature from the average over the 1961–1990 reference period for the period 1850–2016. There are three lines showing temperature anomalies from three global datasets. The Met Office Hadley Centre and Climate Research Unit at the University of East Anglia, UK, dataset extends back to 1850 and the uncertainty range for this dataset is given. The US National Ocean and Atmospheric Administration (NOAA) National Centres for Environmental Information and NASA Goddard Institute for Space Studies datasets extend back to 1880. All three datasets are comparable, showing overall warming that was most pronounced over the period from approximately 1900 to 1940 and from 1970 onwards.
Figure-2.1

Departure (anomaly) of global mean annual surface temperature from the average over the 1961–1990 reference period, from three datasets. The grey shading indicates the uncertainty in the dataset produced by the Met Office Hadley Centre and the Climatic Research Unit at the University of East Anglia, UK (HadCRU).

Source

World Meteorological Organization, 2017. WMO Statement on the State of the Global Climate in 2016 (WMO-No. 1189), Fig. 1, p.5.

Annual GMST has not increased in a steady linear progression since the late 19th century (see Figure 2.1). During several periods, warming was more pronounced (e.g., 1900−1940 and 1970 onwards) or less pronounced (e.g., 1940−1970). These fluctuations arise from natural variations within the climate system (internal climate variability) and outside (external) forces, including human factors (see Section 2.3.3).

Almost the entire globe experienced warming on a century scale (1901–2012). This warming was not uniform from one region of the Earth to another, owing to a range of factors, including internal climate variability, and regional variations in climate feedbacks and heat uptake (Hartman et al., 201322). In general, warming has been strongest at high northern latitudes and stronger over land than oceans. Since Canada has a large land mass, much of which is located at high northern latitudes, warming across Canada has been about twice the global average (see Chapter 4, Section 4).

Cold and warm extremes of temperature can have large impacts on human and natural systems. Based on multi-decadal observational datasets and rigorous statistical analysis, the IPCC AR5 reports that, for global land area as a whole, the number of warm days and nights4 very likely increased and the number of cold days and nights very likely decreased over the period 1951–2010. Robust statistical assessment of heat waves and warm spells is more challenging. The IPCC AR5 assesses with medium confidence that, since the mid-20th century, the length and frequency of warm spells, including heatwaves,5 has increased for global land areas as a whole (Hartmann et al., 201322). At the continental scale, it is likely that heatwave frequency has increased in some regions of Europe, Asia, and Australia over this period. For North America and Central America, there is medium confidence that more regions have experienced increases in heatwaves and warm spells than have experienced decreases (Hartmann et al., 201322).

2.2.2

Global annual and extreme precipitation and related hydrological changes

Increasing global temperatures have impacts on the hydrological (water) cycle. The amount of moisture the atmosphere can hold increases with rising temperatures (about 7% per degree Celsius of warming). It is very likely that global specific humidity — a measure of the amount of water vapour in the air — near the surface and in the troposphere6 (see Figure 2.2) has increased since the 1970s, consistent with the observed temperature increase over this period (Hartmann et al., 201322).


Figure-2.2

Multiple independent indicators of a changing global climate

This figure displays multiple independent indicators of a changing global climate. There are 10 panels displaying observations for different elements over different time periods. Four panels display increasing land (four datasets), sea surface (five datasets), marine (two datasets), and tropospheric (seven datasets) temperatures. Increasing specific humidity is shown from four datasets. Rising global sea level (six datasets) from the late 19th century and rising ocean heat content (0−700 m depth from five datasets) from mid-century are shown. Time series show declining Arctic summer sea ice extent, Northern Hemisphere spring snow cover, and glacier mass balance.
Figure-2.2

Multiple indicators of a changing global climate from independently derived estimates. Datasets in each panel have been normalized to a common period of record.

Source

Hartman et al., 2013, FAQ 2.1, Figure 2. Datasets are found in Hartman et al., 2013, Supplementary material section 2.SM.5.

The effects of increasing atmospheric concentrations of greenhouse gases (GHGs) on the hydrological cycle and precipitation are more complex than for temperature. Precipitation varies substantially over time and space, to a greater extent than does temperature. Long-term precipitation trends are smaller, compared to the range of precipitation variability, than are temperature trends relative to the range of temperature variability. Therefore, a greater density of monitoring stations with long records of precipitation is required for robust assessment of precipitation trends than is the case for temperature. Owing to a lack of data, there is low confidence in estimates of precipitation changes over land at the global scale before 1951 and medium confidence thereafter. Annual average precipitation for global land areas increased slightly over the period 1901–2008, and different datasets vary in the magnitude of observed changes (Hartmann et al., 201322). It remains a challenge to determine long-term trends in precipitation for the global oceans. At the regional scale, average annual precipitation for the mid-latitude land area in the Northern Hemisphere shows a likely overall increase since 1901, with medium confidence before 1951 and high confidence after that date (Hartmann et al., 201322). The changes in precipitation across Canada are discussed in Chapter 4.

As climate warming has made more moisture available in the atmosphere, this additional atmospheric moisture can lead to increased intensity of extreme precipitation events that varies by location. Observed changes in extreme precipitation are generally larger than those in total annual precipitation. At the global scale, extreme rainfall over land, measured as the number of heavy precipitation events, has likely increased in more regions than it has decreased since the 1950s. There is large variability among regions and between seasons, but the highest confidence in observed results is for central North America, where there was very likely a trend toward heavier precipitation events since the 1950s (Harman et al., 201322).

While changes in precipitation patterns may be expected to contribute to changes in drought and floods, there is low confidence in global-scale trends for both of these hazards (Hartmann et al., 201322). However, regional-scale trends are evident in some areas, with a likely increase in frequency and intensity of drought in the Mediterranean and West Africa and a likely decrease in central North America (mainly central United States but including parts of southern Canada) since 1950. Perspectives on changes in the frequency and magnitude of droughts and floods in a Canadian context are provided in Chapter 6 (see also Chapter 4, Section 4.4 for a discussion of the 2013 Alberta flood).

2.2.3

Ocean changes

A number of changes observed over the past century provide evidence of a warming global ocean (Rhein et al., 201362) (see Figure 2.2). Comprehensive estimates of global mean temperatures in the upper ocean (to a depth of 700 m) reveal that warming since the early 1970s is virtually certain. The global average warming for the upper 75 m of the ocean over the period 1971–2010 was an estimated 0.11°C (90% uncertainty range from 0.09°C to 0.13°C) per decade. There is greater uncertainty in measurements of ocean temperatures before 1971 due, in part, to the scarcity of observations, but the IPCC AR5 reports that global average ocean warming (0−700 m) from the 1870s to 1971 was likely. Warming has also been observed deeper in the oceans, although the trends are not as strong. The IPCC AR5 reports that the increasing ocean heat content (absorbed heat that has been stored in the ocean; see Figure 2.2) accounts for roughly 90% of the energy accumulated globally over the period 1971–2010 (high confidence). This accumulation of energy in the ocean is strong evidence of excess energy in the Earth system, with less energy leaving the Earth system than entering (see Section 2.3.1; Rhein et al., 201362). In addition to absorbing excess heat, the Earth’s oceans have also been absorbing excess carbon dioxide (CO2) from the atmosphere, increasing their acidity (see Chapter 7, Section 7.6.1).

Global sea level rises primarily as a result of the expansion of ocean waters due to warming (thermal expansion) and the addition of water to the ocean from land ice (glacier and ice sheets) that is delivered to the oceans by melting and increased ice discharge. Tide-gauge records from around the world and, more recently, satellite altimeter data, indicate that the global mean sea level has been rising since the late 19th century (see Figure 2.2). The level has risen by an estimated 0.19 m (90% uncertainty range from 0.17 m to 0.21 m), based on a linear trend over the period 1901–2010, and the rate of this sea level rise has likely increased since the early 20th century (Rhein et al., 201362).

Both rising global sea level and increasing ocean heat content are strong evidence of a warming world. Influences of these global changes on the oceans surrounding Canada are detailed in Chapter 7.

2.2.4

Changes in the cryosphere

The cryosphere refers to portions of the Earth with sufficiently cold temperatures for water to freeze, and includes snow, sea ice, land ice (glaciers and ice caps), freshwater ice (lake and river ice), permafrost, and seasonally frozen ground. The IPCC AR5 assessed changes in the cryosphere around the globe and found, with very high confidence, that almost all glaciers worldwide have continued to shrink and that the Greenland (very high confidence) and Antarctic (high confidence) ice sheets have lost mass (based on two decades of data) (Vaughan et al., 201385). The IPCC AR5 reported that, over the period 2003−2009, the greatest losses of glacier ice were from glaciers in Alaska, the Southern Andes, Asian mountains, the periphery of the Greenland ice sheet, and the Canadian Arctic (Vaughan et al., 201385).

There is very high confidence that the extent of Arctic sea ice (both newly formed annual ice and multi-year ice) declined over the period 1979–2012, and that declines occurred in all seasons but were most pronounced in summer and autumn (high confidence). Annual mean sea ice extent in the Arctic very likely declined at a rate of 3.5%–4.1% per decade over this period. Antarctic sea ice extent very likely increased over the same period at a rate of 1.2%–1.8% per decade. The causes of variations in Antarctic sea ice properties and trends remain less well known than those for the Arctic, and the World Meteorological Association (2018) reports that, since the increase was reported in 2013, Antarctic sea ice extent was at or near record low levels throughout 2017. There is also very high confidence that snow cover extent has declined in the Northern Hemisphere (especially in spring) and high confidence that permafrost temperatures have increased in most regions since the 1980s, which is related to regional warming. Overall, the net loss in mass of ice from the global cryosphere (due to changes in glaciers, ice sheets, snow cover, sea ice extent, melt period, and ice thickness) is evidence of strong warming at high latitudes (see Figure 2.2) (Vaughan et al., 201385). Further details on these changes and implications from a Canadian perspective are found in Chapter 5.


Section summary

In summary, these changes documented in the atmosphere, oceans, and cryosphere since the late 19th century (see Figure 2.2), as well as additional changes documented in the IPCC AR5, provide a strong, coherent picture of a warming planet based on multiple, independent lines of evidence. For this reason, warming of the climate system is robustly demonstrated; that is, it is found to be unequivocal.

2.3

Understanding the causes of observed global climate change

Key Message 1

Warming has not been steady over time, as natural climate variability has either added to or subtracted from human-induced warming. Periods of enhanced or reduced warming on decadal timescales are expected, and the factors causing the early 21st century warming slowdown are now better understood. In the last several years, global average temperature has warmed substantially, suggesting that the warming slowdown is now over.

Key Message 2

The heat-trapping effect of atmospheric greenhouse gases is well-established. It is extremely likely that human activities, especially emissions of greenhouse gases, are the main cause of observed warming since the mid-20th century. Natural factors cannot explain this observed warming. Evidence is widespread of a human influence on many other changes in climate as well.

2.3.1

Factors determining global climate

Scientists have understood the basic workings of Earth’s climate for almost 200 years. Studies in the 19th century had already identified the key role of Earth’s atmosphere and of CO2 in raising the temperature of the planet (Fourier, 182717; Tyndall, 185983; Arrhenius, 18961). The fundamentals of the climate system, including factors that determine climate and that can drive climate change, have been included in every major IPCC assessment as foundational background information (IPCC, 199026, 199627, 200128, 200729, 2013a31).

Earth’s long-term climate and average temperature are regulated by a balance between energy arriving from the sun (in the form of shortwave radiation) and energy leaving the Earth (in the form of longwave radiation) (see Box 2.1). When this balance is disrupted in a persistent way, global temperature rises or falls. Factors that disrupt this balance are called “climate drivers” or “climate forcing agents,” evoking their influence in forcing climate toward warmer or cooler conditions. Their effect on Earth’s energy balance is called “radiative forcing,” which is defined as the net change in the energy balance of the Earth system due to an external perturbation. The strength of radiative forcing is measured in units of watts per square metre (W/m2). Positive radiative forcing indicates excess energy is being retained in the climate system — less energy is leaving than is entering the system — leading to a warmer climate, whereas negative radiative forcing indicates more energy is leaving the climate system than entering it, leading to a cooler climate (Le Treut et al., 200745; Cubasch et al., 201310). Radiative forcing provides a useful means of comparing and/or ranking the influence of different climate drivers.

Climate drivers can be either natural or anthropogenic — resulting from human activities. The fact that Earth’s average temperature and climate have varied significantly over geologic time indicates that natural factors have varied in the past. On shorter timescales of decades to centuries, the main climate drivers are changes in solar irradiance, volcanic eruptions, changes in atmospheric composition, and changes to the land surface. The latter two are influenced by human activities. How changes in these climate drivers influence incoming or outgoing radiation is described below.

Solar irradiance, the strength of solar radiation received at the Earth’s surface, fluctuates by a small amount over a solar cycle of approximately 11 years, and these fluctuations can explain global temperature variations of up to approximately 0.1°C between the strongest and weakest parts of the cycle. Small, multi-decadal trends (increasing and decreasing) in solar irradiance can also occur, with similarly small effects on global climate (Masson-Delmotte et al., 201347).

Volcanic eruptions periodically eject large volumes of gases and dust into the stratosphere (upper atmosphere). Sulphate aerosols (tiny airborne particles) that form from these gases reflect solar radiation and thereby induce a cooling effect.7 Since volcanic eruptions are episodic, and sulphate aerosols remain in the stratosphere for only a few years, the cooling effects are short-lived. The global cooling effect of large volcanic eruptions, such as the eruption of Mount Pinatubo in the Philippines in 1991, is clearly evident in the global temperature record (see Section 2.3.3 and Figure 2.9).

Human activities affect Earth’s reflectivity (albedo) by changing the atmospheric composition and the land surface. For example, the combustion of fossil fuels emits a variety of pollutants, in addition to GHGs, into the lower atmosphere, where they form aerosols of various chemical compositions. These aerosols may either reflect or absorb solar radiation and are important drivers of climate change. Aerosols in the lower atmosphere also serve as particles on which water vapour can condense to form clouds (cloud condensation nuclei). Changes in aerosol concentrations can therefore induce changes in cloud properties which, in turn, can affect Earth’s albedo. While the interactions between aerosols and clouds are complex and involve a number of different processes, an increase in aerosol concentration is known to produce brighter clouds, which reflect more solar radiation, inducing a cooling effect. Human alterations of the land surface also tend to increase albedo. When forested lands are cleared for cultivation this tends to produce more reflective land surfaces (Le Treut, H. et al., 200745; Cubasch et al., 201310).

Changes in solar irradiance, volcanic eruptions, and changes in albedo affect Earth’s energy balance by altering the amount of incoming energy available to heat the Earth, but the primary driver of the amount of heat leaving the Earth is changes to the chemical composition of the atmosphere. While the two most abundant gases in Earth’s atmosphere — nitrogen (78%) and oxygen (21%) — are transparent to outgoing longwave radiation, allowing this heat to escape to space, some trace gases absorb longwave radiation, creating the greenhouse effect, and are referred to as GHGs (see Box 2.1). GHGs have both natural and human sources. The main GHGs are water vapour, CO2, methane (CH4), ozone (O3), nitrous oxide (N2O), and groups of synthetic chemicals referred to as halocarbons (see Box 2.2). Changes to the atmospheric concentrations of GHGs affect the transparency of the atmosphere to outgoing heat. Individual GHGs differ in their capacity to trap heat, and most are more powerful GHGs than CO2. However, CO2 is by far the most abundant GHG (Myhre et al., 201352) aside from water vapour. The build-up of atmospheric GHGs has reduced heat loss to space and is therefore a positive radiative forcing, with a warming effect on the climate system (Le Treut et al., 200745; Cubasch et al., 201310).

Determining the relative contribution of different forcing agents perturbing the Earth’s energy balance provides a useful first-order assessment of the causes of observed climate change (see Section 2.2). However, the climate system does not respond in a straightforward way to changes in radiative forcing. An initial perturbation can trigger feedbacks in the climate system that alter the response. These climate feedbacks either amplify the effect of the initial forcing (positive feedback) or dampen it (negative feedback). Therefore, positive feedbacks in the climate system are cause for concern because they amplify the warming from an initial positive forcing, such as increases in atmospheric concentrations of GHGs.

There are a number of feedbacks in the climate system, operating on a wide range of timescales, from hours to centuries (Cubasch et al., 201310; see, in particular, Fig 1.2 and associated text in this reference). Important positive feedbacks that have contributed to warming over the Industrial Era include the water vapour feedback (water vapour, a strong GHG, increases with climate warming) and the snow/ice albedo feedback (snow and ice diminish with climate warming, decreasing surface albedo) (see Box 2.3). There is very high confidence that the net feedback — that is, the sum of the important feedbacks operating on century timescales — is positive, amplifying global warming (Flato et al., 201316; Fahey et al., 201714). Some feedbacks are expected to become increasingly important as climate warming continues this century and beyond. These include feedbacks that change how rapidly the land and ocean can remove CO2 from the atmosphere and those that may lead to additional emissions of CO2 and other GHGs, such as from thawing permafrost (Ciais et al., 20139; Fahey et al., 201714) (see Chapter 5, Section 5.6).


Section summary

In summary, the fundamental drivers of Earth’s climate are therefore well known, as are the radiative properties and heat-trapping effect of GHGs in Earth’s atmosphere. The very first scientific assessment by the IPCC’s Working Group I (IPCC, 199026) began with the statement that “we are certain there is a natural greenhouse effect, which already keeps the Earth warmer than it would otherwise be” and “we are certain that emissions resulting from human activities are substantially increasing the atmospheric concentrations of GHGs and these increases will enhance the greenhouse effect, resulting on average in an additional warming of the Earth’s surface.” The body of scientific knowledge has grown enormously in the years since that assessment, as scientists continue to deepen their understanding of the myriad of processes within components of the climate system, and interactions among these components, that affect the climate system’s response to changes in climate drivers. However, the fundamental relationship between increases in GHGs and climate warming is well established.

2.3.2

Changes in greenhouse gases and radiative forcing over the Industrial Era

The Industrial Era refers to the period in history, beginning around the mid-18th century and continuing today, marked by a rapid increase in industrial activity powered by the combustion of fossil fuels. Burning these carbon-based fuels releases CO2, as well as other gases and pollutants, to the atmosphere. The Industrial Era is recognized as the period when human activity has substantially affected the chemical composition of the atmosphere by increasing the concentration of trace gases, including GHGs (Steffen et al., 200780).

2.3.2.1

Changes in greenhouse gas concentrations over the Industrial Era

GHGs are emitted to the atmosphere from both natural and human sources (see Box 2.2) and are also removed from the atmosphere, primarily through natural processes referred to as natural “sinks.” Atmospheric concentrations of GHGs increase when the rate of emission to the atmosphere exceeds the rate of removal. Even a small annual imbalance, in which emissions exceed removals, can lead to a large build-up of the gas in the atmosphere over time (in the same way that a small annual deficit in a financial budget can lead to a large accumulation of debt over time). Sinks and imbalances differ for different GHGs. CH4 is removed from the atmosphere primarily through photochemical reactions that destroy it chemically. These reactions remove almost as much CH4 each year as is emitted from both natural and human sources, leaving a small annual excess of emissions (Ciais et al., 20139; Saunois et al., 201671). In contrast, only about half of the CO2 emitted from human activities each year is removed from the atmosphere through land sinks (mainly uptake by plants during photosynthesis) and ocean sinks (mainly through CO2 dissolving into the ocean) (Ciais et al., 20139; Le Quéré et al., 201644). The ongoing annual excess of human-emitted CO2 is the cause of the observed rise in atmospheric CO2 concentrations (see FAQ 2.1).

Well-mixed GHGs are those that persist in the atmosphere for a sufficiently long time for concentrations to become relatively uniform throughout the atmosphere. For such substances, emissions anywhere affect atmospheric concentrations everywhere. Global average concentrations of well-mixed GHGs can be determined from measurements taken at only a few monitoring locations around the globe. Canada monitors GHG concentrations at a number of locations, and these data are used, along with those from other monitoring stations, to determine global average GHG concentrations (see Box 2.4).

Long-term records of changes in atmospheric concentrations of the three main well-mixed GHGs — CO2, CH4, and N2O — are compiled from direct atmospheric measurements (beginning in the late 1950s for CO2 and in the late 1970s for CH4 and N2O) and from ice-core measurements, which extend the time period of analysis back hundreds of thousands of years. The evidence clearly shows that the concentrations of these GHGs have increased substantially over the Industrial Era, by 40% for CO2, 150% for CH4, and 20% for N2O (Hartman et al., 201322) (see Figure 2.7). Global concentrations of the main GHGs in 2015 were about 400 parts per million for CO2, 1845 parts per billion for CH4, and 328 parts per billion for N2O (WMO, 201688). These concentrations exceed the highest concentrations during the past 800,000 years recorded in ice cores (Masson-Delmotte, V. et al., 201347).

Figure-2.7

Increases in global greenhouse gas concentrations during the Industrial Era

Line graph with three separate time series covering the period 1750–2018: Global mean atmospheric concentrations of carbon dioxide (yellow and red), methane (aqua and navy), and nitrous oxide (light and dark blue). The data for the period from the mid-18th century to the last decades of the 20th century are from ice cores (dots), whereas those for the most recent 40 years or so are from direct atmospheric measurements from the Cape Grim Observatory (light lines) and from the Canadian site at Alert, Nunavut (dark lines). Concentrations of all three greenhouse gases have increased over time. The rates of increase have been higher since the mid-20th century than in the earlier part of the record.
Figure-2.7

Global mean atmospheric concentrations of carbon dioxide (CO2) (yellow and red), methane (CH4) (aqua and navy), and nitrous oxide (N2O) (light and dark blue), based on data from ice cores (dots) and direct atmospheric measurements from the Cape Grim Observatory, Australia (yellow, aqua and light blue lines) and from the Canadian greenhouse gas monitoring site at Alert, Nunavut (red, navy and dark blue lines).

Source

Climate Research Division, Environment and Climate Change Canada.

2.3.2.2

Changes in radiative forcing over the Industrial Era

As discussed in Section 2.3, changes in atmospheric concentrations of GHGs produce a radiative forcing. The current understanding of the radiative forcing effects of all important climate forcing agents over the Industrial Era is synthesized in Figure 2.8.9 The following discussion highlights major features of Figure 2.8, beginning with those agents causing warming effects, followed by those agents causing cooling effects, and concluding with a summary about the net forcing effects from human activity.


Figure-2.8

Natural and anthropogenic forcing of climate, 1750–2011

A horizontal bar chart showing radiative forcing (and effective radiative forcing) for different forcing agents between 1750 and 2011, along with assessed uncertainties. Radiative forcing is the net change in the energy balance of the Earth system due to an external perturbation, expressed in units of watts per square metre (W/m2). The central axis of the bar chart is 0 W/m2. Bars to the right have positive radiative forcing values (warming effects), whereas bars to the left have negative radiative forcing values (cooling effects). The total anthropogenic forcing is positive, with a best estimate of 2.3 W/m2. The chart shows that the largest contributions to this anthropogenic radiative forcing are positive forcing contributions from carbon dioxide, other well-mixed greenhouse gases, and tropospheric ozone; these are offset by negative forcing contributions from aerosols. The natural forcing from changes in solar irradiance is positive but at least 10 times smaller than the combined anthropogenic forcing. Forçage radiatif (FR; le changement net dans le bilan énergétique du système terrestre en raison d’une perturbation de l’extérieur), selon le changement de concentrations des agents forçant, entre 1750 et 2011, exprimées en watts par mètre carré (W/m2). Les barres hachurées représentent le forçage radiatif (FR), les barres solides représentent le forçage radiatif effectif (FRE), le FR, une fois que l’on tient compte des ajustements rapides des températures atmosphériques, de la vapeur d’eau et des nuages dans la perturbation initiale. Les incertitudes (plage d’incertitude de 5 % à 95 %) sont données pour le FRE (lignes horizontales solides [moustaches]) et le FR (moustaches pointillées). Le nombre total de forçages anthropiques est la somme des contributions du forçage anthropique. Voir la description à la section 2.2.
Figure-2.8

Radiative forcing (RF; the net change in the energy balance of the Earth system due to an external perturbation), based on changes in concentrations of forcing agents, between 1750 and 2011, in units of watts per square metre (W/m2). Hatched bars are radiative forcing (RF), and solid bars are effective radiative forcing (ERF), the RF once rapid adjustments in atmospheric temperatures, water vapour, and clouds to the initial perturbation are accounted for. Uncertainties (5%–95% uncertainty range) are given for ERF (solid horizontal lines [whiskers]) and for RF (dotted whiskers). The total anthropogenic forcing is the sum of the anthropogenic forcing contributions. See description in Section 2.2.

Source

Based on Myhre et al., 2013, Figure 8.15; and IPCC, 2013a, Figure TS.6.

The main warming agents, as indicated by bars extending to the right in Figure 2.8, are CO2, CH4, N2O, and tropospheric ozone, with a few other gases contributing small warming effects globally. These other gases include halocarbons — synthetic industrial chemicals composed of carbon and a halogen, such as chlorofluorocarbons. Together, GHGs have been by far the dominant positive forcing agents over the Industrial Era. CO2 alone accounts for two-thirds of the forcing (1.82 W/m2 [90% uncertainty range from 1.63 W/m2 to 2.01 W/m2]) from all well-mixed GHGs (2.83 W/m2 [90% uncertainty range from 2.54 W/m2 to 3.12 W/m2]). Increases in CH4 concentrations have been the second largest contributor to positive forcing (0.48 W/m2 [90% uncertainty range from 0.43 W/m2 to 0.53 W/m2]). There is very high confidence in these values, because the radiative properties of well-mixed GHGs are well known and because historical concentrations of well-mixed GHGs are also well known from ice cores and direct measurements.

Ozone is not directly emitted but is formed in the lower atmosphere (troposphere) as a result of both natural processes and emissions of air pollutant gases, including CH4. The warming effect of increases in tropospheric ozone is sizeable and known with high confidence. Ozone also forms naturally in the upper atmosphere (stratosphere) as a result of chemical reactions involving ultraviolet radiation and oxygen molecules. Stratospheric ozone levels have decreased as a result of human emissions of ozone-depleting substances such as refrigerants. The resulting cooling effect has slightly offset the warming effect of increases in tropospheric ozone (Myhre et al., 201352).

Cooling effects (as indicated by bars to the left in Figure 2.8) have been driven by human emissions that have increased the levels of aerosols in the atmosphere and by human changes to the land surface that have increased Earth’s surface albedo. Aerosol forcing is divided into two components: direct effects, mainly from absorbing or scattering incoming solar radiation, and indirect effects from aerosol interactions with clouds. Most aerosols (e.g., sulphate and nitrate aerosols) predominantly scatter (reflect) radiation. In contrast, black carbon, an aerosol that is emitted as a result of the incomplete combustion of carbon-based fuels, absorbs radiation. Black carbon is a strong warming agent, although calculating the net effect of black carbon emission sources needs to consider the warming and cooling effects of the other aerosols and gases emitted with it during combustion (Bond et al., 20135; see Chapter 3, Box 3.3). The direct effect of aerosols is therefore composed of a negative forcing (cooling) from most aerosols and a positive forcing (warming) from black carbon, for a net negative forcing of 0.45 W/m2 (90% uncertainty range from a negative forcing of 0.95 W/m2 to a positive forcing of 0.05 W/m2)10 (medium confidence). The total aerosol effect in the atmosphere, including aerosol–cloud interactions, is a strongly negative forcing, estimated with medium confidence to be 0.9 W/m2 (90% uncertainty range from 1.9 W/m2 to 0.1 W/m2). Although there continue to be large uncertainties associated with the magnitude of aerosol forcing, overall there is high confidence that the cooling effect of aerosol forcing has offset a substantial portion of the warming effect of GHG forcing.

There is also high confidence that human-caused land use changes (such as deforestation and conversion of other natural landscapes to managed lands) have had a cooling effect by increasing Earth’s albedo, with a negative forcing of 0.15 W/m2 (90% uncertainty range from 0.25 W/m2 to 0.05 W/m2). However, this has been partially offset by decreases in Earth’s albedo due to black carbon being deposited on snow and ice, darkening the surface and thereby increasing the absorption of solar radiation. Black carbon deposition on snow is estimated to have exerted a small warming effect of 0.04 W/m2 (90% uncertainty range from 0.02 W/m2 to 0.09 W/m2) (low confidence) (Myhre et al., 201352).

The best estimate of total radiative forcing due to human activities is a warming effect of 2.3 W/m2 (90% uncertainty range from 1.1 W/m2 to 3.3 W/m2) over the Industrial Era, composed of a strong positive forcing component from changes in atmospheric concentrations of GHGs, which is partially offset by a negative forcing (cooling effect) from aerosols and land use change. Forcing by CO2 is the single largest contributor to human-caused forcing during the Industrial Era.

This total forcing from human activities can be compared with natural forcing from changes in volcanic eruptions and solar irradiance. During the Industrial Era, irregular volcanic eruptions have had brief cooling effects on global climate. The episodic nature of volcanic eruptions makes a comparison with other forcing agents difficult on a century timescale. Volcanic forcing is, however, well understood to be negative (climate-cooling effect) with the strongest forcing occurring over a limited period of about two years following eruptions (Myhre et al., 201352; see Section 2.3.3). Changes in total solar irradiance over the Industrial Era have caused a small positive forcing of 0.05 W/m2 (90% uncertainty range from 0.00 to 0.10 W/m2) (medium confidence). Consequently, there is very high confidence that, over the Industrial Era, natural forcing accounts for only a small fraction of forcing changes, amounting to less than 10% of the effects of human-caused forcing.


Section summary

In summary, as concluded by the IPCC (IPCC, 2013b32), total radiative forcing is positive and has led to an uptake of energy by the climate system. The largest contribution to total radiative forcing is caused by the increase in the atmospheric concentration of CO2 since the beginning of the Industrial Era. This factor is the dominant driver of global warming and climate change over this period. Natural forcing from solar irradiance changes and volcanic aerosols made only a small contribution throughout the last century, except for brief periods following volcanic eruptions.

2.3.3

Natural climate variability

Even when a strong anthropogenic forcing drives climate change (see Section 2.3.2), signals of climate change may be difficult to detect against a backdrop of a climate system that is naturally chaotic – “noisy”. This chaotic behaviour is due to internal climate variability and natural external forcings, which can be large over short periods (for example, forcing by volcanic eruptions). Internal climate variability, such as El Niño–Southern Oscillation (ENSO) (see Box 2.5), is variability that arises within the climate system, independent of variations in external forcing.

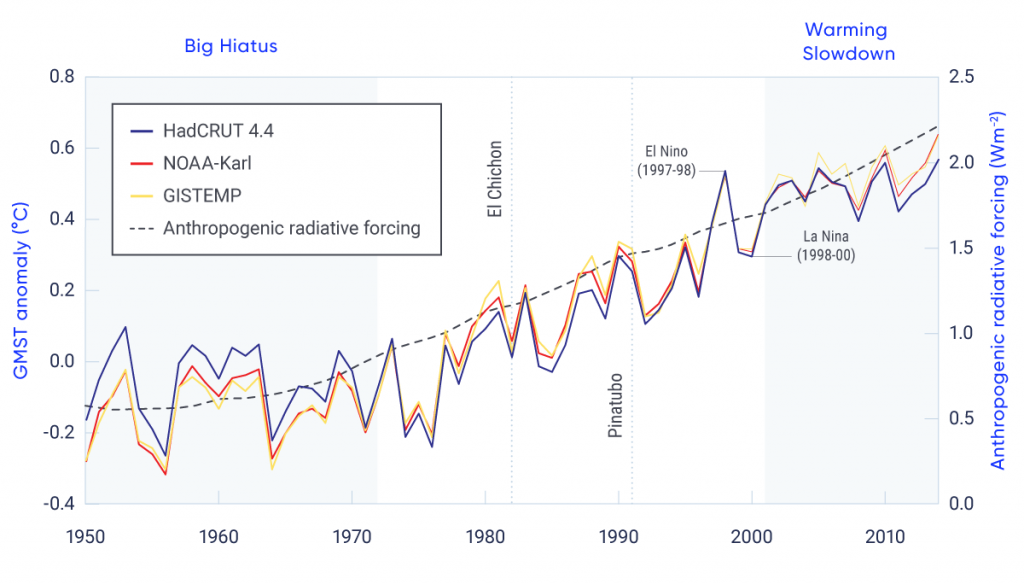
Global mean surface temperature (GMST), as calculated by a linear trend, has increased significantly since the 1880s, especially since the 1950s (see Section 2.2.1). However, the changes in GMST have been far from uniform, with substantial variability among years, decades, and periods spanning several decades. These short-term fluctuations are superimposed on an underlying externally forced trend (see Figure 2.9) (Morice et al., 201251; Karl et al., 201537; Hansen et al., 201021).

Figure-2.9

Annual global mean surface temperature and anthropogenic radiative forcing

Line graph with three lines showing annual global mean surface temperature (GMST; in degrees Celsius, relative to 1961–1990) from three datasets for the period 1950–2012. The lines show short-term fluctuations up and down and increasing GMST over the full period, with close similarity among all three datasets. The “big hiatus” from 1950–1970 and the “warming slowdown” in the early 21st century are indicated. during which the rate of increase in GMST slowed. Also shown are the years in which notable natural forcing events occurred: the volcanic eruptions of El Chichón in 1982 and Pinatubo in 1991 (short-term cooling effects), the strong El Niño of 1997/1998 (short-term warming effect), and the La Niña of 1998–2000 (short-term cooling effect). Also shown as a dashed line is anthropogenic radiative forcing in units of watts per square metre, which is steadily increasing over time.
Figure-2.9

Differences in annual global mean surface temperature (relative to 1961–1990) from three datasets. Radiative forcing due to human activities is shown by the black dashed line.

Source

Adapted from Fyfe et al., 2016.

To analyze the causes of the short-term fluctuations in GMST, we first need to be confident that the observed variability is real and not an artifact, an error introduced by the way the data were collected or analyzed. Long-term GMST time series have been produced by a small number of scientific teams using data collected from around the world. Values are reported as an anomaly: a departure from the average over a reference period (1961–1990 for Figure 2.9). Differences among the estimates are due mainly to differing choices made in processing the underlying raw observations. For example, one estimate (HadCRUT4.4) is an average for only those grid cells where observations exist, whereas the other estimates (NOAA-Karl and GISTEMP) use infilling; if observations are missing for certain locations, they are estimated based on values for neighbouring locations. These estimates of GMST, and others, are routinely updated as errors are identified and adjusted (see Box 4.1). Correcting and updating long-term datasets with new observations as these become available is imperative for tracking global change from year-to-year, decade-to-decade, and century-to-century.

Some of the ups and downs over time shown in Figure 2.9 are associated with the ENSO, the fairly periodic internal variation in sea surface temperatures over the tropical eastern Pacific Ocean, affecting much of the tropics, subtropics, and some areas outside the tropics, including Canada (Box 2.6). The warming phase is known as El Niño and the cooling phase as La Niña. ENSO events can be powerful enough to be recorded as significant signals in GMST. The 1997/1998 El Niño was regarded as one of the most powerful El Niño events in recorded history, resulting in widespread droughts, flooding, and other natural disasters across the globe (Trenberth, 200282). It terminated abruptly in mid-1998 and was followed by a moderate-to-strong La Niña, which lasted until the end of 2000 (Shabbar and Yu, 200974).

Some other ups and downs shown in Figure 2.9 are associated with natural external forcing agents, such as large volcanic eruptions. The 1991 eruption of Mount Pinatubo, in the Philippines, was the second largest terrestrial eruption of the 20th century. It ejected a massive amount of particulate matter into the stratosphere and produced a global layer of sulphuric acid haze. GMST dropped significantly in 1991–1993 (McCormick et al., 199548). Similarly, the 1982 eruption of El Chichón, the largest volcanic eruption in modern Mexican history, ejected a large amount of sulphate aerosols into the stratosphere (Robock and Matson, 198366). The cooling impact of the of El Chichón eruption on GMST from 1982 to 1984 was partly offset by global warming associated with a very strong El Niño event during this time (Robock, 201365).

Naturally occurring variations in GMST, whether internally generated or externally forced, should be viewed in the context of global mean radiative forcing caused by human activities (Fyfe et al., 201618). The combined radiative forcing from human activities has increased over time (see Figure 2.9) (Meinshausen et al., 201150). The periods in Figure 2.9 labelled “big hiatus” and “warming slowdown” correspond to times when the dominant mode of internal decadal variability in the Pacific — the Interdecadal Pacific Oscillation (IPO) — was in its negative (cold) phase. In addition, during the “big hiatus” period, radiative forcing increased relatively slowly, owing to cooling contributions from increasing tropospheric aerosols, as well as stratospheric aerosols from the Mount Agung eruption in 1963 (e.g., Fyfe et al. 201618). In the intervening period, the IPO was in its positive (warm) phase. A given phase, warm or cold, of the IPO typically lasts from 20 to 30 years, much longer than the timescale associated with ENSO. Recent computer models (Meehl et al., 201349; Kosaka and Xie, 201341; England et al., 201413) and studies based on observations (Steinman et al., 201581; Dai et al., 201511) indicate that the IPO plays an important role in changes in GMST over time.

Finally, the “warming slowdown” — a slowdown in the rate of increase of GMST observed over the early 2000s — has been much debated (Karl et al., 201537; Lewandowsky et al., 201546; Rajaratnam et al., 201561). Observations indicate that the rate of global mean surface warming from 2001 to 2015 was significantly less than the rate over the previous 30 years (Fyfe et al., 201618). It is now understood that both internal variability and external forcing contributed to the warming slowdown (Flato et al., 201316; Fyfe et al., 201618; Santer et al., 201768). The contribution from external forcing has been ascribed to: 1) a succession of moderate volcanic eruptions in the early 21st-century (Solomon et al., 201178; Vernier, 201186; Fyfe et al., 201319; Santer et al., 201469; Ridley et al., 201464; Santer et al., 201570); 2) a long and anomalously low solar minimum during the last solar cycle (Kopp and Lean, 201140; Schmidt et al., 201472); 3) increased atmospheric burdens of sulphate aerosols from human activity (Smith et al., 201677); and 4) a decrease in stratospheric water vapour (Solomon et al., 201079). In the last several years, GMST has warmed substantially (e.g., Hu and Fedorov, 201725), with an exceptionally strong ENSO in 2015/2016, suggesting that the warming slowdown is now over.


Section summary

In summary, multiple independent time series of historical GMST, model simulations of historical variability and change, projections of future change, and physical understanding of natural climate variability together indicate that, on decadal timescales, the rates of warming can differ, and periods of reduced or enhanced warming are expected. The IPCC AR5 concluded that both internal variability and external forcing contributed to the warming slowdown, and subsequent research confirms this conclusion and provides improved understanding of the contributions of various factors.

2.3.4

Detection and attribution of observed changes

Establishing the causes of observed changes in climate involves both “detection” and “attribution.” Specifically, “detection” means demonstrating that an observed change is inconsistent with internal climate variability; in effect, this is a task of detecting a signal from the “noise” of background climate variability. “Attribution” means identifying the causes of an observed change in terms of different forcings (Bindoff et al., 20132). The IPCC AR5 included a chapter (Bindoff et al., 20132) assessing the evidence for attributing global and regional changes in a range of variables to GHG increases and other forcings. Understanding the causes of climate change on the global scale is important for understanding the causes of regional climate change discussed in Chapters 4 to 7 of this report. In this subsection, we summarize relevant findings from the IPCC AR5 assessment and more recent findings on global-scale attribution. The relatively new science of attribution of individual events, as opposed to longer-term changes, is discussed in Chapter 4, Section 4.4.

Detection and attribution studies compare observed climate changes with simulations from different types of climate-model experiments: 1) simulations of the response to external forcings of interest; and 2) simulations with no variations in external forcing that show the effect of internal climate variability. Confidence in such analyses is increased by using simulations from multiple climate models developed in centres around the world, and by validating simulated internal variability by comparison with observations. If an observed change is inconsistent with simulated internal variability alone, then a response to external forcing is detected. If the observed change is consistent with model simulations including a particular forcing, such as GHGs, and inconsistent with simulations omitting it, then the observed change is attributed, in part, to that forcing. Since more than one forcing drives trends in climate, an observed change is generally not wholly attributable to variations in one forcing. The sections below summarize attribution of observed changes in each component of the climate system.


Atmosphere and surface

The IPCC AR5 assessed contributions of greenhouse gases, other anthropogenic forcings (mainly aerosols), and natural forcings to the observed trend in GMST that increased approximately 0.6°C from 1951 to 2010, based on several studies that had assessed these trends quantitatively using detection and attribution methods. The trend attributable to combined forcings from human activities (mainly changes in GHGs and aerosols) is likely between 0.6°C and 0.8°C (see Figure 2.10) and extremely likely more than half of the observed increase (Bindoff et al., 20132). Note that, as expected, IPCC AR5 assigned a lower likelihood level to the narrower confidence interval (0.6°C to 0.8°C) and a higher likelihood level to the broader one (greater than half the observed warming). However, when the GMST response to forcings is separated into contributions from GHG forcing and aerosol forcing, uncertainties are larger due to several factors: large uncertainties in aerosol forcing, differences in the simulated responses to these forcings among models, and difficulties in separating the response to GHG increases from the response to aerosol changes. Nonetheless, more than half of the observed increase in GMST was very likely due to the observed human-caused increase in GHG concentrations. The combined effect of aerosols from volcanic eruptions and variations in solar irradiance made only a small contribution to observed trends over this period (statistically, the contribution was not significantly different from zero). Similarly, internal variability made only a small contribution to trends over this period. Warming was also observed over the first half of the 20th century, and this warming was very unlikely to have been due to internal variability alone, but it remains difficult to quantify the contributions of internal variability, anthropogenic forcing, and natural forcing to this warming (Bindoff et al., 20132).

Figure-2.10

Forcings to which global mean warming has been attributed, 1951–2010

A horizontal bar chart showing assessed contributions of different forcing agents to the observed global mean warming trend of approximately 0.6°C over the period 1950 to 2010. Bars to the left of 0.0°C indicate an attributable cooling; bars to the right indicate an attributable warming. The assessed likely contribution to the trend from greenhouse gases is 0.5°C to 0.9°C, shown by a bar extending to the right, and the assessed contribution from other anthropogenic forcings (dominated by aerosols) is −0.6°C to 0.1°C, shown by a bar extending to the left. Global mean warming attributed to the combined effect of all anthropogenic forcings closely matches the observed global mean warming. Estimates of how much global mean warming is attributable to natural forcing (solar irradiance changes and volcanic eruptions) and internal climate variability are centred on 0°C in both cases, with uncertainty ranges of −0.1°C to 0.1°C.
Figure-2.10

IPCC AR5 assessed likely ranges (horizontal lines [whiskers]) and their mid-points (bars) for forcings to which global mean warming over the 1951–2010 period can be attributed: well-mixed greenhouse gases, other anthropogenic forcings (dominated by aerosols), combined anthropogenic forcings, natural forcings, and internal variability. The black bar shows the observed temperature trend (HadCRUT4 dataset) and the associated 5% to 95% uncertainty range (whiskers). Bars to the left of 0.0°C indicate an attributable cooling; bars to the right indicate an attributable warming.

Source

Bindoff et al., 2013, Figure 10.5.

Since the publication of the IPCC AR5, studies have shed further light on aspects of detection and attribution. For example, the influence of observational uncertainty on estimates of the GMST trend attributable to GHGs was found to be small relative to other sources of uncertainty (Jones and Kennedy, 201735). Another study found that considerable differences remain among models in the simulated response to forcings from human activity, particularly to non-GHG forcing (Jones et al., 201636). However, the conclusions of these studies remain consistent with the IPCC AR5 (Bindoff et al., 20132). Even when using a novel approach to detection and attribution (Ribes et al., 201763), the assessed range for the contribution to observed warming trends from human activities remains consistent with the range in the IPCC AR5 (Bindoff et al., 20132).

The IPCC AR5 also assessed that it was likely that forcings from human activity have contributed to warming of the lower atmosphere (troposphere) since 1961 (Bindoff et al., 20132). Recent research continues to support this assessment. A new study found that apparent differences between the rate of warming of the lower atmosphere in climate models and in satellite observations since 1979 are smaller than previously reported (Santer et al., 201768).

There is medium confidence that human activities have contributed to observed increases in atmospheric specific humidity and to global-scale changes in precipitation over land since 1950, including increases in the Northern Hemisphere at mid- to high latitudes (Bindoff et al., 20132). Large uncertainties in observations and models, and large internal variability in precipitation, precluded greater confidence. Research since the IPCC AR5 (e.g., Hegerl et al., 201524; Polson et al., 201660) has examined sources of uncertainty in more detail, but the overall conclusions remain consistent with those of IPCC AR5 (Bindoff et al., 20132).


Ocean

Several aspects of observed global-scale change in the oceans have been attributed to human activity. In particular, it is very likely that human-caused forcing made a substantial contribution to upper ocean warming since 1970 and to a rise in global mean sea level since the 1970s (Bindoff et al., 20132). It is very likely that human-caused increases in CO2 have driven acidification of ocean surface waters, through uptake of CO2 from the atmosphere, decreasing pH by 0.0014 to 0.0024 per year (see Chapter 7, Section 7.6.1). Recent research continues to support the attribution of ocean warming and sea level rise to human influence (e.g., Slangen et al., 201476; Weller et al., 201687), with new estimates of the heat content of the upper ocean showing a larger warming trend than that assessed in the IPCC AR5 (Durack et al., 201412).


Cryosphere

It is very likely that human-caused forcings have contributed to Arctic sea ice loss since 1979 (Bindoff et al., 20132). This conclusion was based on model simulations, which were able to reproduce the observed decline only when including human-caused forcings. There is low confidence in the understanding of an observed increase in the extent of Antarctic sea ice. However, since that assessment was made in 2013, Antarctic sea ice extent has decreased, with September 2017 sea ice extent being the second lowest on record (NOAA, 201755). It is likely that human-caused forcing contributed to the observed surface melting of the Greenland Ice Sheet since 1993 and to the observed retreat of glaciers since the 1960s, but there is low confidence in attribution of the causes of mass loss from the Antarctic Ice Sheet. There was likely a contribution of human activity to observed reductions in Northern Hemisphere snow cover since 1970 (Bindoff et al., 20132). New research strengthens the evidence for attribution of the decrease in Arctic sea ice extent (e.g., Kirchmeier-Young et al., 201739), and Northern Hemisphere snow cover (e.g., Najafi et al., 201653) to human influence.


Extremes

On the global scale, it is very likely that human-caused forcing has contributed to observed changes in the frequency of daily temperature extremes since 1950, including increases in hot extremes and decreases in cold extremes (Bindoff et al., 20132). For regions with sufficient observations, there is medium confidence that human-caused forcing has contributed to increased intensity of heavy precipitation events since 1950. New research further strengthens the evidence for attribution of changes in temperature and precipitation extremes to human influence (Zhang et al., 201391; Kim et al., 201638; Fischer and Knutti, 201515; Christidis and Stott, 20168).


Section summary

In summary, the IPCC AR5 assessment (Bindoff et al., 20132) that it is extremely likely that human activities are the main cause of the observed warming since the mid-20th century was supported by robust evidence from multiple studies, and has been further supported by additional studies since 2013. Evidence for detectable human influence on other climate variables in the atmosphere, ocean, and cryosphere was very strong at the time of the publication of the IPCC AR5 (Bindoff et al., 20132), and evidence has continued to accumulate since then.

Footnotes

  1. This report uses the same calibrated uncertainty language as in the IPCC’s Fifth Assessment Report. The following five terms are used to express assessed levels of confidence in findings based on the availability, quality and level of agreement of the evidence: very low, low, medium, high, very high. The following terms are used to express
  2. https://unfccc.int/process-and-meetings/the-paris-agreement/the-paris-agreement
  3. Weather extremes occur over shorter timescales (e.g., short-duration heavy precipitation event) than climate extremes (e.g., drought). For further details on differentiating weather and climate extremes, refer to IPCC (2012).
  4. Warm days and nights and cold days and nights are defined from daily temperatures as days when daily maximum (daytime) and minimum (nighttime) temperatures are above the 90th (warm) or below the 10th (cold) percentile.
  5. Heatwaves and warm spells are defined variously throughout the literature but refer to multi-day periods with high temperature extremes.
  6. The troposphere is the lowest layer of the Earth’s atmosphere, extending from the surface to an average altitude of 10 km in the mid-latitudes (this altitude varies by season and location).
  7. Volcanoes also emit CO2, a GHG, but the climate effect of volcanic CO2 emissions is small (Myhre et al., 2013).
  8. 1 petagram (Pg) = 1015 grams. 1 petagram is equivalent to 1 billion metric tonnes (1 gigatonne). In the atmosphere, the mass of carbon is directly related to the abundance of CO2 per unit volume, measured in parts per million (ppm).
  9. The term “effective radiative forcing” was introduced in the IPCC Fifth Assessment Report to better quantify the impact of forcing agents by accounting for rapid adjustments in the climate system to an initial radiative forcing (Myhre et al., 2013). For well-mixed GHGs, radiative forcing (RF) and effective radiative forcing (ERF) values are similar, whereas for aerosols from human activity, these values are significantly different, and ERF is considered the better indicator. In this section, we use the term RF, but these terms are differentiated in Figure 2.8, on which the text is based
  10. This value is the effective radiative forcing (ERF) from direct effects of aerosols, accounting for rapid adjustments of the climate system (see Figure 2.8).

References

  1. Arrhenius, S. (1896): On the influence of carbonic acid in the air on the temperature upon the temperature of the ground; The London, Edinburgh and Dublin Philosophical Magazine and Journal of Science, v. 4, p. 237–276.
  2. Bindoff, N.L., Stott, P.A., AchutaRao, K.M., Allen, M.R., Gillett, N., Gutzler, D., Hansingo, K., Hegerl, G., Hu, Y., Jain, S., Mokhov, I.I., Overland, J., Perlwitz, J., Sebbari, R. and Zhang, X. (2013): Detection and Attribution of Climate Change: from Global to Regional; in Climate Change 2013: The Physical Science Basis (Contribution of Working Group I to the Fifth Assessment Report of the Intergovernmental Panel on Climate Change), (ed.) T.F. Stocker, D. Qin, G.-K. Plattner, M. Tignor, S.K. Allen, J. Boschung, A. Nauels, Y. Xia, V. Bex and P.M. Midgley; Cambridge University Press, Cambridge, United Kingdom and New York, NY, USA, pp. 867–952. doi:10.1017/CBO9781107415324.022
  3. Blunden, J. and Arndt, D.S. (ed.) (2016): State of the Climate in 2015; Bulletin of the American Meteorological Society, v. 97, p. S1–S275. doi:10.1175/2016BAMSStateoftheClimate.1
  4. Blunden, J. and Arndt, D.S. (ed.) (2017): State of the Climate in 2016; Bulletin of the American Meteorological Society, v. 98, p. Si–S277. doi:10.1175/2017BAMSStateoftheClimate.1
  5. Bond, T.C., Doherty, S.J., Fahey, D.W., Forster, P.M., Berntsen, T., DeAngelo, B.J., Flanner, M.G., Ghan, S., Kärcher, B., Koch, D., Kinne, S., Kondo, Y., Quinn, P.K., Sarofim, M. C., Schultz, M.G., Schulz, M., Venkataraman, C., Zhang, H., Zhang, S., Bellouin, N., Guttikunda, S.K., Hopke, P.K., Jacobson, M.Z., Kaiser, J.W., Klimont, Z., Lohmann, U., Schwarz, J.P., Shindell, D., Storelvmo, T., Warren, S.G. and Zender, C.S. (2013): Bounding the role of black carbon in the climate system: A scientific assessment; Journal of Geophysical Research: Atmosphere, v. 118, p. 5380–5552. doi:10.1002/jgrd.50171
  6. Boucher, O., Randall, D., Artaxo, P., Bretherton, C., Feingold, G., Forster, P., Kerminen, V.-M., Kondo, Y., Liao, H., Lohmann, U., Rasch, P., Satheesh, S.K., Sherwood, S., Stevens, B. and Zhang, X.Y. (2013): Clouds and Aerosols; in Climate Change 2013: The Physical Science Basis (Contribution of Working Group I to the Fifth Assessment Report of the Intergovernmental Panel on Climate Change), (ed.) T.F. Stocker, D. Qin, G.-K. Plattner, M. Tignor, S.K. Allen, J. Boschung, A. Nauels, Y. Xia, V. Bex and P.M. Midgley; Cambridge University Press, Cambridge, United Kingdom and New York, NY, USA, p. 571–658. doi:10.1017/CBO9781107415324.016
  7. Chen, J.M., Chen, B., Higuchi, K., Liu, J. Chan, D., Worthy, D., Tans, P. and Blacks, A. (2006): Boreal ecosystems sequestered more carbon in warmer years; Geophysical Research Letters, v. 33. doi:10.1029/2006GL025919
  8. Christidis, N. and Stott, P. (2016): Attribution analyses of temperature extremes using a set of 16 indices; Weather and Climate Extremes, v. 14, p. 24–35. doi:10.1016/j.wace.2016.10.003
  9. Ciais, P., Sabine, C., Bala, G., Bopp, L., Brovkin, V., Canadell, J., Chhabra, A., DeFries, R., Galloway, J., Heimann, M., Jones, C., Le Quéré, C., Myneni, R.B., Piao, S. and Thornton, P. (2013): Carbon and Other Biogeochemical Cycles; in Climate Change 2013: The Physical Science Basis(Contribution of Working Group I to the Fifth Assessment Report of the Intergovernmental Panel on Climate Change), (ed.) T.F. Stocker, D. Qin, G.-K. Plattner, M. Tignor,S.K. Allen, J. Bosc hung, A. Nauels, Y. Xia, V. Bex and P.M. Midgley; Cambridge University Press, Cambridge, United Kingdom and New York, NY, USA, p. 465–570. doi:10.1017/CBO9781107415324.015
  10. Cubasch, U., Wuebbles, D., Chen, D., Facchini, M.C., Frame, D., Mahowald, N. and Winther, J.-G. (2013): Introduction; in Climate Change 2013: The Physical Science Basis (Contribution of Working Group I to the Fifth Assessment Report of the Intergovernmental Panel on Climate Change), (ed.) T.F. Stocker, D. Qin, G.-K. Plattner, M. Tignor, S.K. Allen, J. Boschung, A. Nauels, Y. Xia, V. Bex and P.M. Midgley; Cambridge University Press, Cambridge, United Kingdom and New York, NY, USA, p. 119–158. doi:10.1017/CBO9781107415324.007
  11. Dai, A., Fyfe, J.C., Xie, S.-P. and Dai, X. (2015): Decadal modulation of global surface temperature by internal climate variability; Nature Climate Change, v. 5, p. 555–559.
  12. Durack, P.J., Gleckler, P.J., Landerer, F.W. and Taylor, K.E. (2014): Quantifying underestimates of long-term upper-ocean warming; Nature Climate Change, v. 4, p. 999–1005.
  13. England, M.H., McGregor, S., Spence, P., Meehl, G.A., Timmermann, A., Cai, W., Sen Gupta, A., McPhaden, M.J., Purich, A. and Santoso, A. (2014): Recent intensification of wind-driven circulation in the Pacific and the ongoing warming hiatus; Nature Climate Change, v. 4, p. 222–227.
  14. Fahey, D.W, Doherty, S.J., Hibbard, K.A., Romanou, A. and Taylor, P.C. (2017): Physical drivers of climate change; in Climate Science Special Report: Fourth National Climate Assessment, Volume 1, (ed.) D.J. Wuebbles, D.W. Fahey, K.A. Hibbard, D.J. Dokken, B.C. Stewart, T.K. Maycock; U.S. Global Change Research Program, Washington, DC, USA, p. 73–113. doi: 10.7930/J0513WCR
  15. Fischer, E.M. and Knutti, R. (2015): Anthropogenic contribution to global occurrence of heavy-precipitation and high-temperature extremes; Nature Climate Change, v. 5, p. 560–564.
  16. Flato, G., Marotzke, J., Abiodun, B., Braconnot, P., Chou, S.C., Collins, W., Cox, P., Driouech, F., Emori, S., Eyring, V., Forest, C., Gleckler, P., Guilyardi, E., Jakob, C., Kattsov, V., Reason, C. and Rummukainen, M. (2013): Evaluation of Climate Models; in Climate Change 2013: The Physical Science Basis (Contribution of Working Group I to the Fifth Assessment Report of the Intergovernmental Panel on Climate Change), (ed.) T.F. Stocker, D. Qin, G.-K. Plattner, M. Tignor, S.K. Allen, J. Boschung, A. Nauels, Y. Xia, V. Bex and P.M. Midgley; Cambridge University Press, Cambridge, United Kingdom and New York, NY, USA, p. 741–866.
  17. Fourier, J.-B. J. (1827): Mémoires sur les températures du globe terrestre et des espace planétaires [On the temperatures of the terrestrial sphere and interplanetary space] (trans. 2004); R.T. Pierrehumbert, <https://geosci.uchicago.edu/~rtp1/papers/Fourier1827Trans.pdf> [February 2018].
  18. Fyfe, J.C., Meehl, G.A., England, M.H., Mann, M.E., Santer, B.D., Flato, G.M., Hawkins, E., Gillett, N.P., Xie, S.-P., Kosaka, Y. and Swart, N.C. (2016): Making sense of the early-2000s global warming slowdown; Nature Climate Change, v. 6, p. 224–228.
  19. Fyfe, J.C., von Salzen, K., Cole, J.N.S., Gillett, N.P. and Vernier, J-P. (2013): Surface response to stratospheric aerosol changes in a coupled atmosphere–ocean model; Geophysical Research Letters, v. 40, p. 584–588.
  20. Hadden, D. and Grelle, D. (2016): Changing temperature response of respiration turns boreal forest from carbon sink into carbon source; Agricultural and Forest Meteorology, v. 223, p. 30–38.
  21. Hansen, J., Ruedy, R., Sato, M. and Lo, K. (2010): Global surface temperature change; Review of Geophysics, v. 48. doi:10.1029/2010RG000345
  22. Hartmann, D.L., Klein Tank, A.M.G., Rusticucci, M., Alexander, L.V., Brönnimann, S., Charabi, Y., Dentener, F.J., Dlugokencky, E.J., Easterling, D.R., Kaplan, A., Soden, B.J., Thorne, P.W., Wild, M. and Zhai, P.M. (2013): Observations: Atmosphere and Surface; in Climate Change 2013: The Physical Science Basis (Contribution of Working Group I to the Fifth Assessment Report of the Intergovernmental Panel on Climate Change), (ed.) T.F. Stocker, D. Qin, G.-K. Plattner, M. Tignor, S.K. Allen, J. Boschung, A. Nauels, Y. Xia, V. Bex and P.M. Midgley; Cambridge University Press, Cambridge, United Kingdom and New York, NY, USA, p. 159–254. doi:10.1017/CBO9781107415324.008
  23. Hawkins, E., Ortega, P., Suckling, E., Schurer, A., Hergel, G., Jones, P., Joshi, M., Osborn, T.J., Masson-Delmotte, V., Mignot, J., Thorne, P. and Van Oldenborgh, G.J. (2017): Estimating changes in global temperature since the pre-industrial period; Bulletin of the American Meteorological Society, v. 98, p. 1841–1856. doi:10.1175/BAMS-D-16-0007.1
  24. Hegerl, G.C., Black, E., Allan, R.P., Ingram, W.J., Polson, D., Trenberth, K.E., Chadwick, R.S., Arkin, P.A., Sarojini, B.B., Becker, A., Dai, A., Durack, P.J., Easterling, D., Fowler, H.J., Kendon, E.J., Huffman, G.J., Liu, C., Marsh, R., New, M., Osborn, T.J., Skliris, N., Stott, P.A., Vidale, P., Wijffels, S.E., Wilcox, L.J., Willett, K.M., and Zhang, X. (2015): Challenges in quantifying changes in the global water cycle; Bulletin of the American Meteorological Society, v. 96, p. 1097–1115.
  25. Hu, A. and Fedorov, A.V. (2017): The extreme El Niño of 2015–2016 and the end of global warming hiatus; Geophysical Research Letters, v. 44, p. 3816–3824.
  26. IPCC [Intergovernmental Panel on Climate Change] (1990): Climate Change: The IPCC Scientific Assessment (1990) (Report prepared for Intergovernmental Panel on Climate Change by Working Group I), (ed.) J.T. Houghton, G.J. Jenkins and J.J. Ephraums; Cambridge University Press, Cambridge, United Kingdom, New York, NY, USA and Melbourne, Australia, 410 p.
  27. IPCC [Intergovernmental Panel on Climate Change] (1996): Climate Change 1995: The Science of Climate Change (Contribution of Working Group I to the Second Assessment Report of the Intergovernmental Panel on Climate Change), (ed.) J.T. Houghton, L.G. Meira Filho, B.A. Callander, N. Harris, A. Kattenberg, and K. Maskell; Cambridge University Press, Cambridge, United Kingdom and New York, NY, USA.
  28. IPCC [Intergovernmental Panel on Climate Change] (2001): Climate Change 2001: The Scientific Basis (Contribution of Working Group I to the Third Assessment Report of the Intergovernmental Panel on Climate Change), (ed.) J.T. Houghton, Y. Ding, D.J. Griggs, M. Noguer, P.J. van der Linden, X. Dai, K. Maskell and C.A. Johnson; Cambridge University Press, Cambridge, United Kingdom and New York, NY, USA, 881 p.
  29. IPCC [Intergovernmental Panel on Climate Change] (2007): Climate Change 2007: The Physical Science Basis (Contribution of Working Group I to the Fourth Assessment Report of the Intergovernmental Panel on Climate Change), (ed.) S. Solomon, D. Qin,M. Manning, Z. Chen, M. Marquis, K.B. Averyt, M. Tignor and H.L. Miller; Cambridge University Press, Cambridge, United Kingdom and New York, NY, USA, 996 p.
  30. IPCC [Intergovernmental Panel on Climate Change] (2012): Managing the Risks of Extreme Events and Disasters to Advance Climate Change Adaptation (A Special Report of Working Groups I and II of the Intergovernmental Panel on Climate Change), (ed.) C.B Field, V. Barros, T.F. Stocker, D. Qin, D.J. Dokken, K.L. Ebi, M.D. Mastrandrea, K.J. Mach, G.-K. PLattner, S.K. Allen, M. Tignor, and P.M. Midgley; Cambridge University Press, Cambridge, United Kingdom, 582 p.
  31. IPCC [Intergovernmental Panel on Climate Change] (2013a): Climate Change 2013: The Physical Science Basis (Contribution of Working Group I to the Fifth Assessment Report of the Intergovernmental Panel on Climate Change), (ed.) T.F. Stocker, D. Qin, G.-K. Plattner, M. Tignor, S.K. Allen, J. Boschung, A. Nauels, Y. Xia, V. Bex and P.M. Midgley; Cambridge University Press, Cambridge, United Kingdom and New York, NY, USA, 1535 p. doi:10.1017/CBO9781107415324
  32. IPCC [Intergovernmental Panel on Climate Change] (2013b): Summary for Policymakers; in Climate Change 2013: The Physical Science Basis (Contribution of Working Group I to the Fifth Assessment Report of the Intergovernmental Panel on Climate Change), (ed.) T.F. Stocker, D. Qin, G.-K. Plattner, M. Tignor, S.K. Allen, J. Boschung, A. Nauels, Y. Xia, V. Bex and P.M. Midgley; Cambridge University Press, Cambridge, United Kingdom and New York, NY, USA, p. 1–30. doi:10.1017/CBO9781107415324.004
  33. IPCC [Intergovernmental Panel on Climate Change] (2013c): Annex III: Glossary, (ed.) Planton, S.; in Climate Change 2013: The Physical Science Basis (Contribution of Working Group I to the Fifth Assessment Report of the Intergovernmental Panel on Climate Change), (ed.) T.F. Stocker, D. Qin, G.-K. Plattner, M. Tignor, S.K. Allen, J. Boschung, A. Nauels, Y. Xia, V. Bex and P.M. Midgley; Cambridge University Press, Cambridge, United Kingdom and New York, NY, USA, p. 1–30. doi:10.1017/CBO9781107415324.004
  34. Jansen, E., Overpeck, J., Briffa, K.R., Duplessy, J-C., Joos, F., Masson-Delmotte, V., Olago, D., Otto-Bliesner, B., Peltier, W.R., Rahmstorf,S., Ramesh, R., Raynaud, D., Rind, D., Solomina, O., Villalba R. and Zhang, D. (2007): Palaeoclimate; in Climate Change 2007: The Physical Science Basis (Contribution of Working Group I to the Fourth Assessment Report of the Intergovernmental Panel on Climate Change), (ed.) S. Solomon, D. Qin,M. Manning, Z. Chen, M. Marquis, K.B. Averyt, M. Tignor and H.L. Miller; Cambridge University Press, Cambridge, United Kingdom and New York, NY, USA, 996 p.
  35. Jones, G.S. and Kennedy, J.J. (2017): Sensitivity of attribution of anthropogenic near-surface warming to observational uncertainty; Journal of Climate, v. 30, p. 4677–4691.
  36. Jones, G.S., Stott, P.A. and Mitchell, J.F. (2016): Uncertainties in the attribution of greenhouse gas warming and implications for climate prediction; Journal of Geophysical Research: Atmospheres, v. 121, p. 6969–6992.
  37. Karl, T.R., Arguez, A., Huang, B., Lawrimore, J.H., McMahon, J.R., Menne, M.J., Peterson, T.C., Vose, R.S. and Zhang, H.-M. (2015): Possible artifacts of data biases in the recent global surface warming hiatus; Science, v. 348, p. 1469–1472.
  38. Kim, Y.H., Min, S.K., Zhang, X., Zwiers, F., Alexander, L.V., Donat, M.G. and Tung, Y.S. (2016): Attribution of extreme temperature changes during 1951–2010; Climate Dynamics, v. 46, p. 1769–1782.
  39. Kirchmeier-Young, M.C., Zwiers, F.W. and Gillett, N.P. (2017): Attribution of extreme events in Arctic Sea ice extent; Journal of Climate, v. 30, p. 553–571.
  40. Kopp, G. and Lean, J.L. (2011): A new, lower value of total solar irradiance: evidence and climate significance; Geophysical Research Letters, v. 38.
  41. Kosaka, Y. and Xie, S.-P. (2013): Recent global-warming hiatus tied to equatorial Pacific surface cooling; Nature, v. 501, p. 403–407.
  42. Kurz, W.A., Shaw, C.H., Boisvenue, C., Stinson, G., Metsaranta, J., Leckie, D., Dyk, A., Smyth, C., Neilson, E.T. (2013): Carbon in Canada’s boreal forest – a synthesis; Environmental Reviews, v. 21, p. 260–292.
  43. Lacis, A., Schmidt, G., Rind, D. and Ruedy, R. (2010): Atmospheric CO2: principal control knob governing Earth’s temperature; Science, v. 330, p. 356–359.
  44. Le Quéré, C.L., Andrew, R.M., Canadell, J.G., Sitch, S., Korsbakken,J.I., Peters,G.P., Manning, A.C., Boden, T.A., Tans, P.P., Houghton, R.A., Keeling, R.F., Alin, S., Andrews, O.D., Anthoni, P., Barbero, L., Bopp, L., Chevallier, F., Chini, L.P., Ciais, P., Currie, K., Delire, C., Doney, S.C., Friedlingstein, P., Gkritzalis, T., Harris, I., Hauck, J., Haverd, V., Hoppema, M., Klein Goldewijk, K., Jain, A.K., Kato, E., Körtzinger, A., Landschützer, P., Lefèvre, N., Lenton, A., Lienert, S., Lombardozzi, D., Melton, J.R., Metzl, N., Millero, F., Monteiro, P.M.S., Munro, D.R., Nabel, J.E.M.S., Nakaoka, S.-I., O’Brien, K., Olsen, A., Omar, A.M., Ono, T., Pierrot, D., Poulter, B., Rödenbeck, B., Salisbury, J., Schuster, U., Schwinger, J., Séférian, R., Skjelvan, I., Stocker, B.D., Sutton, A.J., Takahashi, T., Tian, H., Tilbrook, B., van der Laan-Luijkx, I.T., van der Werf, G.R., Viovy, N., Walker, A.P., Wiltshire, A.J. and Zaehle, S. (2016): Global carbon budget 2016; Earth System Science Data, v. 8, p. 605–649.
  45. Le Treut, H., Somerville, R., Cubasch, U., Ding, Y., Mauritzen, C., Mokssit, A., Peterson, T. and Prather, M. (2007): Historical Overview of Climate Change; in Climate Change 2007: The Physical Science Basis (Contribution of Working Group I to the Fourth Assessment Report of the Intergovernmental Panel on Climate Change), (ed.) S. Solomon, D. Qin, M. Manning, Z. Chen, M. Marquis, K.B. Averyt, M. Tignor and H.L. Miller; Cambridge University Press, Cambridge, United Kingdom and New York, NY, USA, p. 93–127.
  46. Lewandowsky, S., Risbey, J.S. and Oreskes, N. (2015): On the definition and identifiability of the alleged “hiatus” in global warming; Scientific Reports, v.5, article number: 16784. doi:10.1038/srep16784
  47. Masson-Delmotte, V., Schulz, M., Abe-Ouchi, A., Beer, J., Ganopolski, A., González Rouco, J.F., Jansen, E., Lambeck, K., Luterbacher, J., Naish, T., Osborn, T., Otto-Bliesner, B., Quinn, T., Ramesh, R., Rojas, M., Shao, X. and Timmermann, A. (2013): Information from Paleoclimate Archives; in Climate Change 2013: The Physical Science Basis (Contribution of Working Group I to the Fifth Assessment Report of the Intergovernmental Panel on Climate Change), (ed.) T.F. Stocker, D. Qin, G.-K. Plattner, M. Tignor, S.K. Allen, J. Boschung, A. Nauels, Y. Xia, V. Bex and P.M. Midgley; Cambridge University Press, Cambridge, United Kingdom and New York, NY, USA, p. 383–464. doi:10.1017/CBO9781107415324.013
  48. McCormick, L.M.P, Thomason, W. and Trepte, C.R. (1995): Atmospheric effects of the Mt Pinatubo eruption; Nature, v. 373, p. 399–404.
  49. Meehl, G.A., Hu, A., Arblaster, J.M., Fasullo, J. and Trenberth, K.E. (2013): Externally forced and internally generated decadal climate variability associated with the Interdecadal Pacific Oscillation; Journal of Climate, v. 26, p. 7298–7301, doi:10.1175/JCLI-D-12-00548.1.
  50. Meinshausen, M., Smith, S.J., Calvin, K., Daniel, J.S., Kainuma, M.L.T., Lamarque, J-F., Matsumoto K., Montzka, S.A., Raper, S.C.B., Riahi, K., Thomson, A., Velders, G.J.M., van Vuuren, D.P.P. (2011): The RCP greenhouse gas concentrations and their extensions from 1765 to 2300; Climatic Change, v. 109, p. 213–241, doi:10.1007/s10584-011-0156-z.
  51. Morice, C.P., Kennedy, J.J., Rayner, N.A. and Jones, P.D. (2012): Quantifying uncertainties in global and regional temperature change using an ensemble of observational estimates: The HadCRUT4 dataset; Journal of Geophysical Research Atmospheres, v. 117. doi:10.1029/2011JD017187
  52. Myhre, G., Shindell, D., Bréon, F.-M., Collins, W., Fuglestvedt, J., Huang, J., Koch, D., Lamarque, J.-F., Lee, D., Mendoza, D., Nakajima, T., Robock, A., Stephens, G., Takemura, T. and Zhang, H. (2013): Anthropogenic and Natural Radiative Forcing; in Climate Change 2013: The Physical Science Basis (Contribution of Working Group I to the Fifth Assessment Report of the Intergovernmental Panel on Climate Change), (ed.) T.F. Stocker, D. Qin, G.-K. Plattner, M. Tignor, S.K. Allen, J. Boschung, A. Nauels, Y. Xia, V. Bex and P.M. Midgley; Cambridge University Press, Cambridge, United Kingdom and New York, NY, USA, p. 659–740. doi:10.1017/ CBO9781107415324.018
  53. Najafi, M.R., Zwiers, F.W. and Gillett, N.P. (2016): Attribution of the spring snow cover extent decline in the Northern Hemisphere, Eurasia and North America to anthropogenic influence; Climatic Change, v. 136, p. 571–586.
  54. National Academy of Sciences and the Royal Society (2014): Climate Change: Evidence and Causes; Washington, DC, The National Academies Press. doi:10.17226/18730
  55. NOAA [National Centers for Environmental Information] (2017): State of the Climate: Global Snow and Ice for September 2017; National Oceanic and Atmospheric Administration (NOAA), <https://www.ncdc.noaa.gov/sotc/global-snow/201709> [January 2018].
  56. Overland, J., Walsh, J. and Kattsov, V. (2017). Trends and Feedbacks; in Snow, Water, Ice and Permafrost in the Arctic (SWIPA); Arctic Monitoring and Assessment Programme (AMAP), Oslo, Norway, p. 9–24.
  57. Perovich, D.K., Nghiem, S.V., Markus, T. and Schweiger, A. (2007): Seasonal evolution and interannual variability of the local solar energy absorbed by the Arctic sea ice-ocean system; Journal of Geophysical Research, v. 112.
  58. Perovich, D.K., Roesler, C.S., and Pegau, W.S. (1998): Variability in Arctic sea ice optical properties; Journal of Geophysical Research, v. 103, p. 1193–1208.
  59. Pithan, F. and Mauritsen, T. (2014): Arctic amplification dominated by temperature feedbacks in contemporary climate models; Nature Geoscience, v. 7, p. 181–184.
  60. Polson, D., Hegerl, G.C. and Solomon, S. (2016): Precipitation sensitivity to warming estimated from long island records; Environmental Research Letters, v. 11.
  61. Rajaratnam, B., Romano, J., Tsiang, M. and Diffenbaugh, N.S. (2015): Debunking the climate hiatus; Climatic Change, v. 133, p. 129–140.
  62. Rhein, M., Rintoul, S.R., Aoki, S., Campos, E., Chambers, D., Feely, R.A., Gulev, S., Johnson, G.C., Josey, S.A., Kostianoy, A., Mauritzen, C., Roemmich, D., Talley, L.D. and Wang, F. (2013): Observations: Ocean; in Climate Change 2013: The Physical Science Basis (Contribution of Working Group I to the Fifth Assessment Report of the Intergovernmental Panel on Climate Change), (ed.) T.F. Stocker, D. Qin, G.–K. Plattner, M. Tignor, S.K. Allen, J. Boschung, A. Nauels, Y. Xia, V. Bex and P.M. Midgley; Cambridge University Press, Cambridge, United Kingdom and New York, NY, USA, p. 255–316. doi:10.1017/CBO9781107415324.010
  63. Ribes, A., Zwiers, F.W., Azaïs, J.M. and Naveau, P. (2017): A new statistical approach to climate change detection and attribution; Climate Dynamics, v. 48, p. 367–386.
  64. Ridley, D.A., Solomon, S., Barnes, J. E, Burlakov, V.D., Deshler, T., Dolgii, S.I., Herber, A.B., Nagai, T., Neely III, R.R., Nevzorov, A.V., Ritter, C., Sakai, T., Santer, B.D., Sato, M., Schmidt, A., Uchino, O., Vernier, J.P. (2014): Total volcanic stratospheric aerosol optical depths and implications for global climate change; Geophysical Research Letters, v. 41, p. 7763–7769. doi:10.1002/2014GL061541.
  65. Robock, A. (2013): Climate model simulations of the effects of the El Chichón eruption; Geofísica Internacional, v. 23, p. 403–414.
  66. Robock, A. and Matson, M. (1983): Circumglobal transport of the El Chichón volcanic dust cloud; Science, v. 221, p. 195–197.
  67. Salinger, M.J., Renwick, J.A. and Mullan, A.B. (2001): Interdecadal Pacific Oscillation and South Pacific Climate; International Journal of Climatology, v. 21, p. 1705–1721.
  68. Santer, B.D., Fyfe, J.C., Pallotta, G., Flato, G.M., Meehl, G.A., England, M.H., Hawkins, E., Mann, M.E., Painter, J.F., Bonfils, C. and Cvijanovic, I. (2017): Causes of differences in model and satellite tropospheric warming rates; Nature Geoscience, v. 10, p. 478–485.
  69. Santer, B.D., Solomon, S., Bonfils, C., Zelinka, M.D., Painter, J.F., Beltran, F., Fyfe, J.C., Johannesson, G., Mears, C., Ridley, D.A., Vernier, J.-P. and Wentz, F.J. (2014): Volcanic contribution to decadal changes in tropospheric temperature; Nature Geoscience, v. 7, p. 185–189.
  70. Santer, B. D., Solomon, S., Bonfils, C., Zelinka, M.D., Painter, J.F., Beltran, F., Fyfe, J.C., Johannesson, G., Mears, C., Ridley, D.A., Vernier, J.-P., Wentz, F.J. (2015): Observed multivariable signals of late 20th and early 21st century volcanic activity; Geophysical Research Letters, v. 42, p. 500–509.
  71. Saunois, M., Bousquet, P., Poulter, B., Peregon, A., Ciais, P., Canadell, J.G., Dlugokencky, E.J., Etiope, G., Bastviken, D., Houweling, S., Janssens-Maenhout, G., Tubiello, F.N., Castaldi, S., Jackson, R.B., Alexe, M., Arora, V.K., Beerling, D.J., Bergamaschi, P., Blake, D.R., Brailsford, G., Brovkin, V., Bruhwiler, L., Crevoisier, C., Crill, P., Covey, K., Curry, C., Frankenberg, C., Gedney, N., Höglund-Isaksson, L., Ishizawa, M., Ito, A., Joos, F., Kim, H.-S., Kleinen, T., Krummel, P., Lamarque, J.-F., Langenfelds, R., Locatelli, R., Machida, T., Maksyutov, S., McDonald, K.C., Marshall, J., Melton, J.R., Morino, I., Naik, V., O’Doherty, S., Parmentier, F.-J.W., Patra, P.K., Peng, C., Peng S., Peters, G.P., Pison,I., Prigent, C., Prinn, R., Ramonet, M., Riley, W.J., Saito, M., Santini, M., Schroeder, R., Simpson, I.J., Spahni, R., Steele, P., Takizawa, A., Thornton, B.F., Tian, H., Tohjima, Y., Viovy, N., Voulgarakis, A., van Weele, M., van der Werf, G.R., Weiss, R., Wiedinmyer, C., Wilton, D.J., Wiltshire, A., Worthy, D., Wunch, D., Xu, X., Yoshida, Y., Zhang, B., Zhang, Z. and Zhu, Q. (2016): The global methane budget 2000–2012; Earth System Science Data, v. 8, p. 697–751.
  72. Schmidt, G.A., Shindell, D.T. and Tsigaridis, K. (2014): Reconciling warming trends; Nature Geoscience, v. 7, p. 1–3.
  73. Serreze, M. and Barry, R.G. (2011): Processes and impacts of Arctic Amplification: A research synthesis; Global Planetary Change, v. 77, p. 85–96.
  74. Shabbar, A. and Yu, B. (2009): The 1998–2000 La Niña in the context of historically strong La Niña events; Journal of Geophysical Research: Atmospheres, v. 114.
  75. Shabbar, A., and Yu, B. (2012): Intraseasonal Canadian winter temperature responses to interannual and interdecadal Pacific SST modulations. Atmosphere–Ocean, v. 50, p. 109–121. doi:10.1080/07055900.2012.657154.
  76. Slangen, A., Church, J.A., Zhang, X. and Monselesan, D. (2014): Detection and attribution of global mean thermosteric sea level change; Geophysical Research Letters, v. 41, p. 5951–5959.
  77. Smith, D.M., Booth, B.B.B., Dunstone, N.J., Eade, R., Hermanson, L., Jones, G.S., Scaife, A.A., Sheen, K.L. and Thompson, V. (2016): Role of volcanic and anthropogenic aerosols in the recent global surface warming slowdown; Nature Climate Change, v. 6, p. 936–940.
  78. Solomon, S., Daniel, J.S., Neely III, R.R., Vernier J.-P., Dutton, E.G., and Thomason, L.W. (2011): The persistently variable “background” stratospheric aerosol layer and global climate change; Science, v. 333, p. 866–870.
  79. Solomon, S., Rosenlof, K.H., Portmann, R.W., Daniel, J.S., Davis, S.M., Sanford, T.J. and Plattner, G.-K. (2010): Contributions of stratospheric water vapor to decadal changes in the rate of global warming; Science, v. 327, p. 1219–1223.
  80. Steffen, W., Crutzen, P.J. and McNeill, J.R. (2007): The Anthropocene: Are Humans Now Overwhelming the Great Forces of Nature?; Ambio, v. 36, p. 614–621.
  81. Steinman, B.A., Mann, M.E. and Miller, S.K. (2015): Atlantic and Pacific multidecadal oscillations and Northern Hemisphere temperatures; Science, v. 347, p. 988–991.
  82. Trenberth, K.E. (2002): Evolution of El Niño–Southern Oscillation and global atmospheric surface temperatures; Journal of Geophysical Research, v. 107.
  83. Tyndall, J. (1859): On the transmission of heat of different qualities through gases of different kinds; Proceedings of the Royal Institution, v. 3, p. 155–158; cited in Hulme, M. (2009): On the origin of ‘the greenhouse effect’: John Tyndall’s 1859 interrogation of nature; Weather, Magazine of the Royal Meteorological Society, v. 64, p. 121–123.
  84. USGCRP [United States Global Change Research Program] (2017): Climate Science Special Report: Fourth National Climate Assessment, Volume I, (ed.) D.J. Wuebbles, D.W. Fahey, K.A. Hibbard, D.J. Dokken, B.C. Stewart, and T.K. Maycock; U.S. Global Change Research Program, Washington, DC, USA, 470 p. doi:10.7930/J0J964J6
  85. Vaughan, D.G., Comiso, J.C., Allison, I., Carrasco, J., Kaser, G., Kwok, R., Mote, P., Murray, T., Paul, F., Ren, J., Rignot, E., Solomina, O., Steffen, K. and Zhang, T. (2013): Observations: Cryosphere; in Climate Change 2013: The Physical Science Basis (Contribution of Working Group I to the Fifth Assessment Report of the Intergovernmental Panel on Climate Change), (ed.) T.F. Stocker, D. Qin, G.-K. Plattner, M. Tignor, S.K. Allen, J. Boschung, A. Nauels, Y. Xia, V. Bex and P.M. Midgley; Cambridge University Press, Cambridge, United Kingdom, and New York, NY, USA, p. 317–382. doi:10.1017/CBO9781107415324.012
  86. Vernier, J.-P. (2011): Major influence of tropical volcanic eruptions on the stratospheric aerosol layer during the last decade; Geophysical Research Letters, v. 38.
  87. Weller, E., Min, S.K., Palmer, M. D., Lee, D., Yim, B. Y. and Yeh, S.W. (2016): Multi-model attribution of upper-ocean temperature changes using an isothermal approach; Scientific reports, v. 6.
  88. WMO [World Meteorological Organization] (2016): WMO Greenhouse Gas Bulletin: The State of Greenhouse Gases in the Atmosphere Based on Observations Through 2015; WMO, No. 12.
  89. WMO [World Meteorological Organization] (2017): WMO Statement on the State of the Global Climate in 2016; WMO, No. 1189.
  90. WMO [World Meteorological Organization] (2018): WMO Statement on the State of the Global Climate in 2017; WMO, No. 1212.
  91. Zhang, X., Wan, H., Zwiers, F.W., Hegerl, G.C. and Min, S.K. (2013): Attributing intensification of precipitation extremes to human influence; Geophysical Research Letters, v. 40, p. 5252–5257.
Next

Modelling Future Climate Change