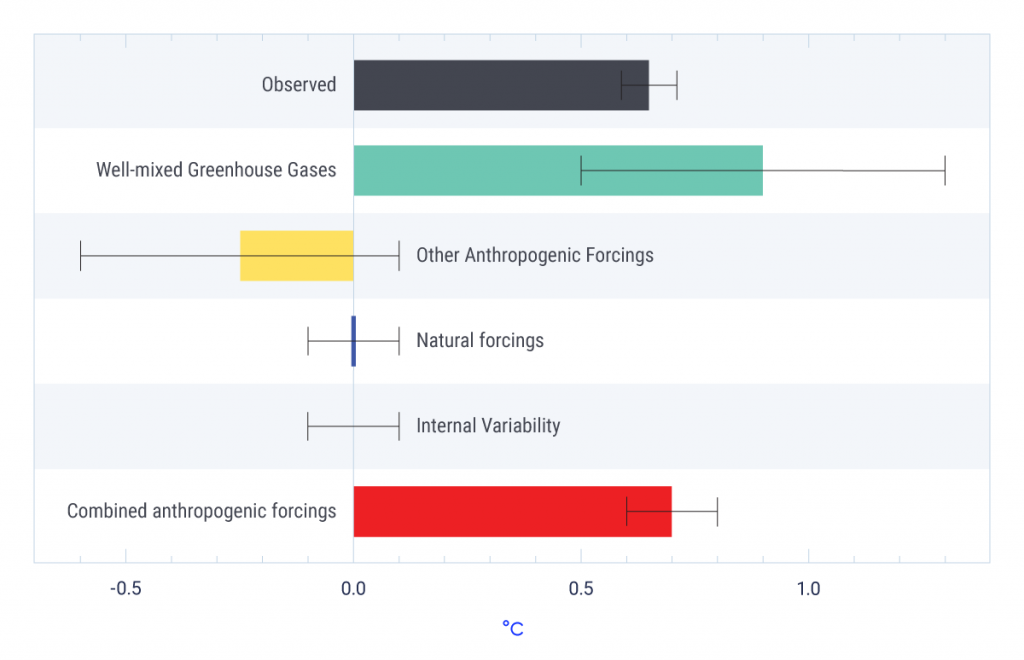
IPCC AR5 assessed likely ranges (horizontal lines [whiskers]) and their mid-points (bars) for forcings to which global mean warming over the 1951–2010 period can be attributed: well-mixed greenhouse gases, other anthropogenic forcings (dominated by aerosols), combined anthropogenic forcings, natural forcings, and internal variability. The black bar shows the observed temperature trend (HadCRUT4 dataset) and the associated 5% to 95% uncertainty range (whiskers). Bars to the left of 0.0°C indicate an attributable cooling; bars to the right indicate an attributable warming.
Source
Bindoff et al., 2013, Figure 10.5.