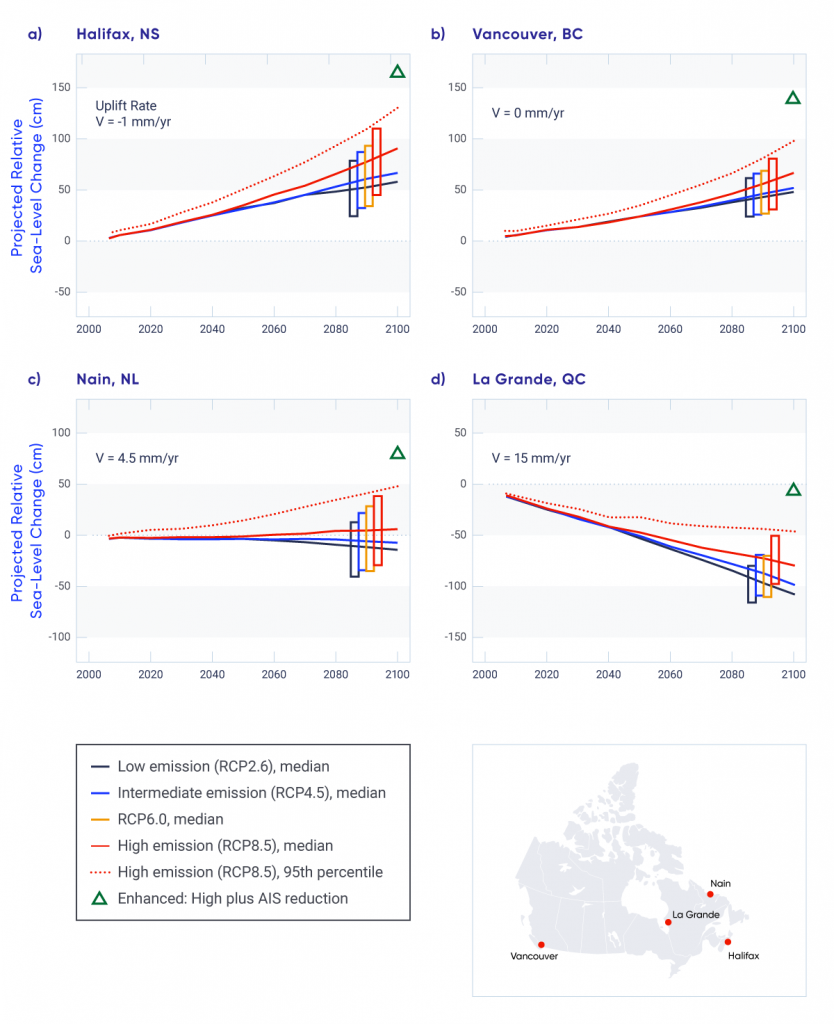
Projected relative sea-level change based on global sea-level projections from Church et al. (2013), and vertical (V) crustal motion (uplift rate, given to nearest 0.5 mm per year) derived from Global Positioning System (GPS) observations indicated in each panel for (a) Halifax, (b) Vancouver, (c) Nain, and (d) La Grande 1 (James et al., 2014, 2015; Lemmen et al., 2016). Projections are given through the current century for low emission (RCP2.6), medium emission (RCP4.5), and high emission (RCP8.5) scenarios. The projected value by 2100 is also given for the enhanced scenario (RCP8.5 plus 65 cm reflecting Antarctic Ice Sheet (AIS) reduction; green triangle). Rectangles show the 90% uncertainty range (5th–95th percentile) of the average projection over the 2081–2100 period and also include the medium (RCP6.0) emission scenario; the dashed red line shows the 95th percentile value for the high emission scenario.
Source
James et al. (2014, 2015), Lemmen et al. (2016).