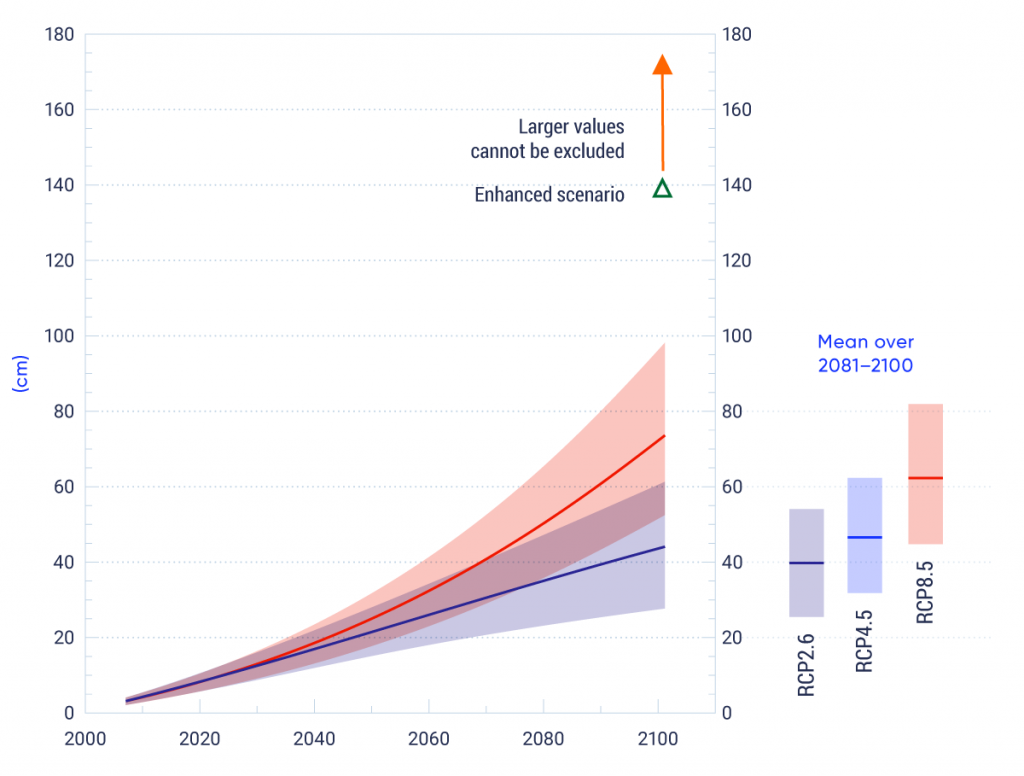
Projections of global average (mean) sea-level rise relative to 1986–2005 for low (RCP2.6) and high (RCP8.5) emission scenarios from IPCC AR5 (Church et al., 2013). Also shown is an enhanced scenario reflecting greater amounts of ice discharged from Antarctica and contributing to global sea-level rise (see Table 7.1). The lines indicate the median projection, and the shading indicates the assessed range (5th–95th percentile, or 90% uncertainty range). The projected global mean sea-level rise over 2081–2100 (relative to 1986-2005) is given on the right for these scenarios and for a medium emission scenario (RCP4.5). Lines and shading are the same as in the main graph.
Source
Figure SPM.9, IPCC, 2013.