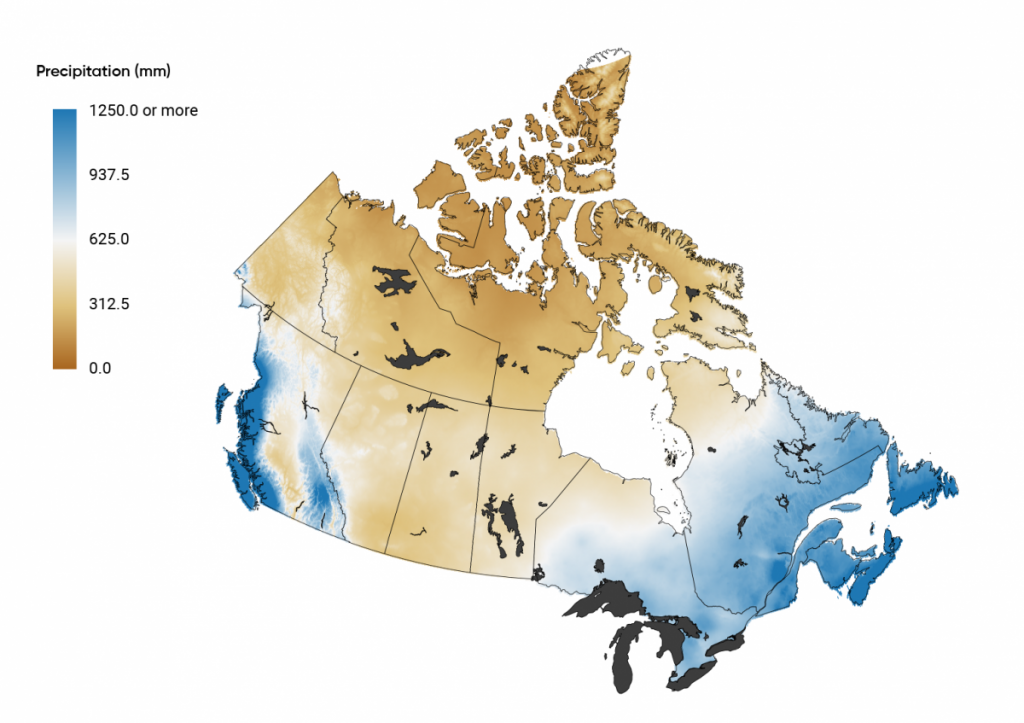
Figure_3.5_v2: Total annual precipitation, average projected for 2021-2050, under a high emission scenario (RCP 8.5)
Note: Blue areas correspond to areas with significant amounts of precipitation, while brown areas correspond to areas with very low precipitation, increasing the risk of drought.