Interactive Figure 4.8
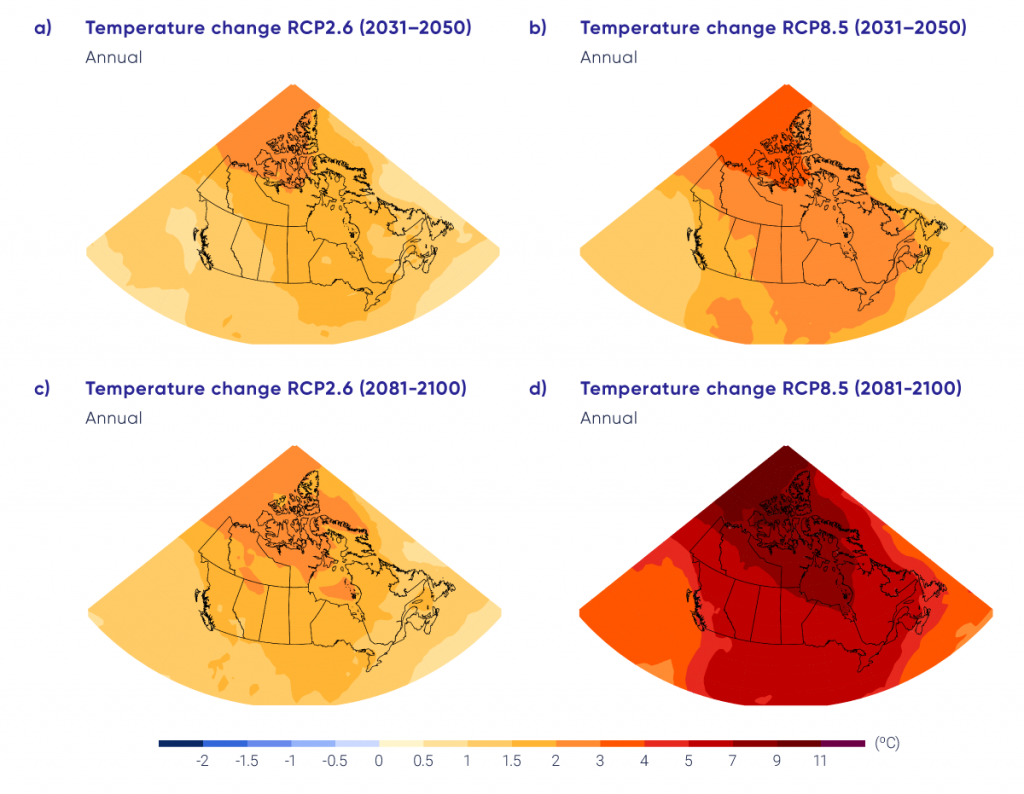
Maps and time series of projected annual mean temperature change, (°C) as represented by the median of the fifth phase of the Coupled Model Intercomparison Project (CMIP5) multi-model ensemble. Changes are relative to the 1986–2005 period. The upper maps show temperature change for the 2031–2050 period and the lower maps, for the 2081–2100 period. The left-hand maps show changes resulting from the low emission scenario (RCP2.6), whereas the right-hand maps show changes from the high emission scenario (RCP8.5). The time series at the bottom of the figure shows the temperature change averaged for the Canadian land area and over the 1900–2100 period. The shaded areas show the spread among individual models and the heavy line is the multi-model mean. The spread among models is quantified by box and whisker plots to the right of the panel in the static version of this plot in the chapter PDF (available here: https://changingclimate.ca/CCCR2019/downloads/). These show, for the 2081–2100 period, the 5th, 25th, 50th (median), 75th, and 95th percentile values.
Source
Climate Research Division, Environment and Climate Change Canada.