Interactive Figure 4.3
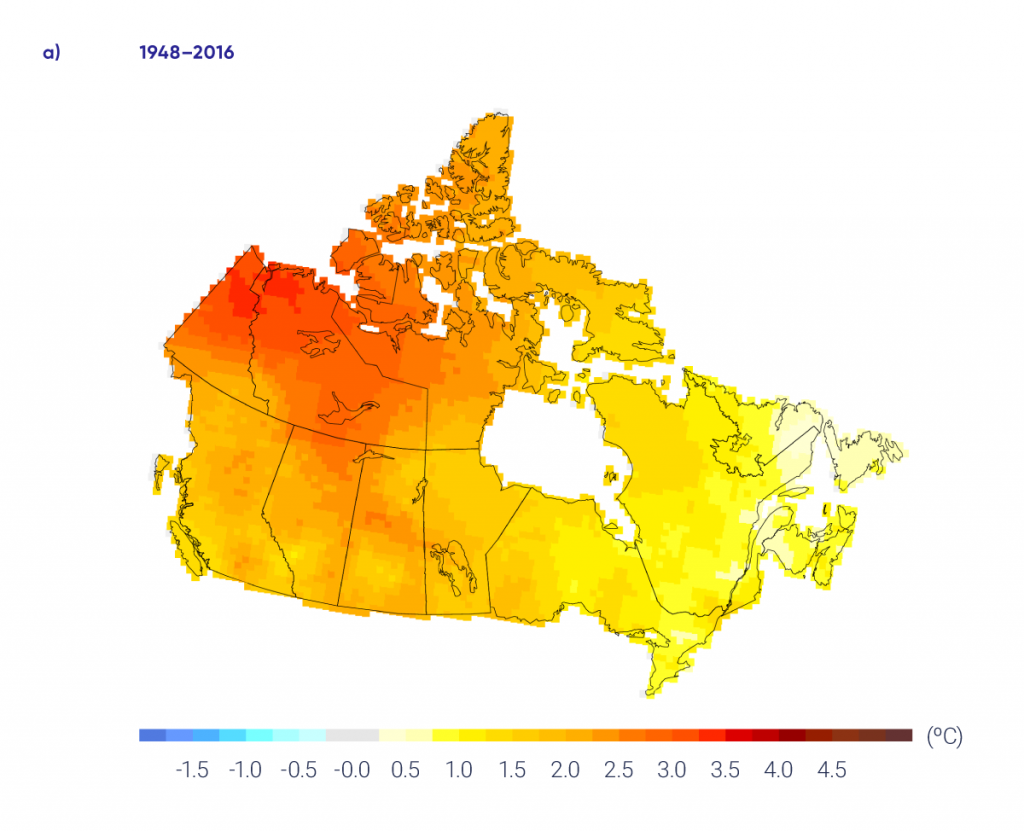
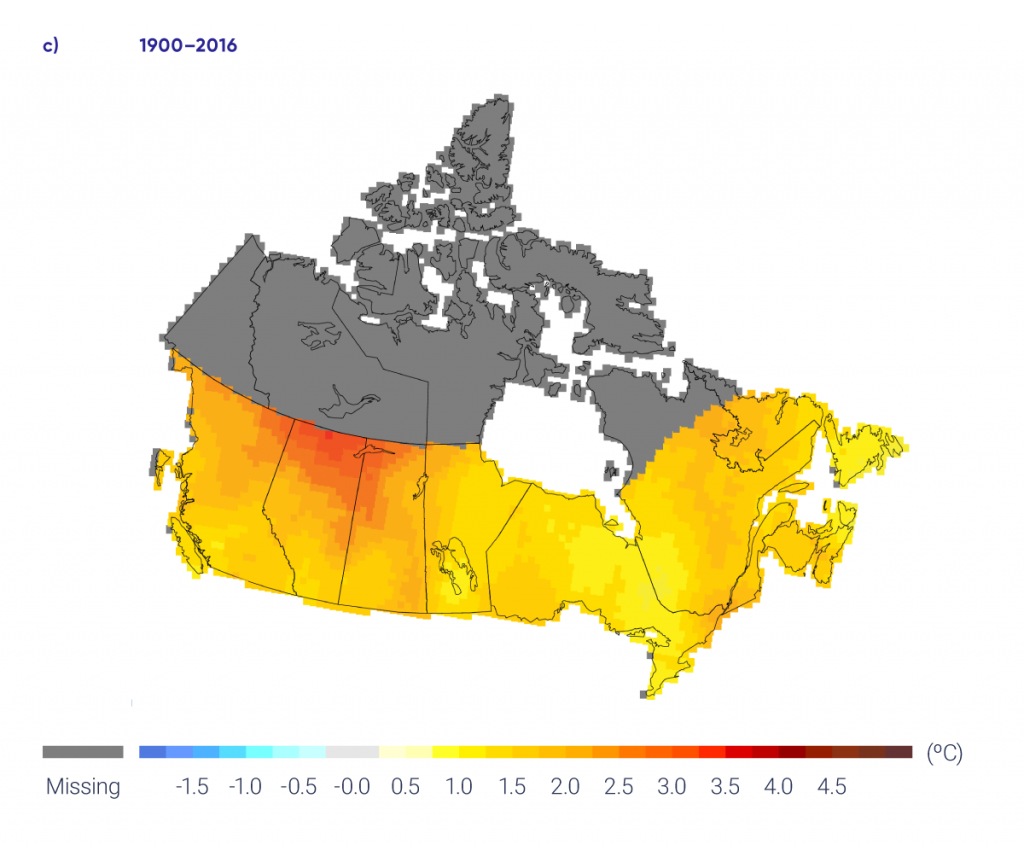
Observed changes (°C) in annual temperature between (a) 1948 and 2016 and (c) 1900 and 2016. Changes are computed based on linear trends over the respective periods. Annual temperature anomalies (departures from baseline means) are expressed relative to the mean for the period 1961–1990 (b) for Canada as a whole and (d) for southern Canada (south of 60° north latitude); the black lines are 11-year running means. Estimates are derived from the gridded station data. There are insufficient data in northern Canada to confidently calculate warming trends from 1900 to 2016.
Source
Updated from Figure 2 of Vincent et al., 2015.