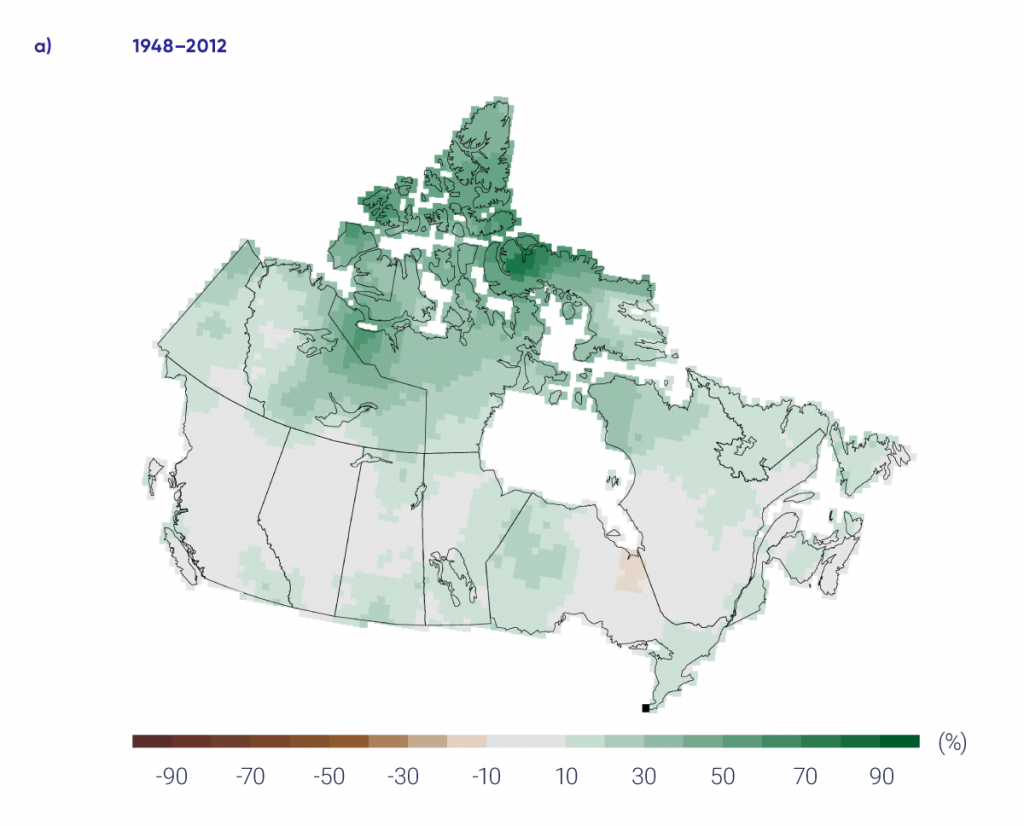
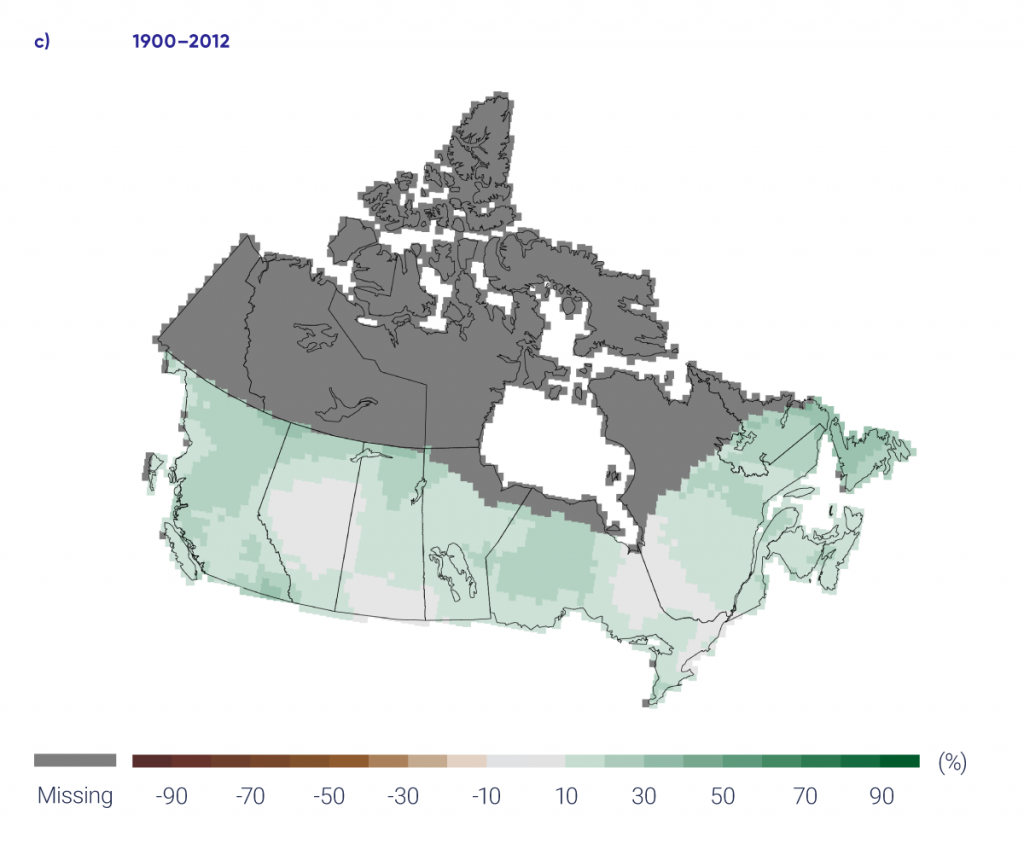
Interactive Figure 4.15
Observed changes in locally normalized annual precipitation (%) between (a) 1948 and 2012 and (c) 1900 and 2012; changes are computed based on linear trends over the respective periods. Average of normalized precipitation relative to the 1961–1990 mean (b) across Canada and (d) in southern Canada (south of 60° north latitude); the black lines are 11-year running mean. Estimates are derived from the gridded station data. There is a lack of data in northern Canada (see Figure 4.1).
Source
Updated from Figure 4 of Vincent et al., 2015.