Chapter Key Messages
SNOW COVER
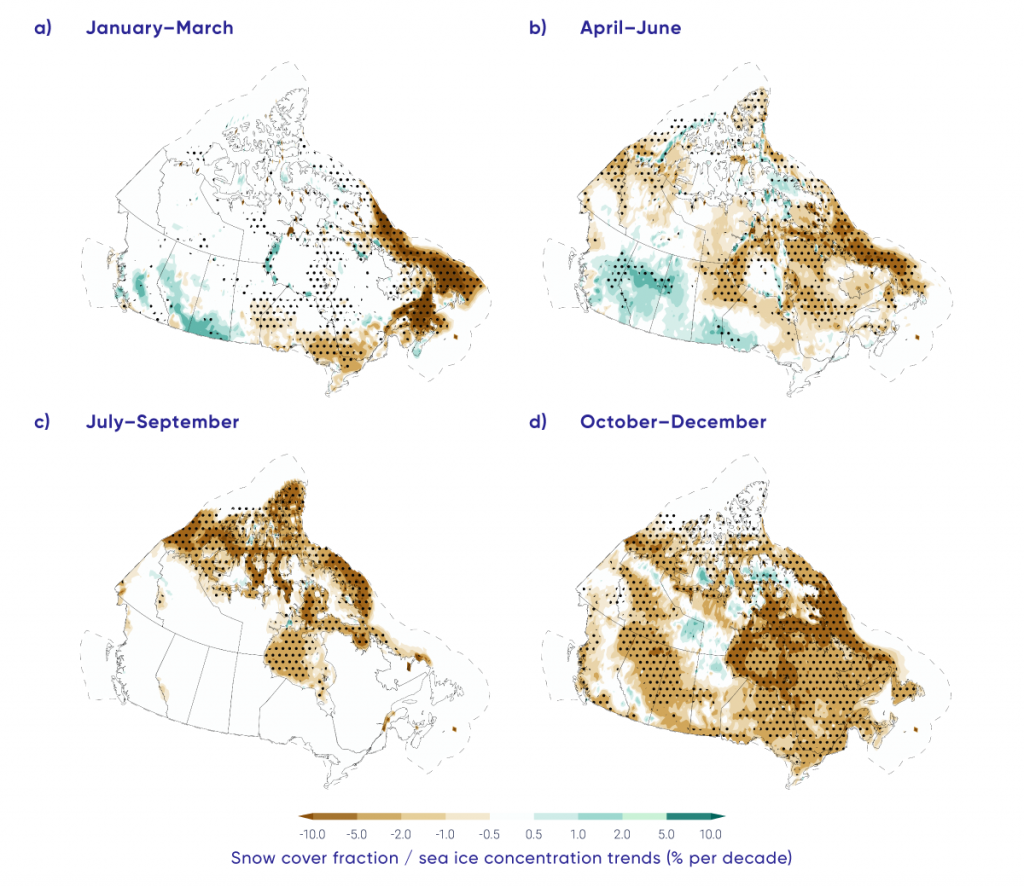
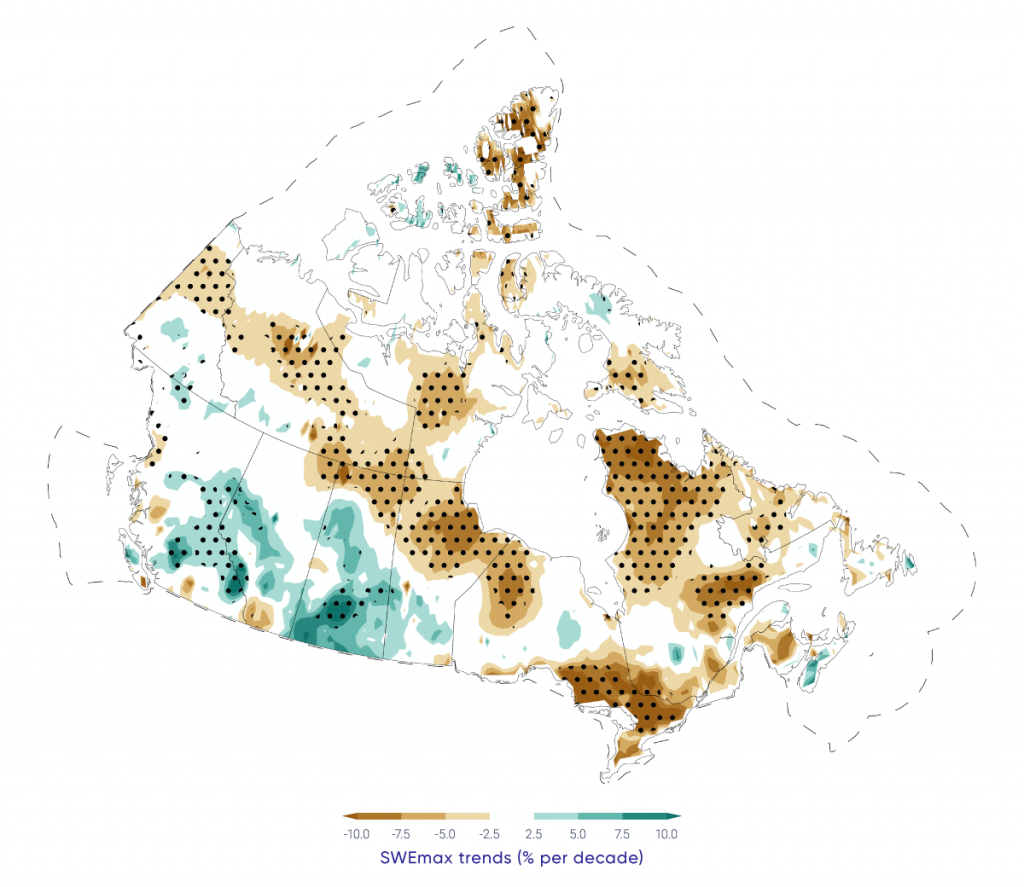
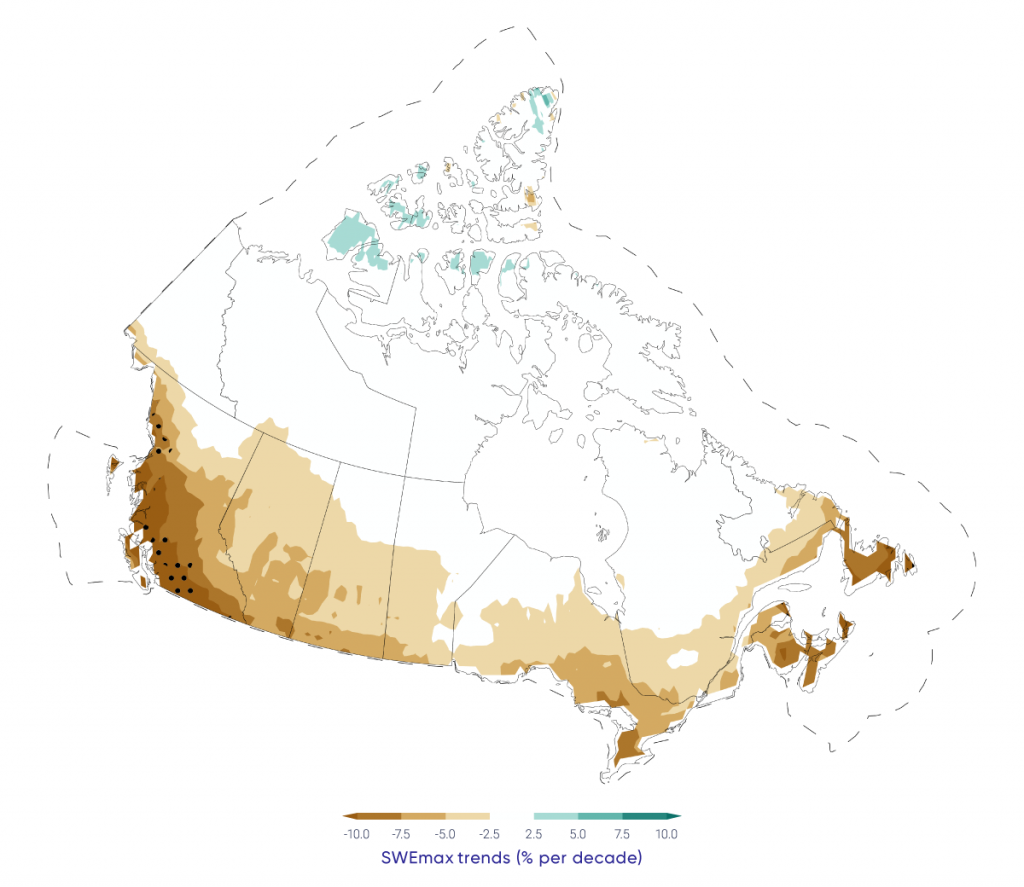
The portion of the year with snow cover decreased across most of Canada (very high confidence1) as did the seasonal snow accumulation (medium confidence). Snow cover fraction decreased between 5% and 10% per decade since 1981 due to later snow onset and earlier spring melt. Seasonal snow accumulation decreased by 5% to 10% per decade since 1981 with the exception of southern Saskatchewan, and parts of Alberta and British Columbia (increases of 2% to 5% per decade).
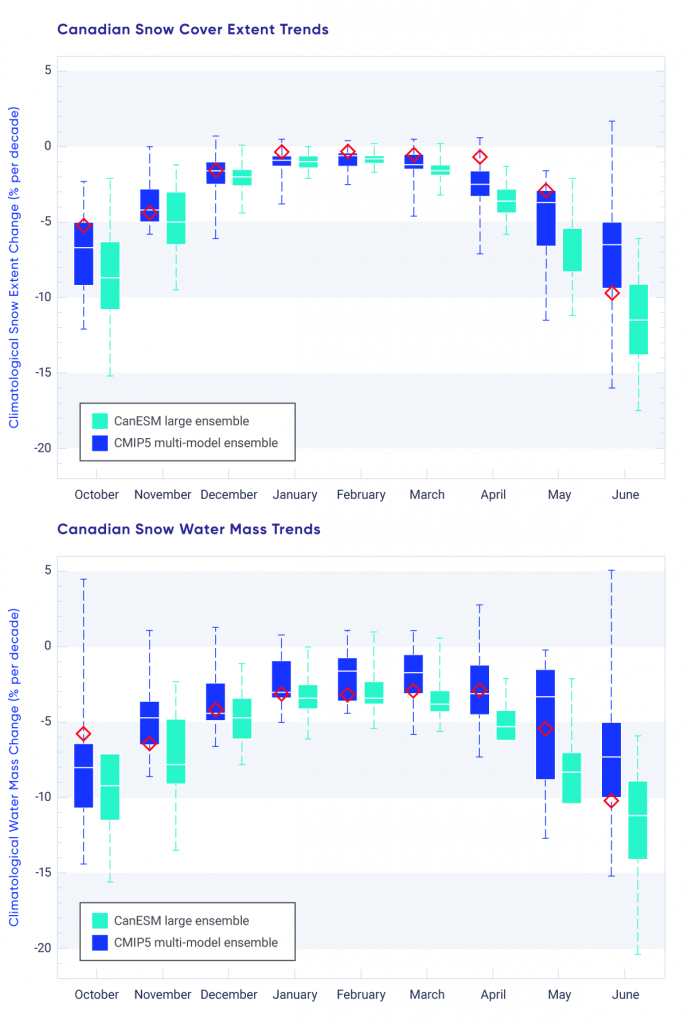
It is very likely that snow cover duration will decline to mid-century across Canada due to increases in surface air temperature under all emissions scenarios. Scenario-based differences in projected spring snow cover emerge by the end of the century, with stabilized snow loss for a medium emission scenario but continued snow loss under a high emission scenario (high confidence). A reduction of 5% to 10% per decade in seasonal snow accumulation is projected through to mid-century for much of southern Canada; only small changes in snow accumulation are projected for northern regions of Canada (medium confidence).
SEA ICE
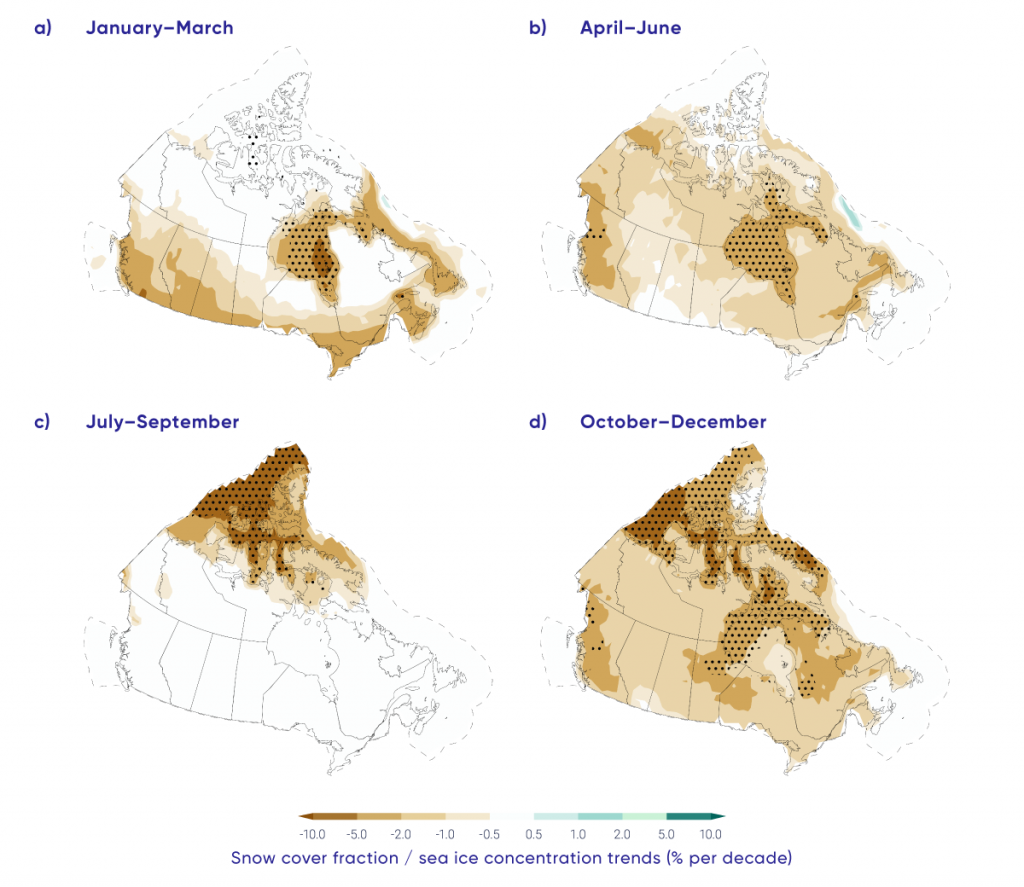
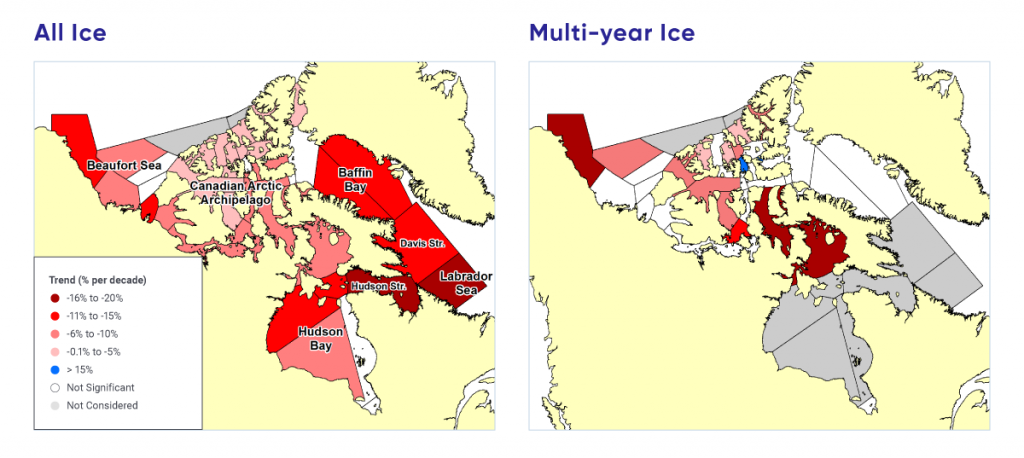
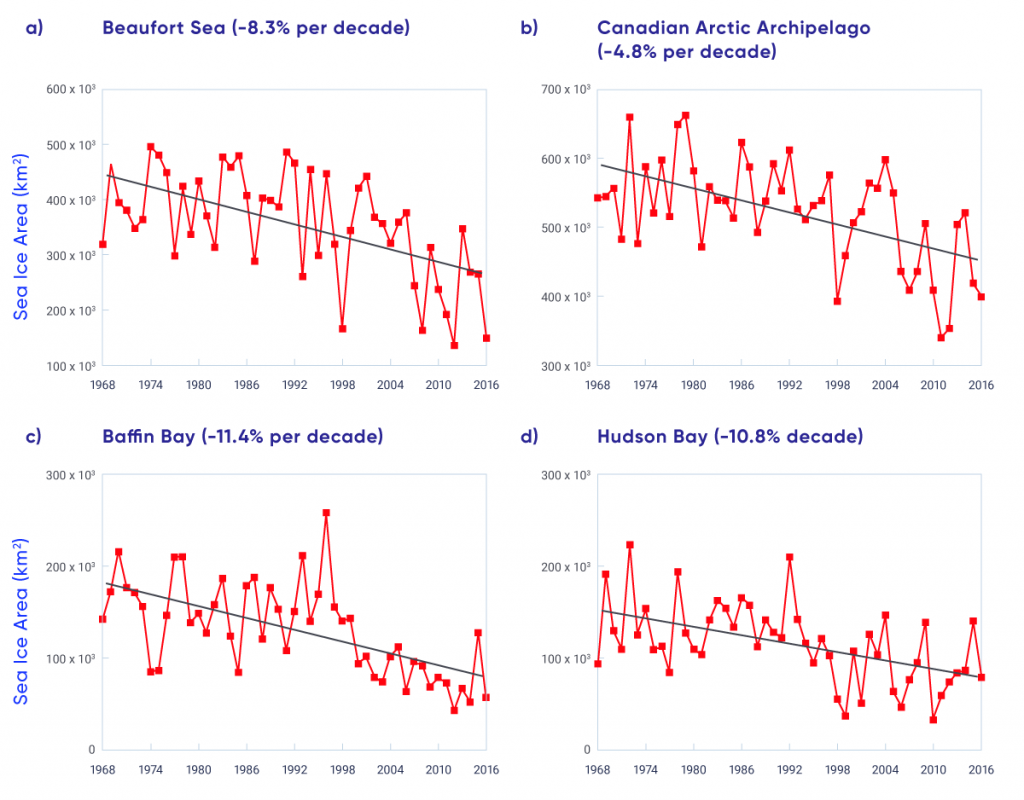
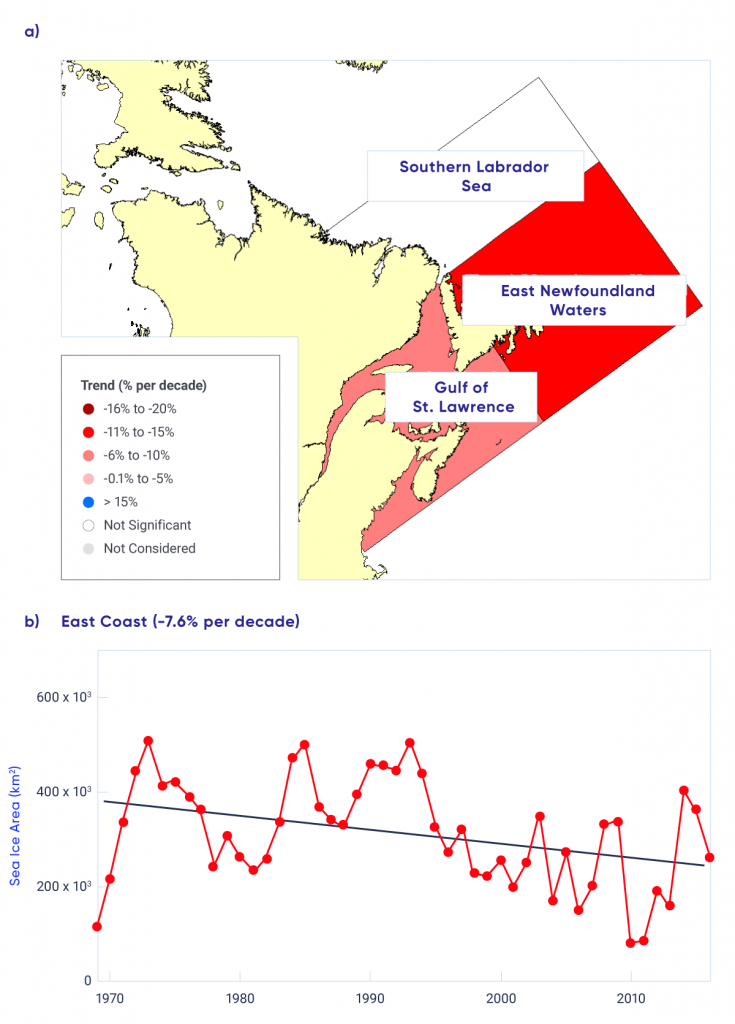
Perennial sea ice in the Canadian Arctic is being replaced by thinner seasonal sea ice (very high confidence). Summer sea ice area (particularly multi-year ice area) declined across the Canadian Arctic at a rate of 5% per decade to 20% per decade since 1968 (depending on region); winter sea ice area decreased in eastern Canada by 8% per decade.
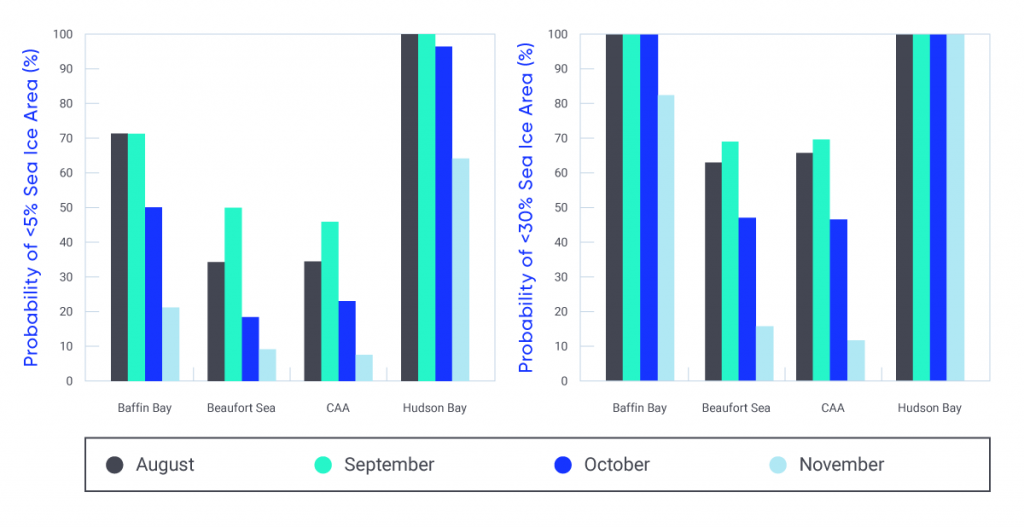
It is very likely that increased temperatures under all emissions scenarios will result in continued reduction in sea ice area across the Canadian Arctic in summer and the east coast in winter. Most Canadian Arctic marine regions will be sea ice-free for part of the summer by 2050 (medium confidence), although the region to the north of the Canadian Arctic Archipelago and Greenland will be the last area in the Arctic with multi-year ice present during the summer (very high confidence). Multi-year ice will, therefore, still drift into the Northwest Passage (and present a navigation hazard for shipping) even when the Arctic Ocean is sea ice-free during the summer.
GLACIERS AND ICE CAPS
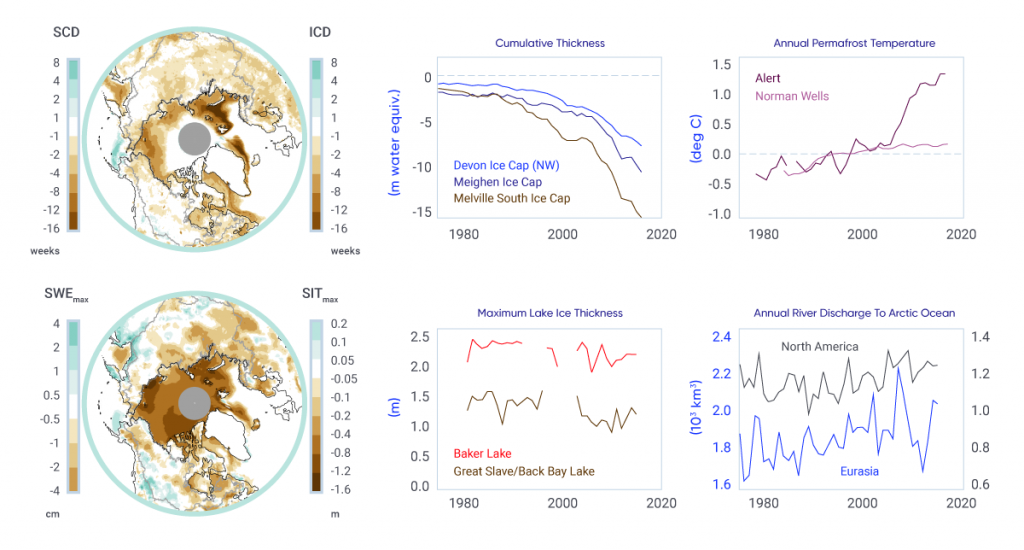
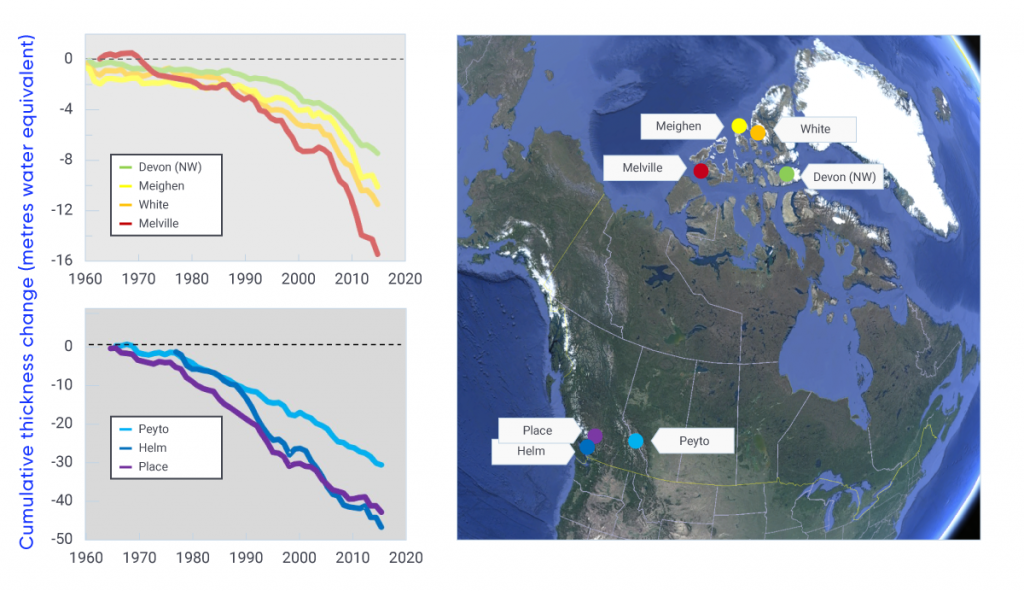
Canada’s Arctic and alpine glaciers have thinned over the past five decades due to increasing surface temperatures; recent mass loss rates are unprecedented over several millennia (very high confidence). Mass loss from glaciers and ice caps in the Canadian Arctic represent the third largest cryosphere contributor to global sea level rise (after the Greenland and Antarctic ice sheets) (very high confidence).
Under a medium emission scenario, it is projected that glaciers across the Western Cordillera will lose 74% to 96% of their volume by late century (high confidence). An associated decline in glacial meltwater supply to rivers and streams (with impacts on freshwater availability) will emerge by mid-century (medium confidence). Most small ice caps and ice shelves in the Canadian Arctic will disappear by 2100 (very high confidence).
LAKE AND RIVER ICE
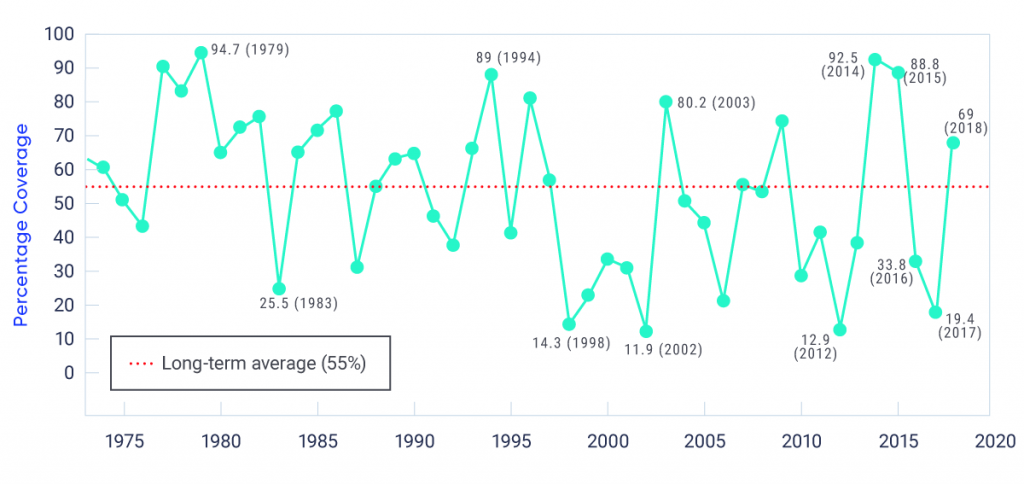
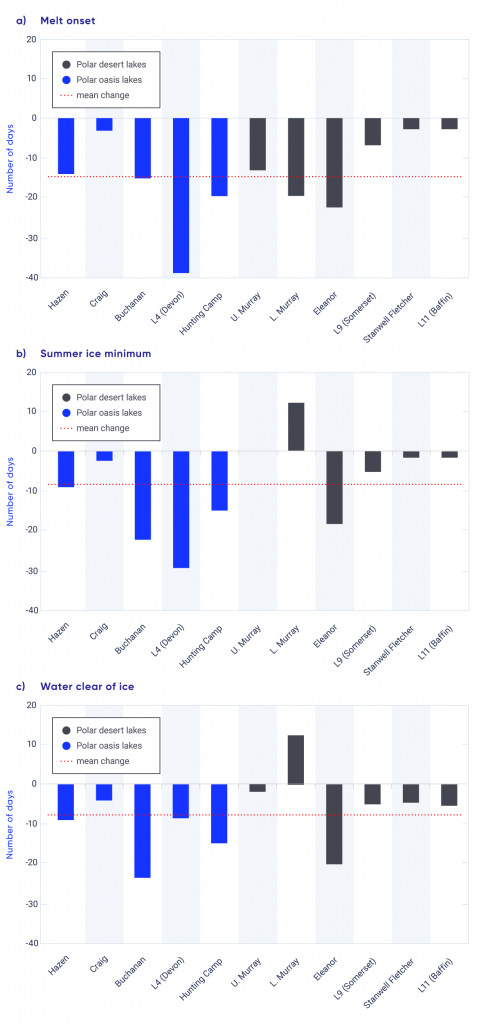
The duration of seasonal lake ice cover has declined across Canada over the past five decades due to later ice formation in fall and earlier spring breakup (high confidence). Seasonal maximum lake ice cover for the Great Lakes is highly variable since 1971 (very high confidence), with no significant trend.
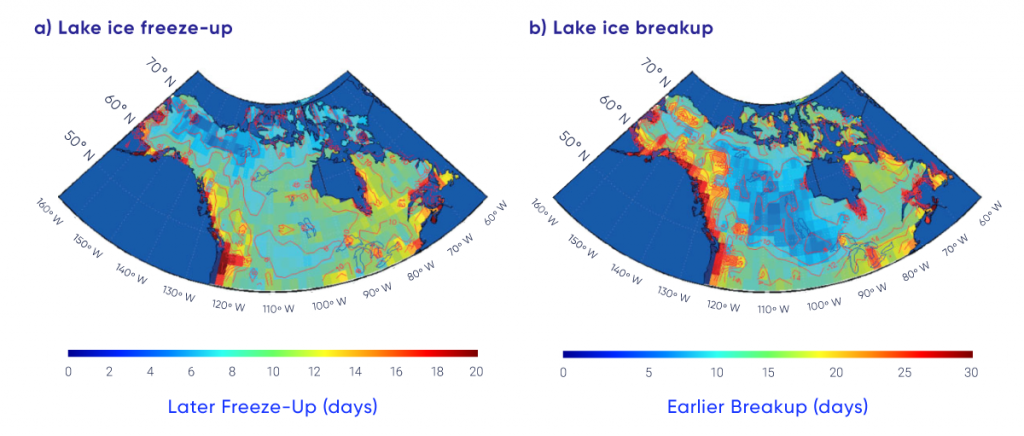
Spring lake ice breakup will be 10 to 25 days earlier by mid-century, and fall freeze-up 5 to 15 days later, depending on the emissions scenario and lake-specific characteristics such as depth (medium confidence).
PERMAFROST
Permafrost temperature has increased over the past 3–4 decades (very high confidence). Regional observations identify warming rates of about 0.1°C per decade in the central Mackenzie Valley and 0.3°C to 0.5°C per decade in the high Arctic. Active layer thickness has increased by approximately 10% since 2000 in the Mackenzie Valley. Widespread formation of thermokarst landforms have been observed across northern Canada.
Increases in mean air temperature over land underlain with permafrost are projected under all emissions scenarios, resulting in continued permafrost warming and thawing over large areas by mid-century (high confidence) with impacts on northern infrastructure and the carbon cycle.