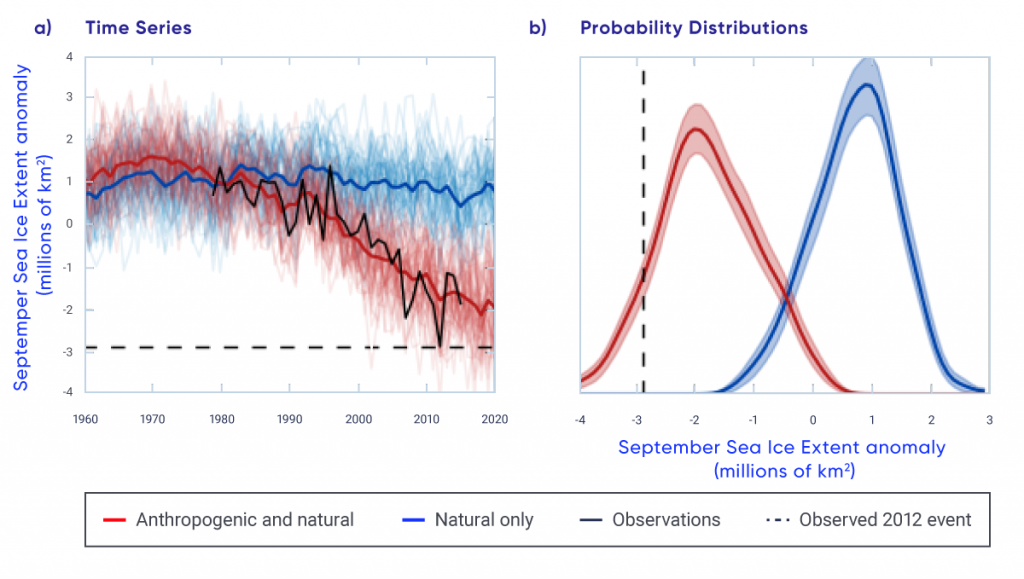
(a)Time series of September Arctic sea ice extent (SIE) simulations that include the human-induced component (red) and simulations that include only natural factors (blue), shown as anomalies. Time series from 50 realizations of the Canadian Earth System Model (CanESM2) are shown, with the mean shown in bold. The time series of observations from the National Snow and Ice Data Center is shown in black. The horizontal dashed line indicates the record-low 2012 SIE. (b) Probability distributions for values from each set of simulations with (red) and without (blue) the human-induced component. Shading represents the uncertainty in the estimated distributions and the vertical dashed line indicates the record-low 2012 SIE.
Source
Figure source: Adapted from Kirchmeier-Young et al. (2017).