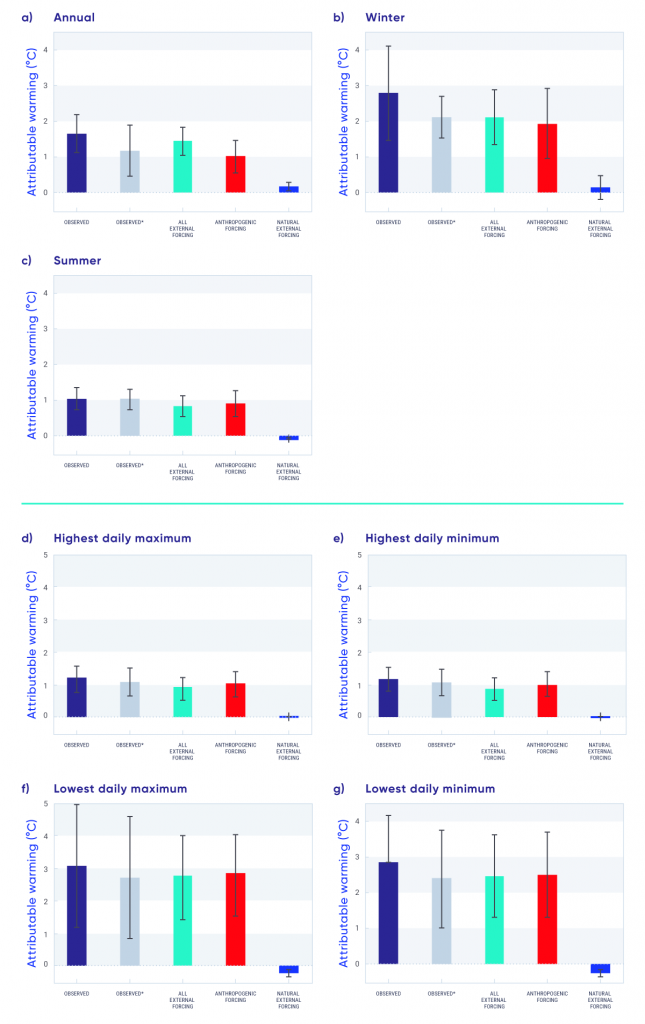
Changes in the observations (Observed, navy) and in the observed data removing the effects of the Pacific Decadal Oscillation and the North Atlantic Oscillation (Observed*, grey), along with the estimated contribution of all external forcing, anthropogenic forcing, and natural external forcing (effects of solar and volcanic activities) to observed changes in mean (a, b, c) and extreme (d, e, f, g) temperatures for Canada as a whole over the 1948–2012 period. The top panels show the estimations of attributable warming for (a) annual, (b) winter, and (c) summer mean temperatures. The bottom panels show estimates of attributable warming for extreme temperatures, including (d) annual highest daily maximum temperature, (e) annual highest daily minimum temperature, (f) annual lowest daily maximum temperature, and (g) annual lowest daily minimum temperature. The thin black bars indicate the 5%–95% uncertainty range.
Source
Adapted from Figure 7 of Wan et al., 2018