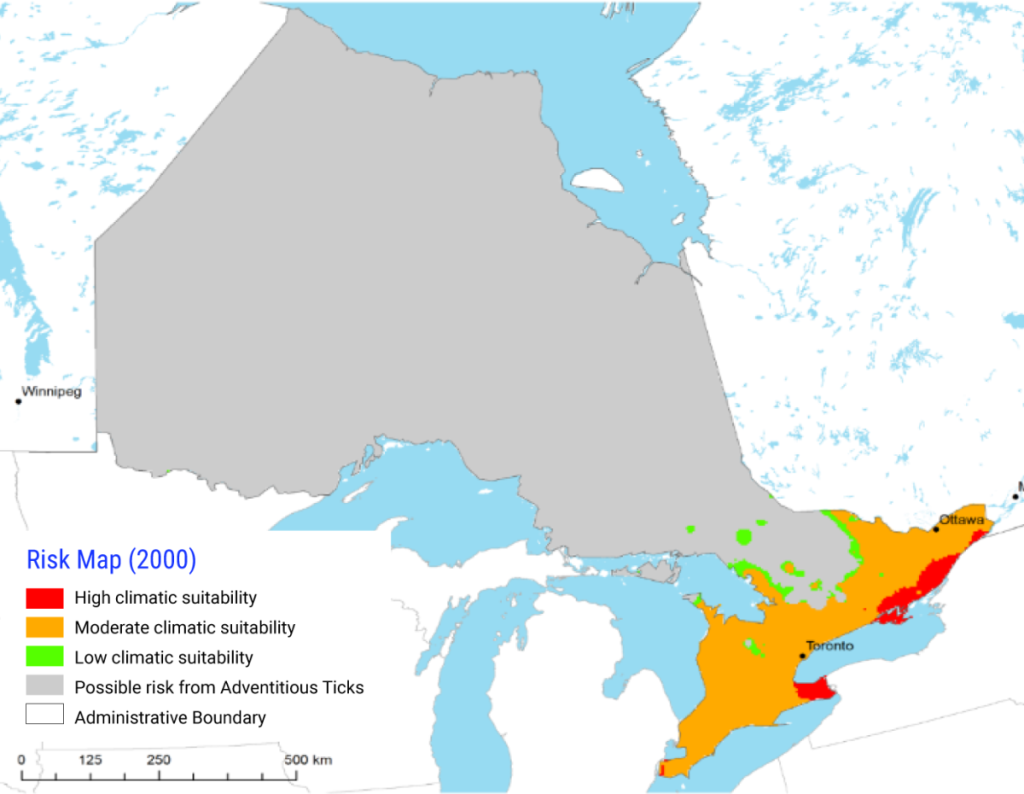
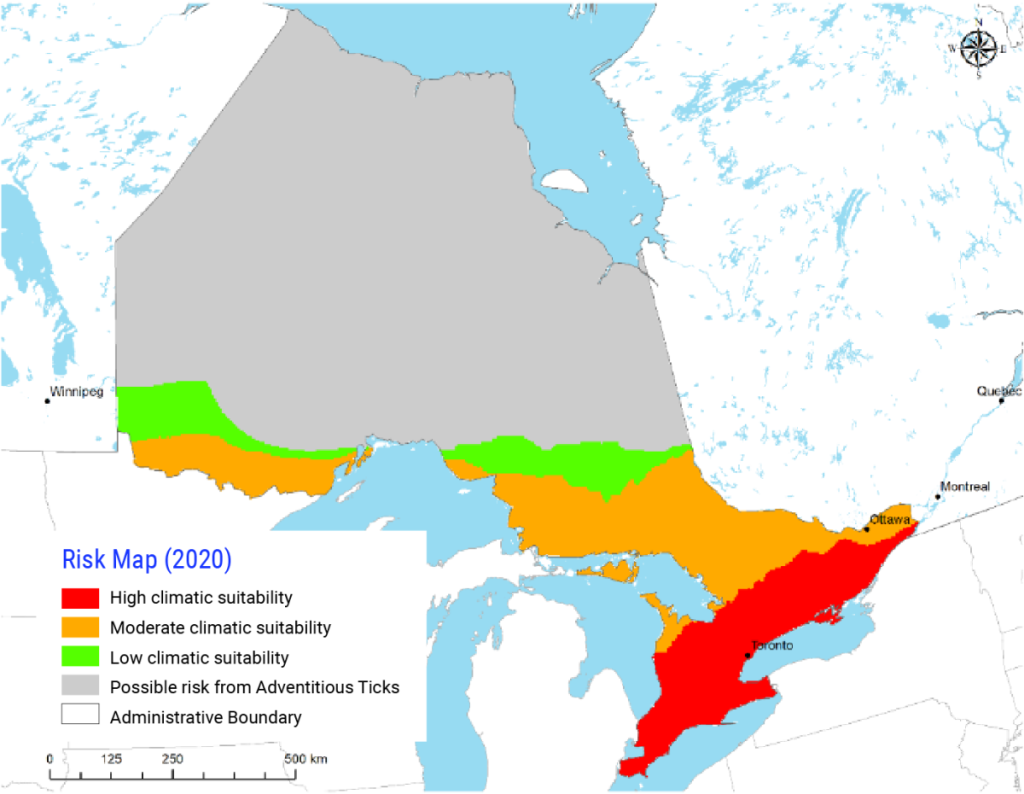
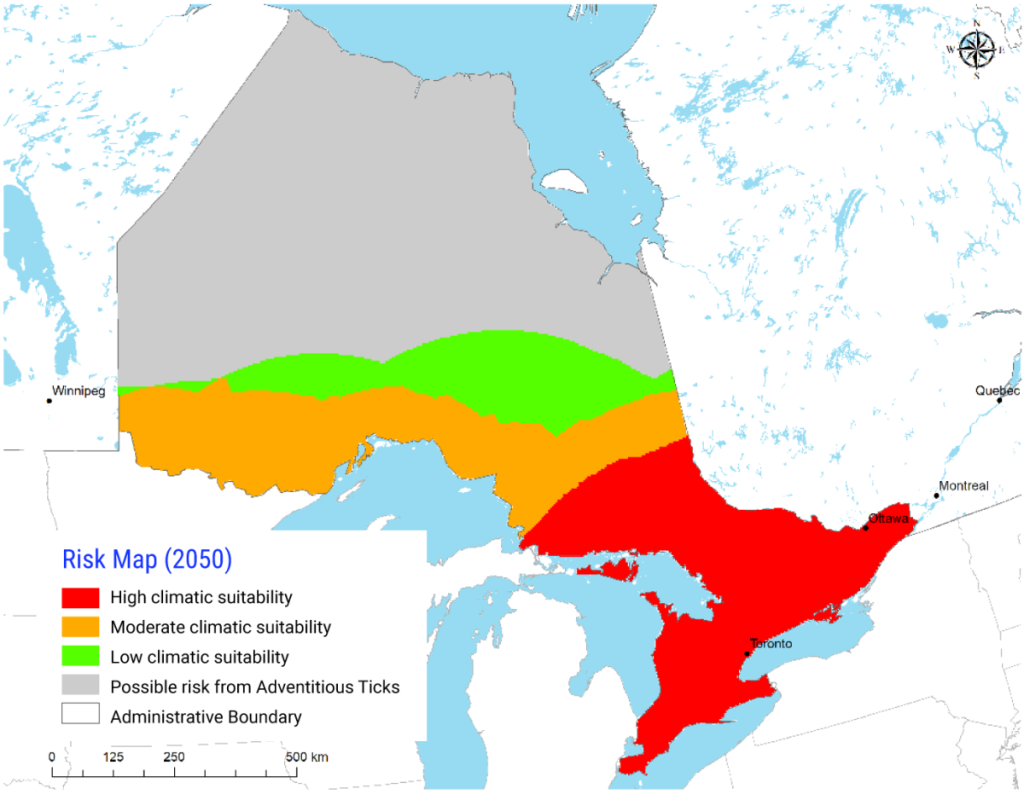
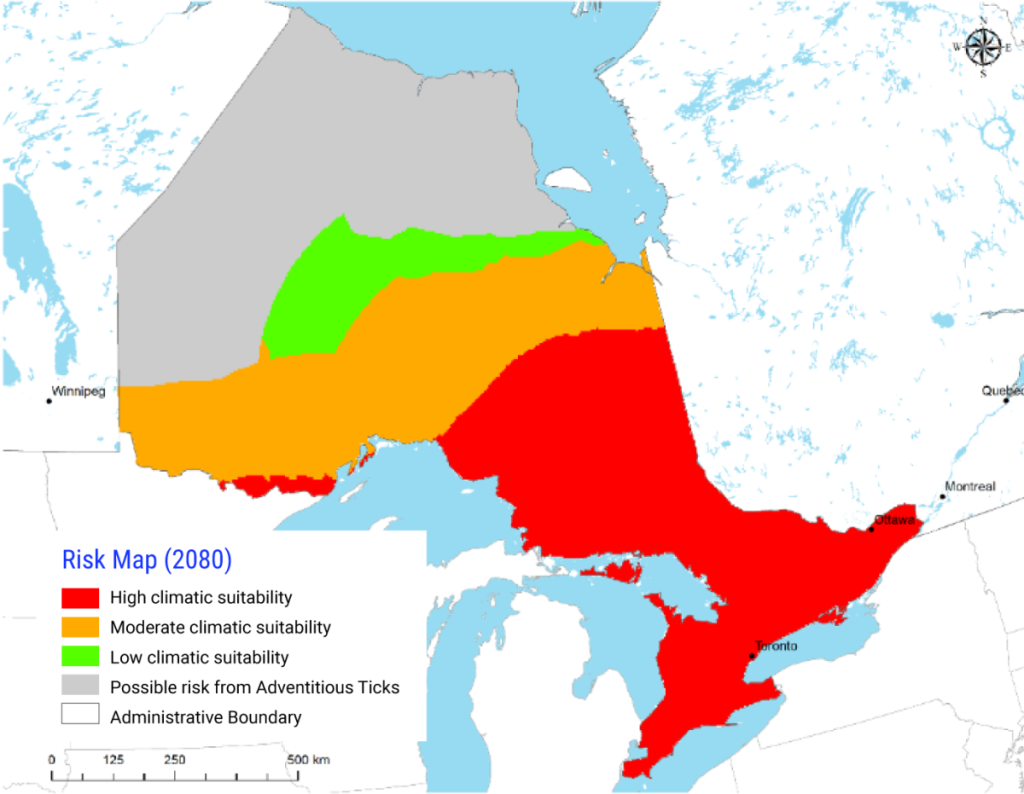
Figure 3.22
Risk maps for populations of the black legged tick (Ixodes scapularis) vector of Lyme disease under recent (1971-2000), the current decade (2020s) and more distant future (2050s and 2080s) climate scenarios.Risk maps for populations of the blacklegged tick (Ixodes scapularis) vector of Lyme disease under recent climate scenarios (1971‒2000), the current decade (2020s) and more distant future (2050s and 2080s) climate scenarios. Climate data was derived using the Canadian Regional Climate Model version 4.2.3 and was forced by a high (A2) emissions scenario. Red denotes areas of high risk, orange areas of medium risk, green areas of low risk, and grey areas of no risk of tick populations. Within “no risk” areas, there is a low but real risk of acquiring Lyme disease due to adventitious ticks dispersed by migratory birds.
Source
Figures courtesy of Nick Ogden.