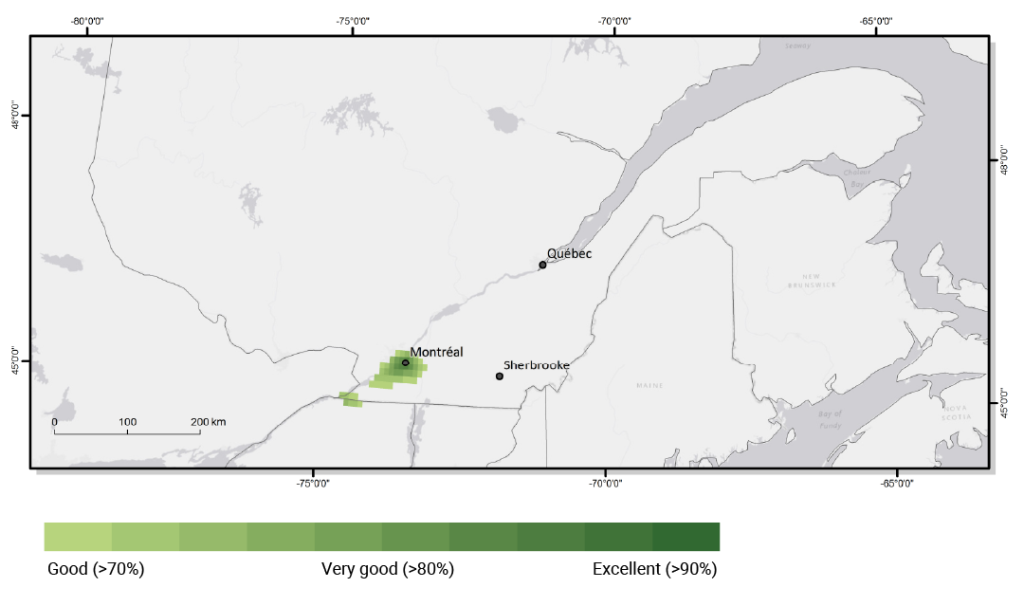
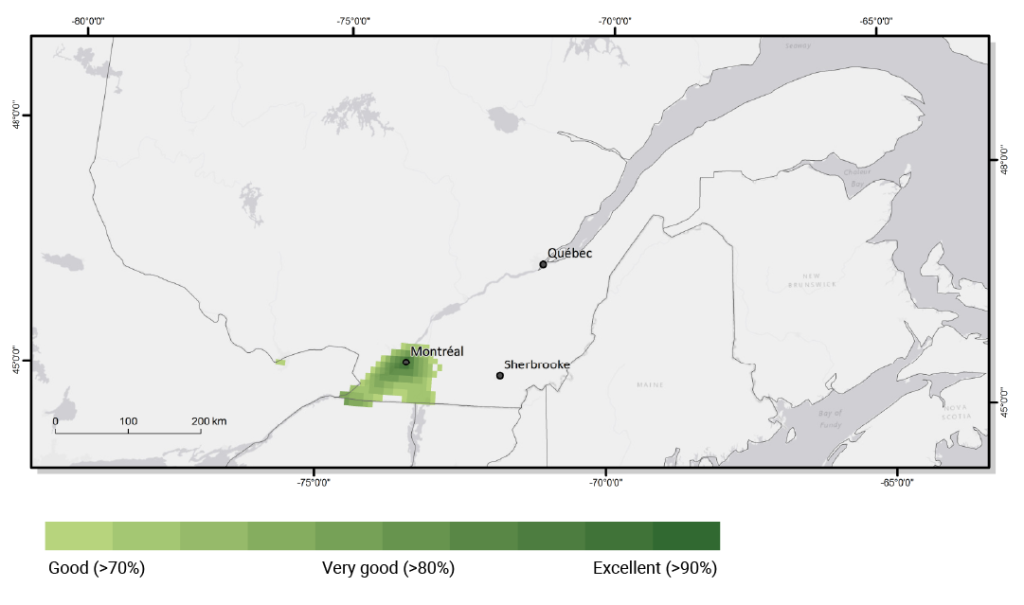
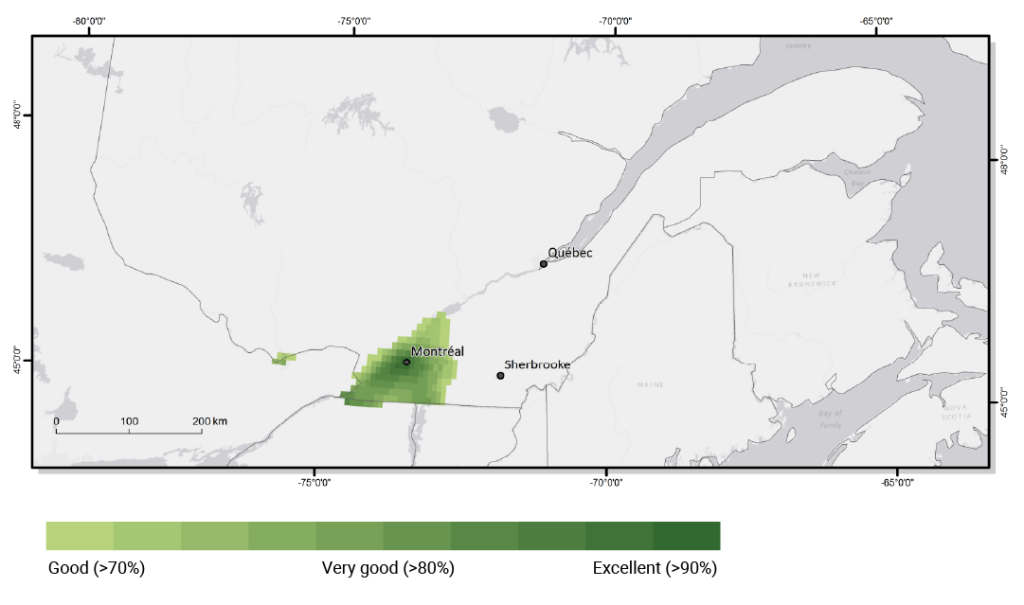
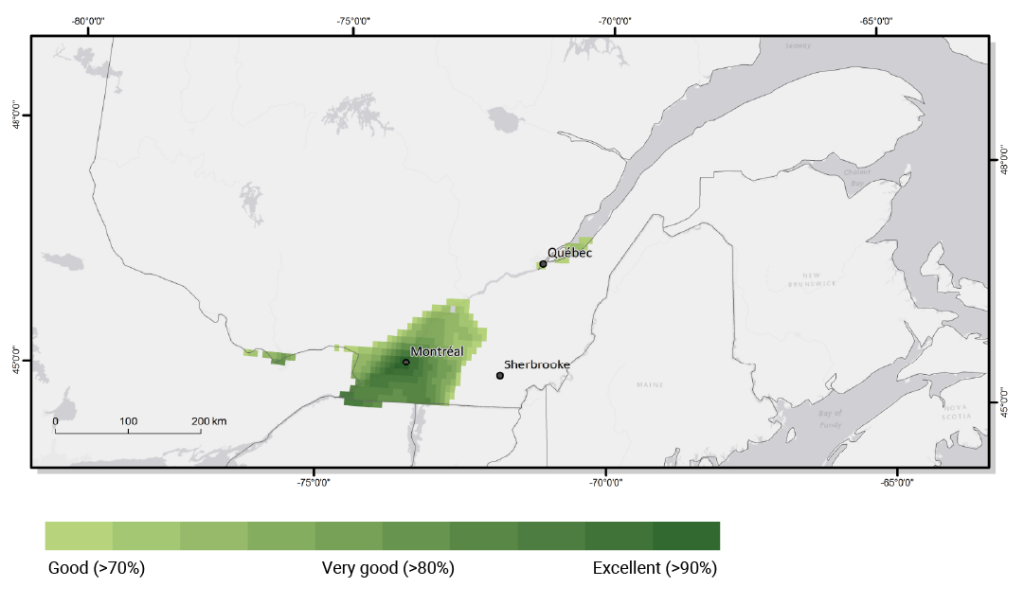
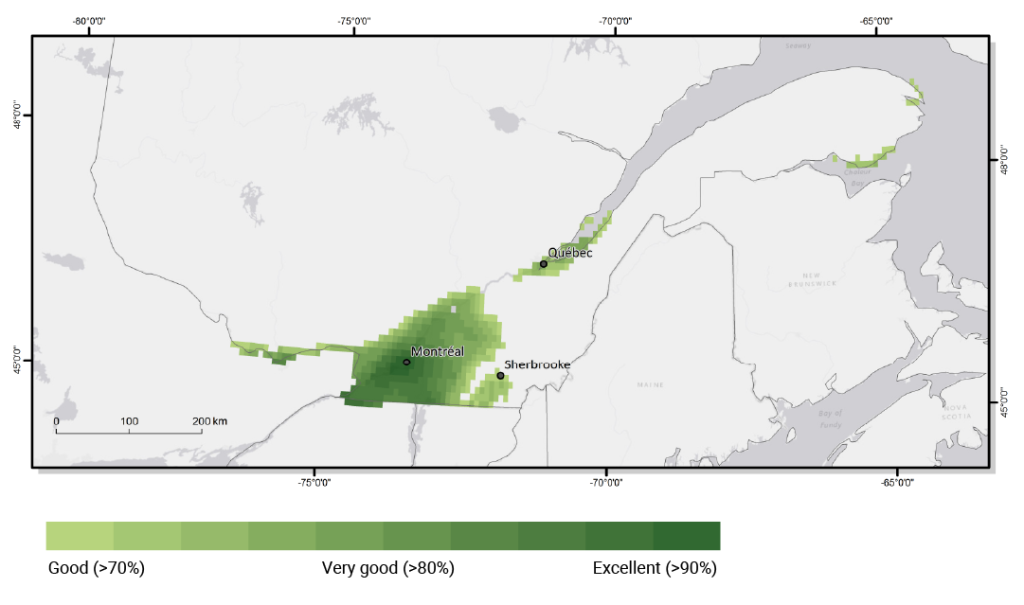
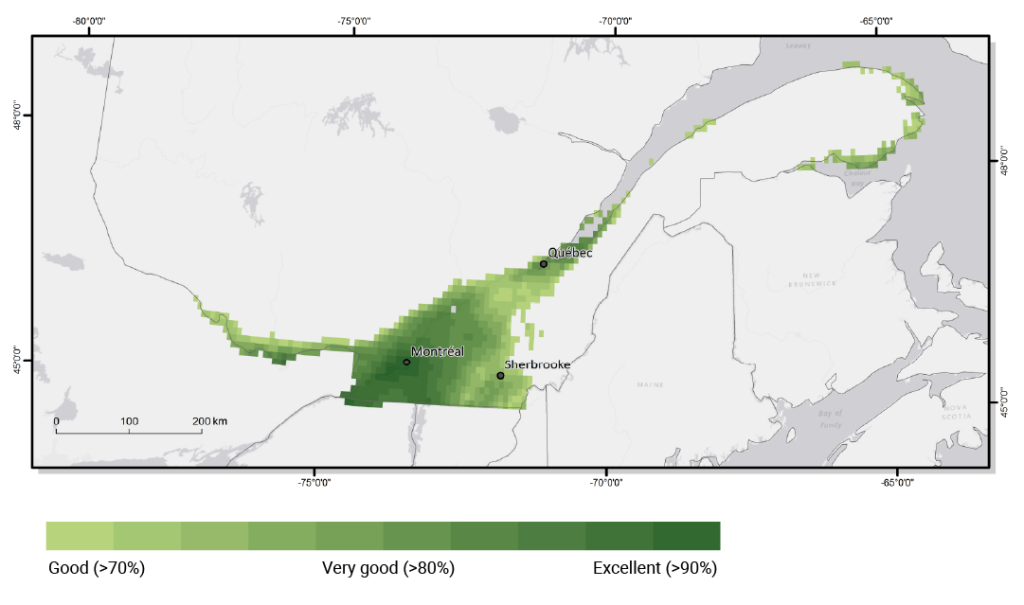
Trends in the viticultural potential of the St. Lawrence Valley according to a combination of RCP 4.5 and 8.5 scenarios.
Roy et al., 2017b.