Figure 1.14
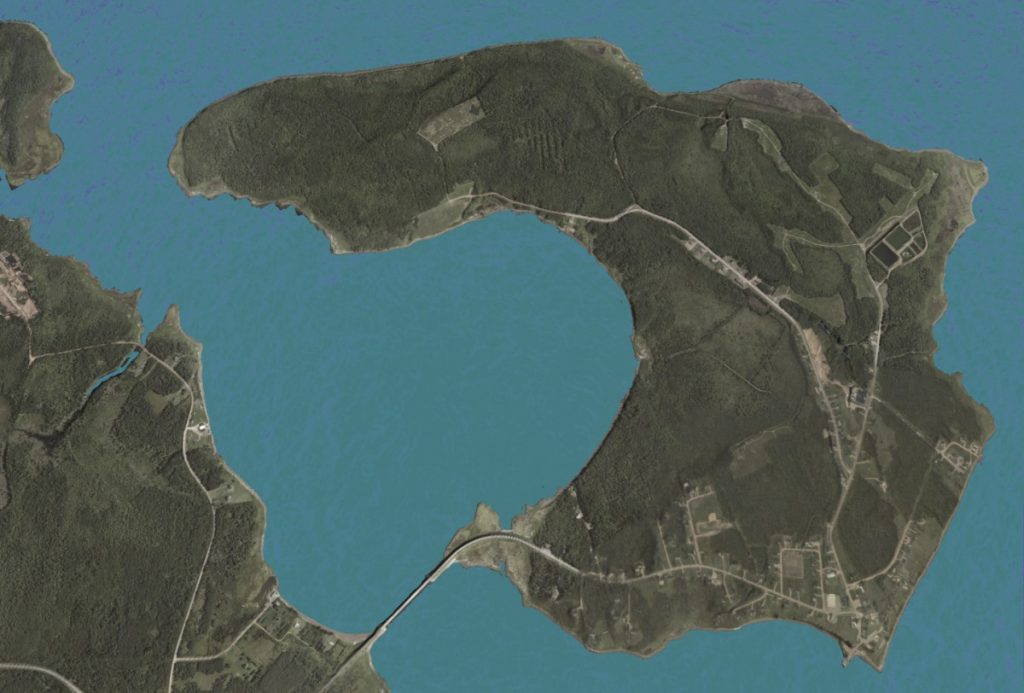
a) Lennox Island (present day)
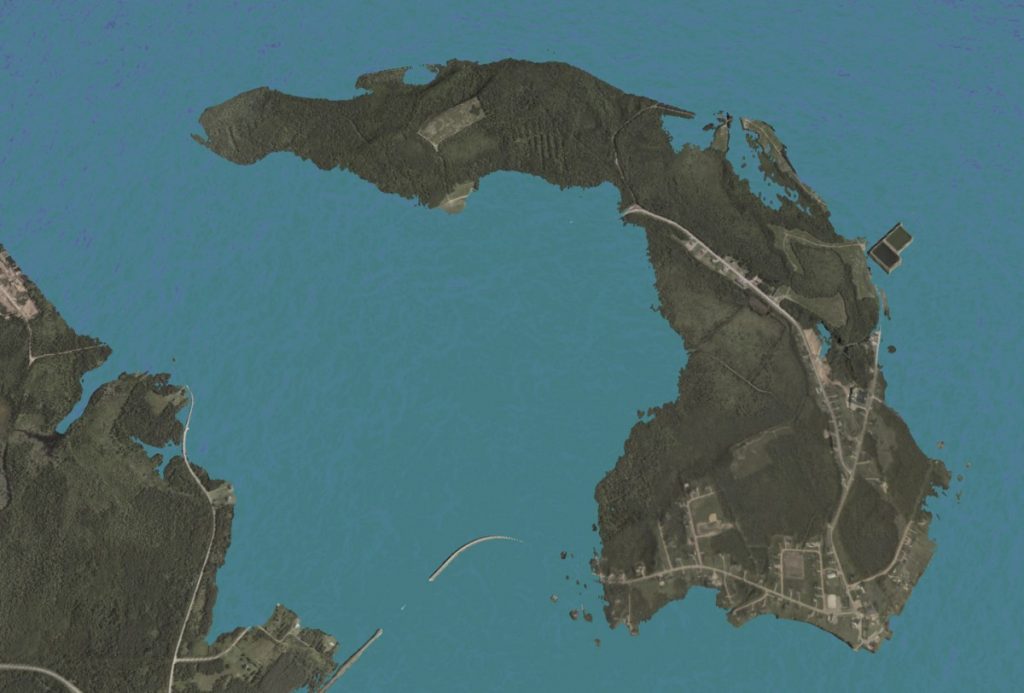
b) 3-m sea-level rise and/or storm surge scenario
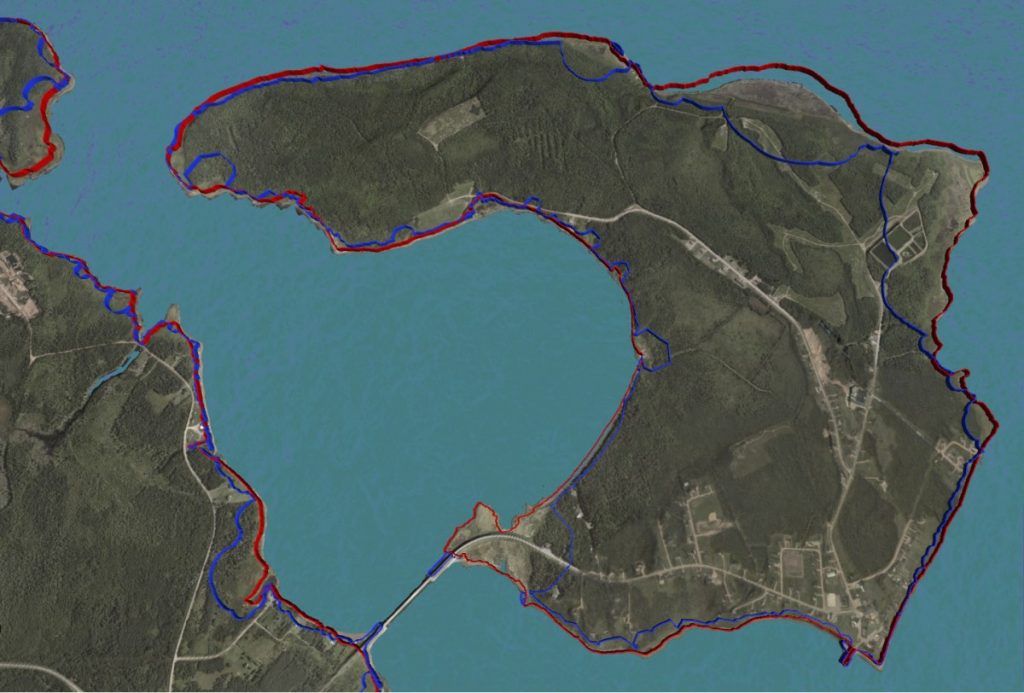
c) Coastal change scenarios: 1968 versus 2100
a) Lennox Island (present day)
b) 3-m sea-level rise and/or storm surge scenario
c) Coastal change scenarios: 1968 versus 2100