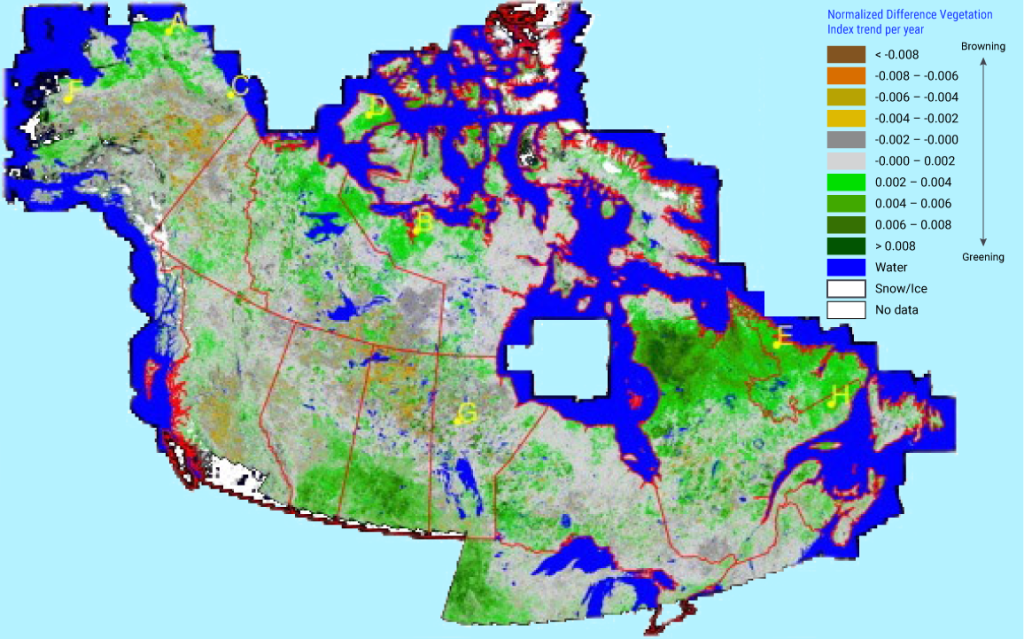
Figure 6.7: Landsat-based maps showing greenness trends through the use of the Normalized Difference Vegetation Index (NDVI), which estimates the density of greenery in an area using the difference between visible and near-infrared reflectance of vegetation. Where there were not enough valid observations to derive greenness trends, all thematic layers were set to “no data.” Letters A […]

Landsat-based maps showing greenness trends through the use of the Normalized Difference Vegetation Index (NDVI), which estimates the density of greenery in an area using the difference between visible and near-infrared reflectance of vegetation. Where there were not enough valid observations to derive greenness trends, all thematic layers were set to “no data.” Letters A to H represent ground validation sites.

Source

Adapted from Ju and Masek, 2016.