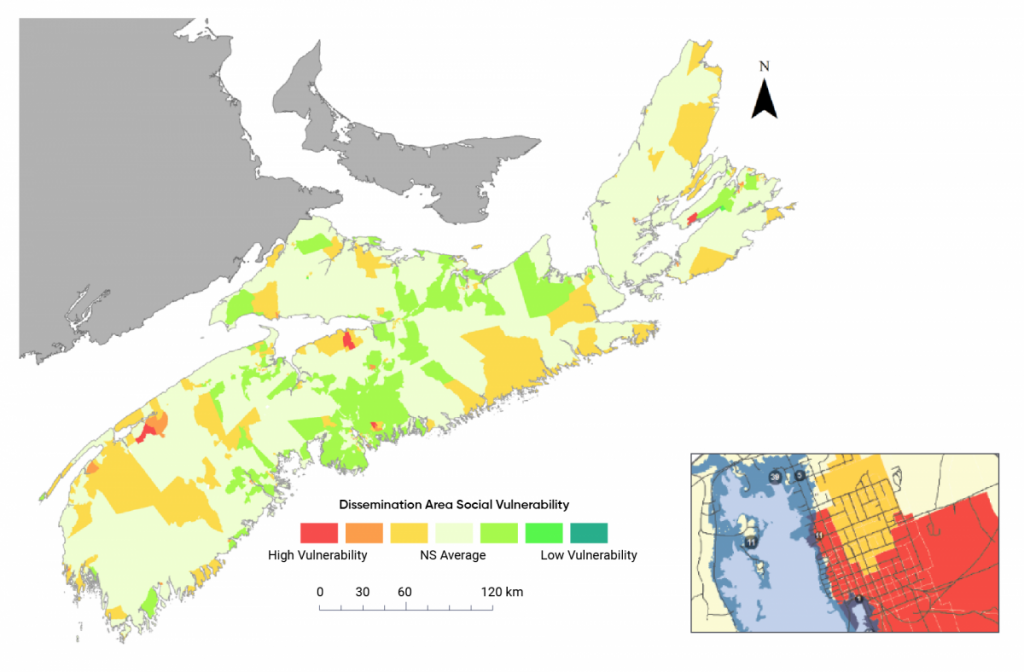
Map of Dissemination Areas in Nova Scotia showing levels of social vulnerability, based on a Social Vulnerability Index (SVI). The inset map from a coastal community illustrates the integration of the SVI mapping with a proxy representation (i.e., the dark blue overlay) of projected worst-case relative sea-level rise and storm-surge flooding to 2100. The inset map also shows a count of residential buildings and the distribution of roads within the proxy flood area.
Source
Government of Nova Scotia, n.d.; Richards and Daigle, 2011; Statistics Canada, 2011.