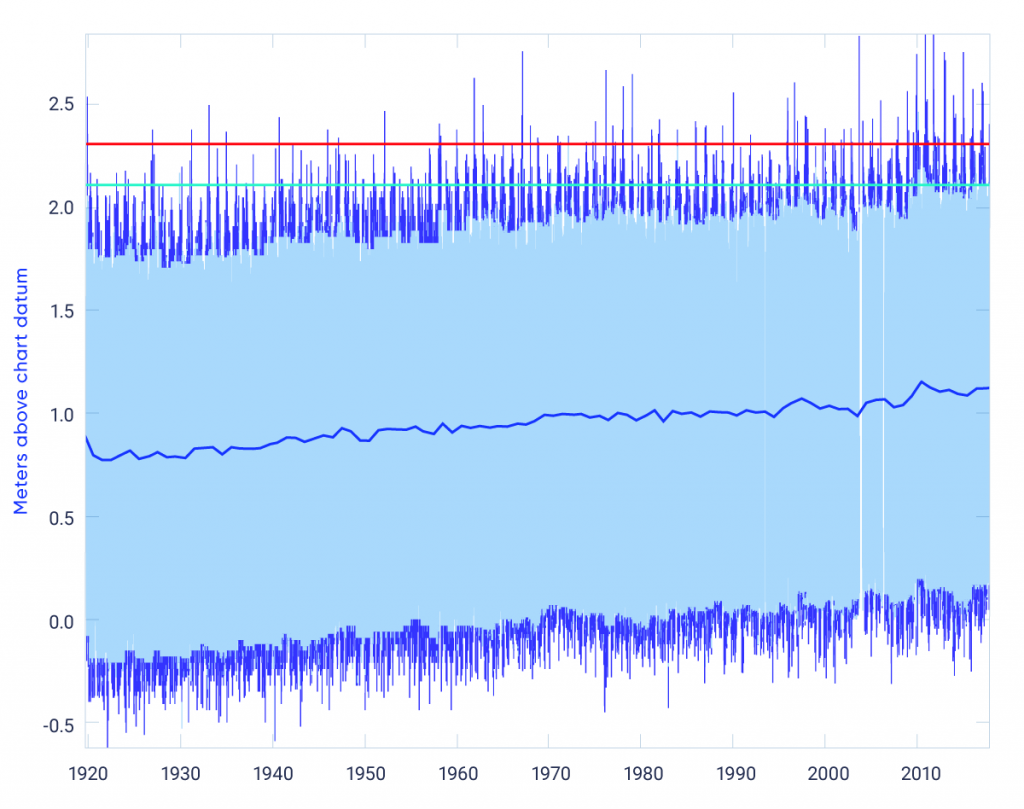
Hourly water levels recorded at Halifax Harbour for 1920 to 2018, with 5% extremes shown in dark blue and the 90% mid-range in light blue. Mean sea level (thick blue line) exhibits short-term variability superposed on a long-term increase throughout the record duration. Flood levels at 2.3 m (red line) and 2.1 m (aqua line) show increasing numbers of extreme water-level events throughout the record duration, a consequence of the rise in mean sea level. The number of events at the lower 2.1 m flood level (596) is much higher than at the higher 2.3 m level (131).