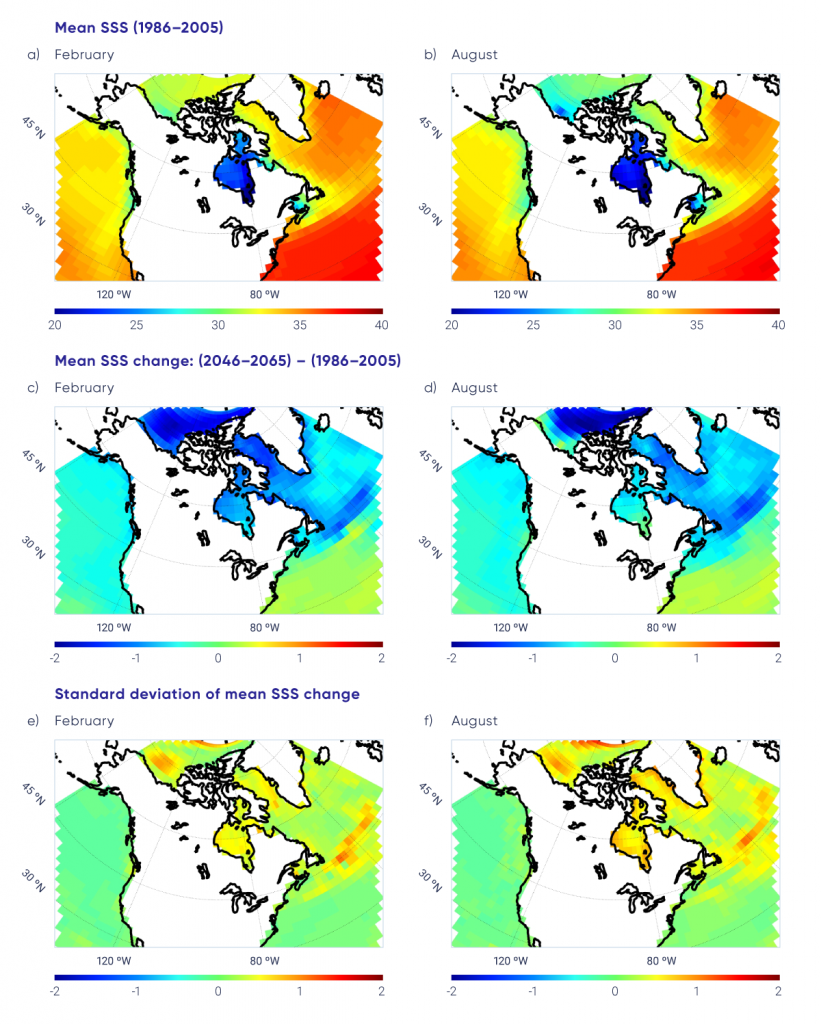
Figure-7.12: Future changes in salinity in the oceans surrounding Canada


Fifth phase of the Coupled Model Intercomparison Project (CMIP5) ensemble mean sea surface salinity (SSS) for the period 1986–2005 (top row) for February (a) and August (b). Change in the mean SSS for mid-century (2046–2065) relative to 1986–2005 for February (c) and August (d) for a high emission scenario (RCP8.5). Standard deviation in the SSS change for mid-century relative to 1986–2005 for February (e) and August (f). Panels (c) and (d) show a general freshening of the sea surface in the Northeast Pacific and in the Northwest Atlantic north of 40° north latitude (decrease generally less than 1). In the North Atlantic subtropical gyre, the projection indicates an increase in salinity (increase generally less than 1). In the Northeast Pacific, the standard deviation is small, indicating agreement among models. In many areas of the Arctic and Northwest Atlantic Oceans, the large standard deviation indicates larger discrepancies between model projections in these areas, where sea ice and complex ocean dynamics are important processes that are difficult to simulate.