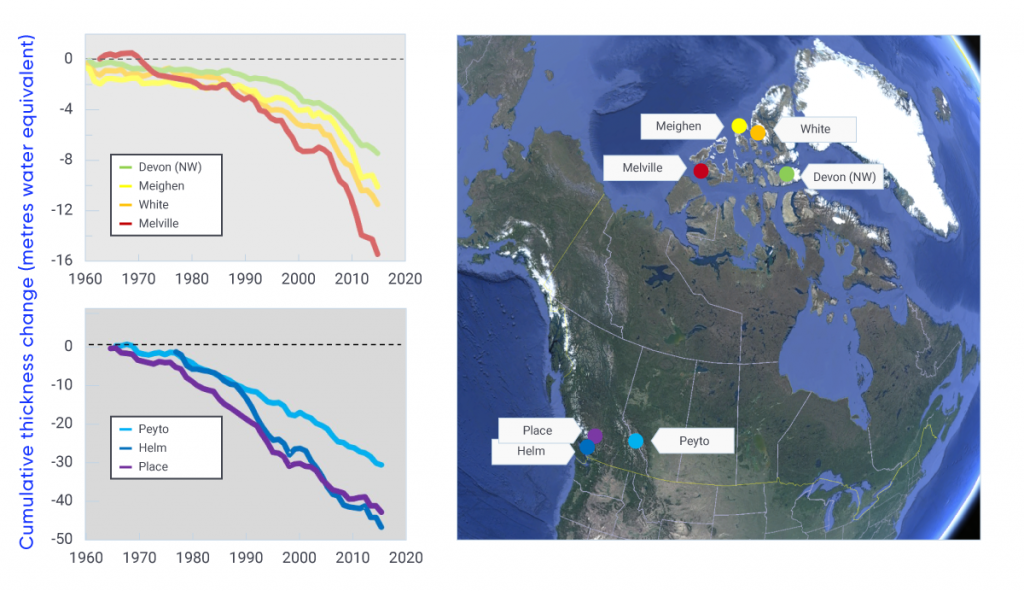
Map shows location of monitoring sites in the Canadian Arctic Archipelago and the Western
Cordillera (image courtesy of Google Earth). Graphs show change in cumulative thickness of reference glaciers in
the Canadian high Arctic (top left) and Western Cordillera (bottom left) since the early 1960s. Note the difference
in y-axis scale between graphs.