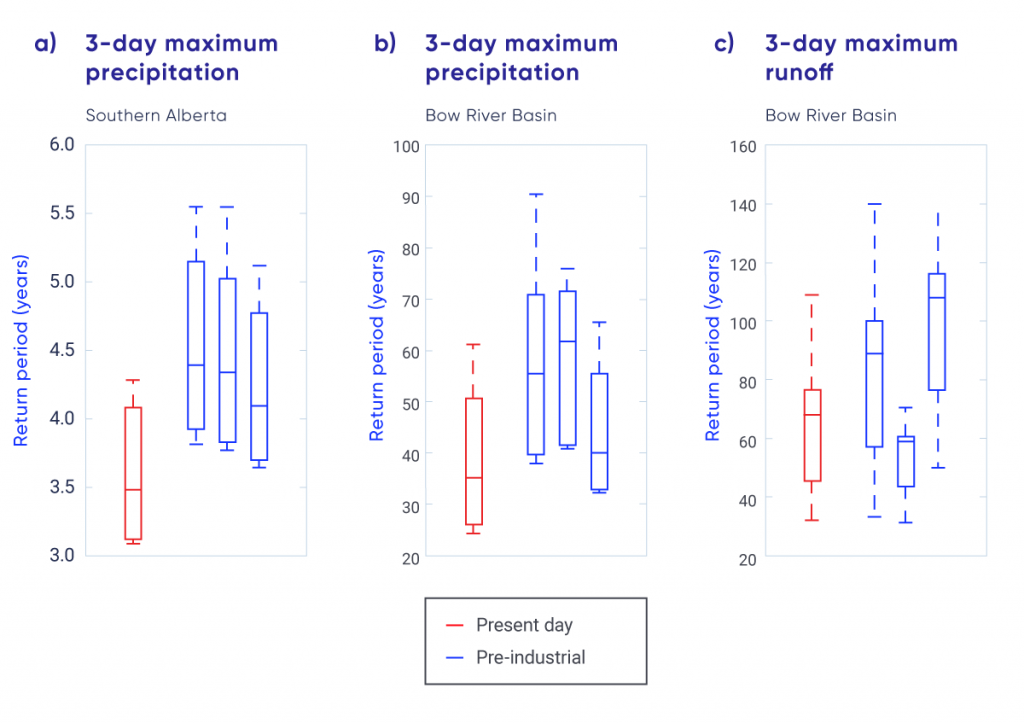
Return periods for the observed three-day maximum precipitation (a, b) and three-day maximum runoff (c) that led to the 2013 southern Alberta extreme flooding event. Present-day return periods are shown in red, and return periods from three pre-industrial simulations are shown in blue. Analysis is for the larger southern Alberta region (a) and the smaller Bow River basin (b, c). The box plots show the spread in the return periods across different estimates of the observed values from the reference simulations. The box boundaries indicate the range from the 25th to 75th percentiles, the middle line indicates the 50th percentile, and the whiskers extend to 1.5 times the width of the box or the most extreme value.