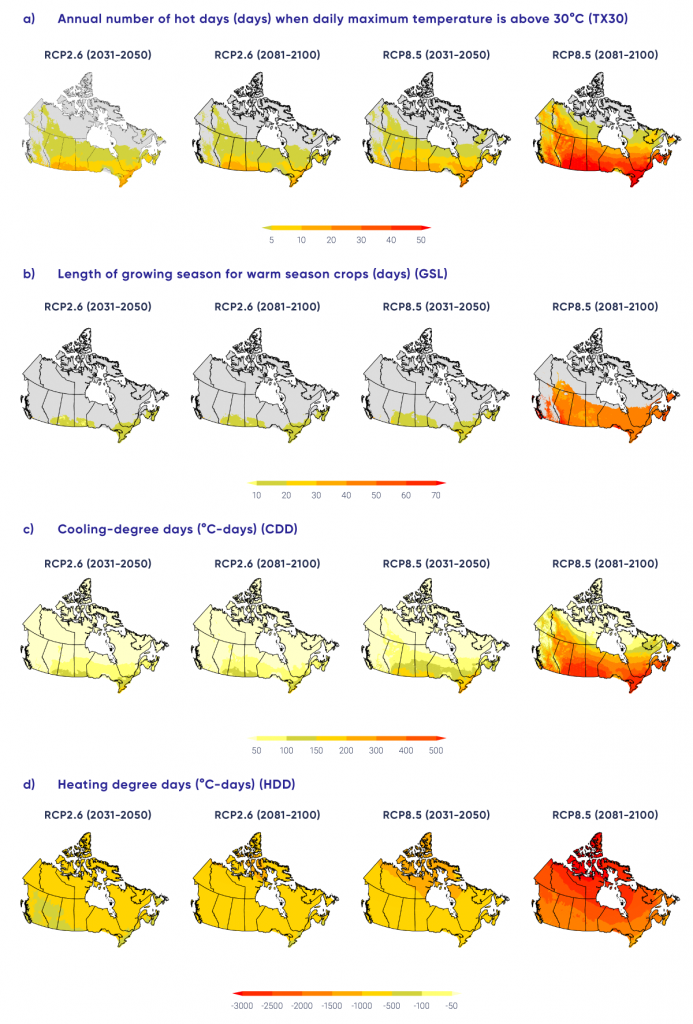
Multi-model median projected changes in (a) annual number of hot days (days) when daily maximum temperature is above 30°C (TX30), (b) length of growing season for warm-season crops (days) (GSL), (c) cooling degree days (°C-days) (CDD), (d) heating degree days (°C-days) (HDD). All maps are based on statistically downscaled temperature from simulations by 24 Earth system models. The two left-hand panels show projections for 2031–2050 and 2081-2100 under a low emission scenario (RCP2.6), while the two right-hand panels display projections for 2031–2050 and 2081–2100 under a high emissions scenario (RCP8.5), respectively. Areas with less than one hot day per year on average are marked with grey in panel (a), while areas without sufficient cumulative heat during the growing season to support growing warm season crops such as corn or soybean are maked with grey in panel (b).