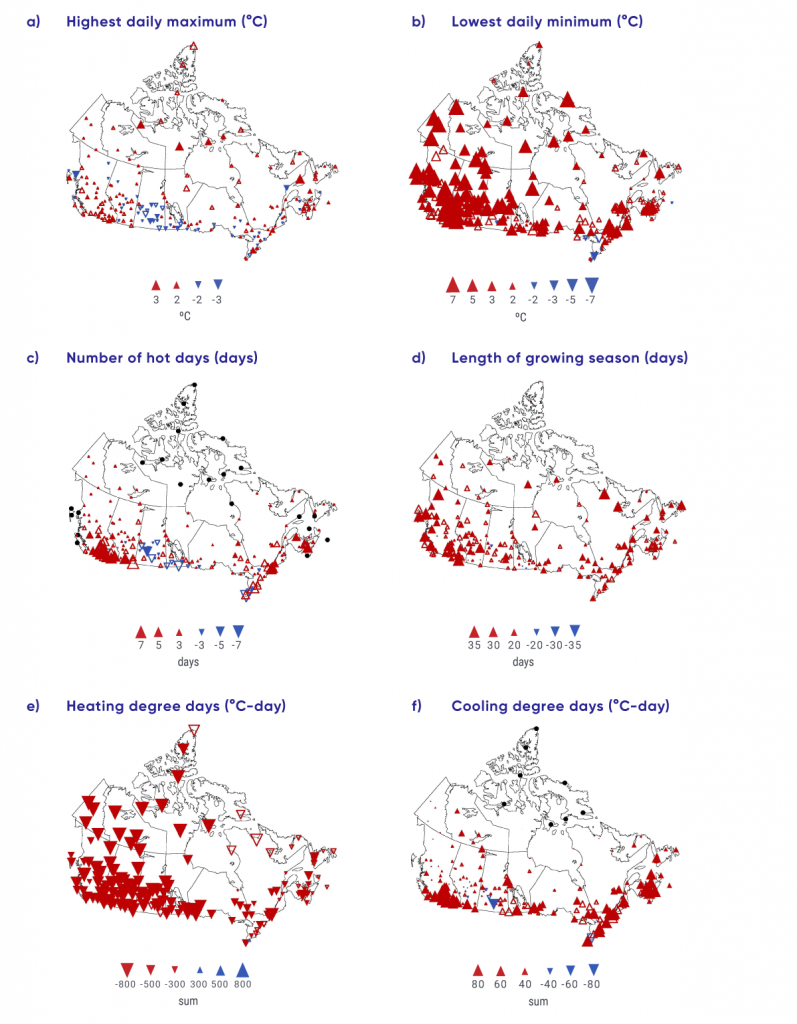
Observed changes in: (a) annual highest daily maximum temperature, (b) annual lowest daily minimum temperature, (c) annual number of hot days (when daily maximum temperature is above 30°C), (d) length of growing season, and (e) heating and (f) cooling degree days. Changes are computed based on linear trends over the 1948–2016 period. Filled triangles indicate trends significant at the 5% level. The black dots on (c) and (f) mark stations where hot days or daily mean temperature above 18°C do not normally occur. The legend may not include all sizes shown in the figure.
Source
Adapted from Vincent et al., 2018.