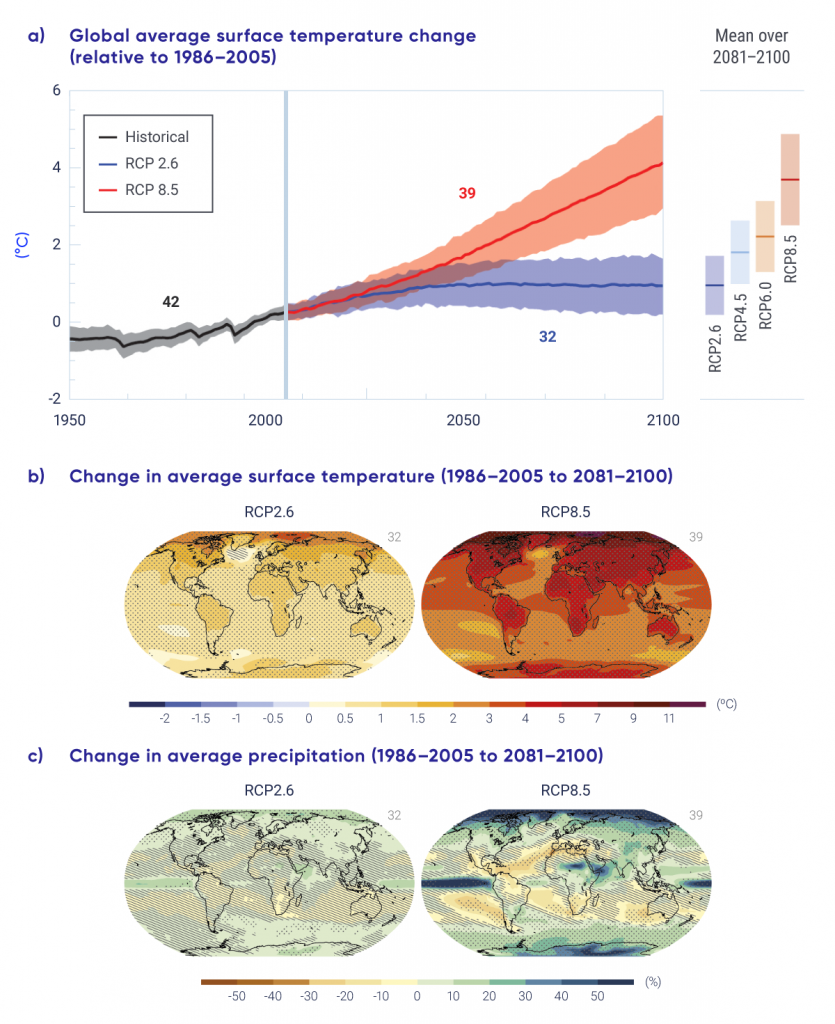
The upper panel shows the multi-model annual global mean surface temperature change relative to a historical reference period (1986–2005) for a range of emission scenarios. The shaded bands indicate the 5%–95% spread across the multi-model ensemble. The lower panels show the multi-model mean projected change by late century (the 2081–2100 average minus the 1986–2005 average) for annual (b) mean surface air temperature and (c) precipitation for the low emission scenario (RCP2.6) and the high emission scenario (RCP8.5).