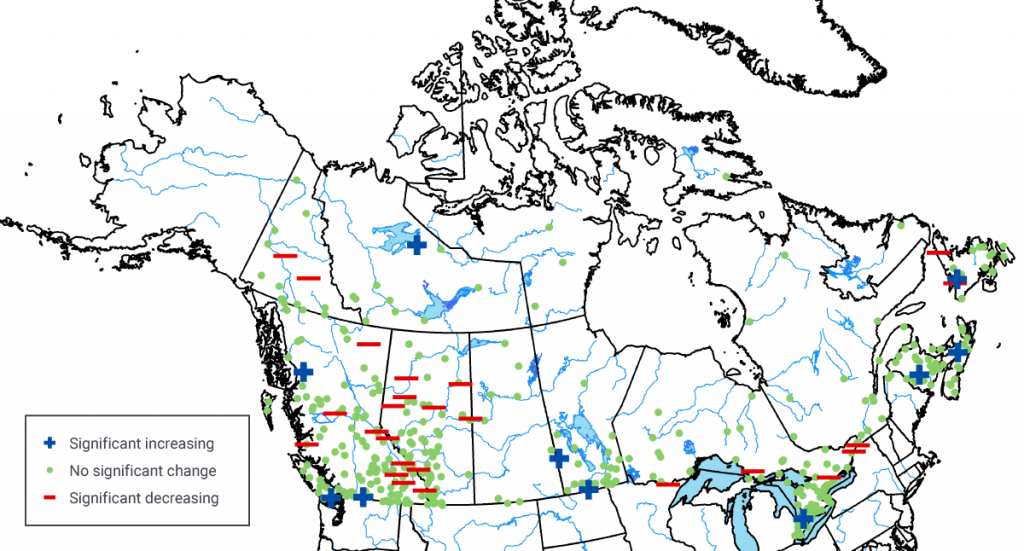
Summary of trends in one-day maximum flow in Canada using stations on unregulated streams from the Reference Hydrometric Basin Network (see Box 6.1). Significant trends denote that there is only a 5% possibility that such changes are due to chance.
Source
Modified from Burn and Whitfield (2016).