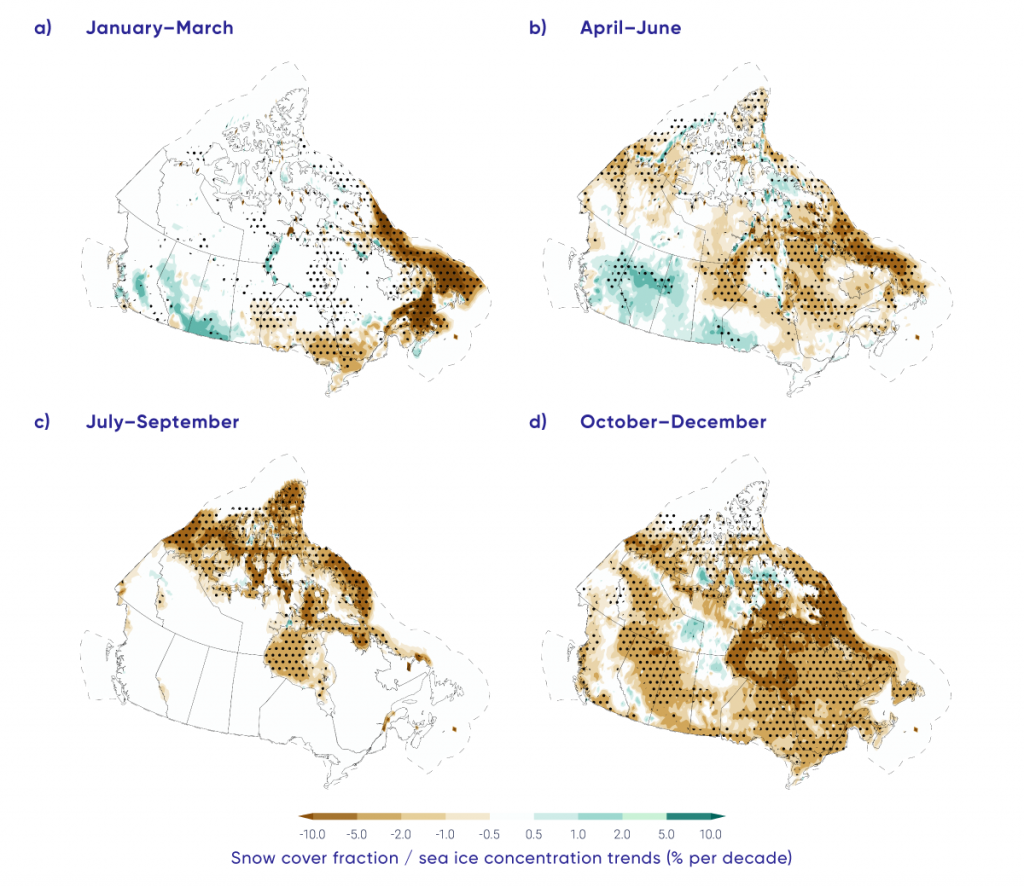
Terrestrial snow cover fraction and sea ice concentration seasonal trends for 1981–2015. Stippling indicates statistical significance (there is only a 10% possibility that such changes are due to chance). Dashed line denotes limit of Canadian marine territory. Changes in sea ice are discussed in Section 5.3.
Source
Figure source: Mudryk et al. (2018)