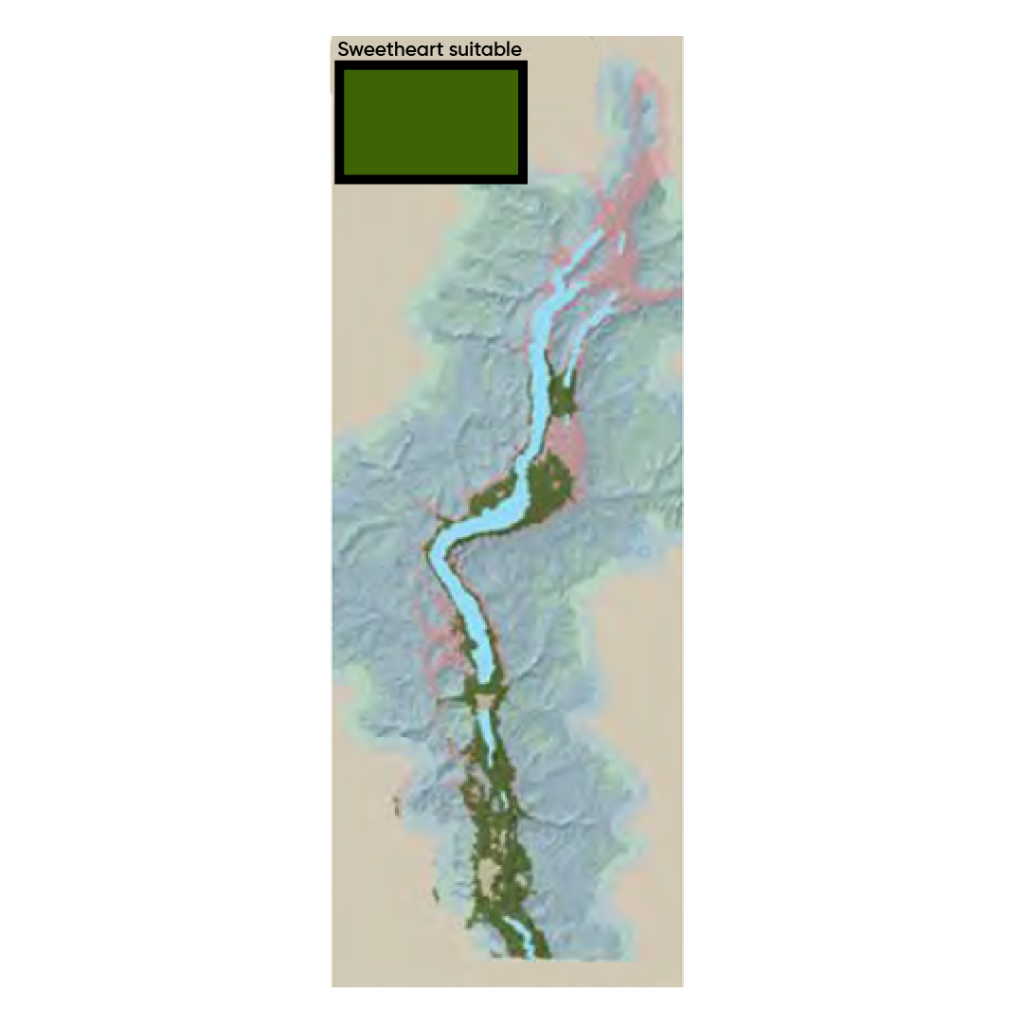
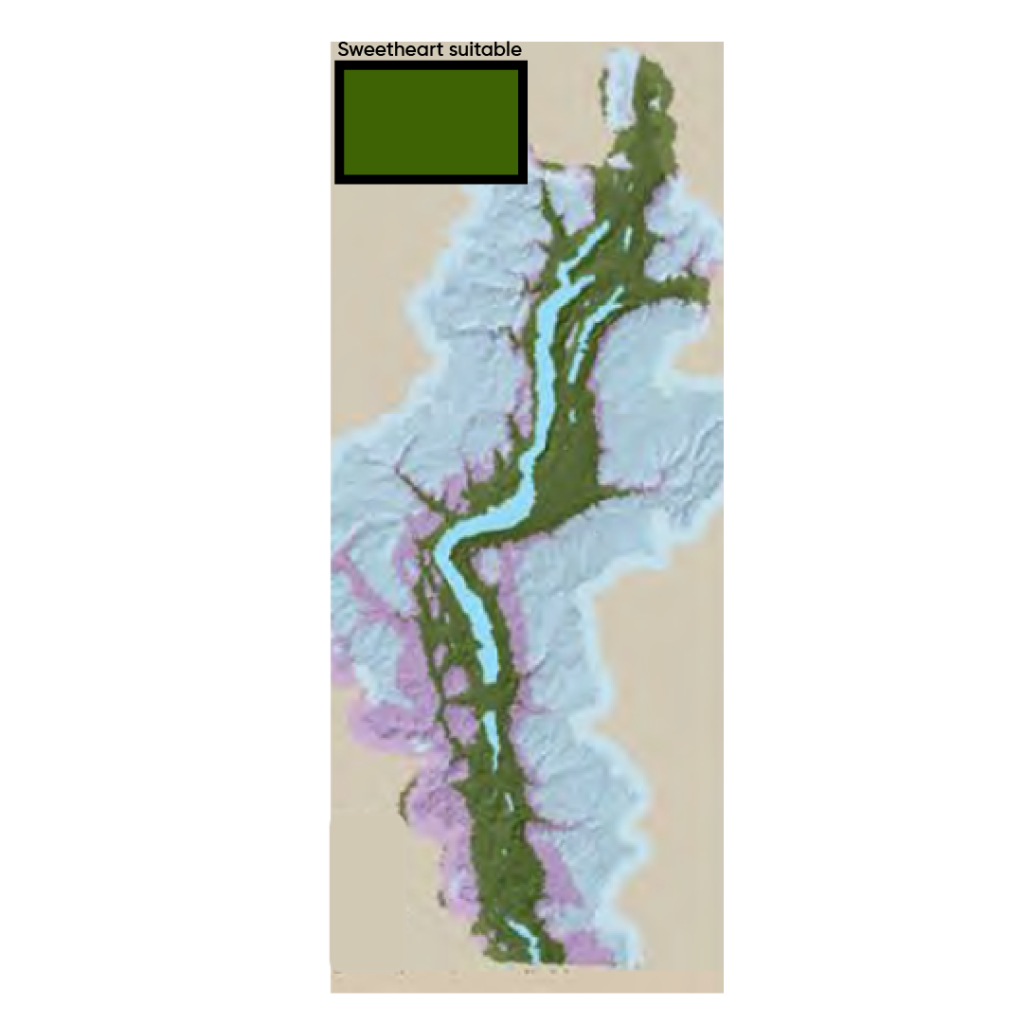
Expanding soil suitability for sweet cherry production in the Okanagan Valley comparing 1961‒1970 (left) and 2001–2010 (right).
Based on models published in Neilsen et al, 2017 .