Recommended citation

Boyd, R. and Markandya, A. (2021): Costs and Benefits of Climate Change Impacts and Adaptation; Chapter 6 in Canada in a Changing Climate: National Issues Report, (Eds.) F.J. Warren and N. Lulham; Government of Canada, Ottawa, Ontario.

Coordinating lead authors

  • Richard Boyd (PhD, All One Sky Foundation)
  • Anil Markandya (PhD, Basque Centre for Climate Change)
Figure 6.1
View details
Figure 6.2
View details
Figure 6.3
View details
Figure 6.4
View details
Figure 6.5
View details
Figure 6.6
View details
Figure 6.7
View details
Figure 6.8
View details
Figure 6.9
View details
Figure 6.10
View details
Figure 6.11
View details
Figure 6.12
View details
Figure 6.13
View details
Figure 6.14
View details
Figure 6.15
View details
Figure 6.16
View details
Figure 6.17
View details

Key Messages

Economic analysis helps to inform adaptation planning

Faced with limited resources and competing priorities, decision makers can use economic analysis to clarify trade-offs and make the case for allocating resources to specific adaptation actions by obtaining information on the costs and benefits of different options.

Climate change leads to a wide range of economic and social costs

Climate change results in a wide range of direct and indirect costs, with numerous economic and social implications. Actions to adapt to climate change can deliver significant benefits in other areas, as well as result in unintended costs.

Costs related to extreme weather events are increasing

Costs associated with damage from extreme weather events in Canada are significant and rising, largely due to growing exposure and increasing asset values. The scale of costs suggests that households, communities, businesses and infrastructure are not sufficiently adapted to current climate conditions and variability.

Future climate change costs for Canada will be high

While climate change will present some benefits for Canada, the associated economic impacts are overwhelmingly negative. Much of the available evidence covers only a subset of the full extent of potential economic impacts from climate change for Canada. Projected costs are likely very conservative.

Economic decision support tools help with assessing adaptation options

Economics offers a range of tools to help decision makers appraise adaptation actions, understand trade-offs and generate information on the costs and benefits of different options. The appropriate economic tool to use depends on the criteria for the adaptation decision, the nature of the climate change impacts and the level of uncertainty.

The benefits of adaptation actions in Canada outweigh the costs

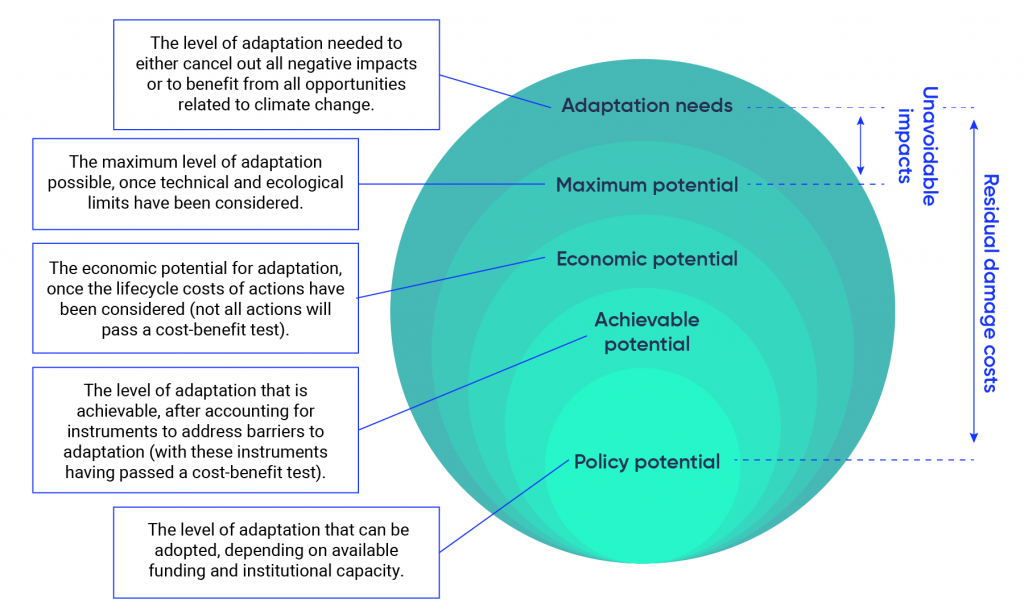
The benefits of planned actions to adapt to climate change in Canada generally exceed the costs, sometimes significantly, providing a strong business case for proactive investment in adaptation. Even when beneficial adaptations are adopted, residual damage costs are often still incurred, suggesting that there are economic limits to adaptation.

There are economic barriers and limits to adaptation

There is a range of ecological, technological, economic and institutional barriers to adaptation, which limit the potential to reduce negative climate change impacts and benefit from new opportunities. Government can play an important role in addressing these barriers, although an economically efficient level of adaptation will likely involve some residual costs.

6.1

Introduction

6.1.1

Introduction

Climate change already results in economic impacts and will do so increasingly in the future. These impacts affect different aspects of the economy, public health and the natural environment. Assessing the economic impacts of climate change is a complex undertaking, with considerable uncertainties surrounding the magnitude of future biophysical impacts and the monetary value of those impacts. Notwithstanding these difficulties, economists have been examining the relationship between climate change and economic impacts for over 20 years. In 2011, for example, the National Round Table on the Environment and the Economy (NRTEE) estimated the average future cost of a high climate change‒rapid growth scenario for Canada at $35‒$62 billion (2019 dollars) annually by 2050, with a 5% chance that costs could exceed $72‒$131 billion per year (NRTEE, 2011).

Information on the economic consequences of climate change, as well as on the costs and benefits of alternative courses of action, is increasingly being demanded by a wide range of private and public sector actors. This information is needed to inform resource allocation decisions in response to actual and projected climate change risks (National Research Council, 2010; 2009). Two generic response options are available: greenhouse gas (GHG) emissions reduction and adaptation measures (see Box 1.2 in Canada’s Changing Climate Report)—an effective and efficient policy response will require a mix of both options. Indeed, from an economic perspective, the total costs associated with climate change can only be minimized through a combination of GHG emissions reduction and adaptation actions (e.g., Agrawala et al., 2011; de Bruin et al., 2009a).

The economics profession has historically been more focused on GHG emissions reduction (Fankhauser, 2017), although the number of studies on adaptation costs and benefits is increasing. The Fifth Assessment Report of the Intergovernmental Panel on Climate Change (IPCC) dedicated an entire chapter to the economics of adaptation (Chambwera et al., 2014) and several other recent reviews have also focused on this subject (e.g., Kahn, 2016; Rouillard et al., 2016a; Markandya et al., 2014).

This chapter assesses the state of knowledge and practice on climate change impacts and adaptation economics in Canada. It focuses on answering the following questions: What do we know about the economic costs of climate change for Canada? What is the distribution of these costs across different regions, sectors and population centres? What are the costs and benefits of actions taken to moderate potential damages or to seize beneficial opportunities? And what economic tools and methodologies can be used by practitioners to address these questions? Decision makers need answers to these questions in order to allocate scarce public and private resources for climate change adaptation, and to ensure that these resources are directed towards the most efficient actions. This chapter will be of interest to a wide range of decision makers, economists and practitioners at all levels of government, and to businesses operating in climate-sensitive sectors.

6.1.2

Context

Over the last several decades, extreme weather events—such as wildfires, flooding, heat waves and storms—have caused billions of dollars in economic damages annually worldwide (Aon, 2020; Swiss Re Institute, 2020). Since 1980, cumulative damages worldwide have surpassed $4.9 trillion (2019 dollars)1 (Munich RE, 2020); the U.S. alone has sustained about $2.2 trillion (2019 dollars) in damages resulting from 265 weather and climate disasters over the last 40 years (National Centers for Environmental Information, 2020). Over a similar period, damages in Canada totalled about $31 billion (2019 dollars) (Public Safety Canada, 2020). Inflation-adjusted damages have also been trending upwards—globally, regionally and in Canada (see Section 6.4.2; Aon, 2020; National Centers for Environmental Information, 2020; Insurance Bureau of Canada, 2019).

Climate change has increased the likelihood of certain types of extreme climate and weather events occurring (Zhang et al., 2019; National Academies of Sciences, Engineering and Medicine, 2016) and is expected to intensify some events in the future (Bush and Lemmen, 2019). Unabated climate change is projected to result in hundreds of trillions of dollars in economic damages globally in 2100 (Warren et al., 2018)—both from the intensification of certain climate extremes and from the impacts of slow-onset climate trends (e.g., processes like sea-level rise and melting of permafrost). A recent study, for example, suggests that a persistent increase in average global temperature of 0.04°C per year (consistent with a scenario of no major policy changes and continued GHG emissions) will reduce global economic output per capita by about 7.2% below where it would otherwise be in 2100; projected declines in per capita output in the U.S. and Canada are higher still, at 10.5% and 13.1%, respectively (Kahn et al., 2019).

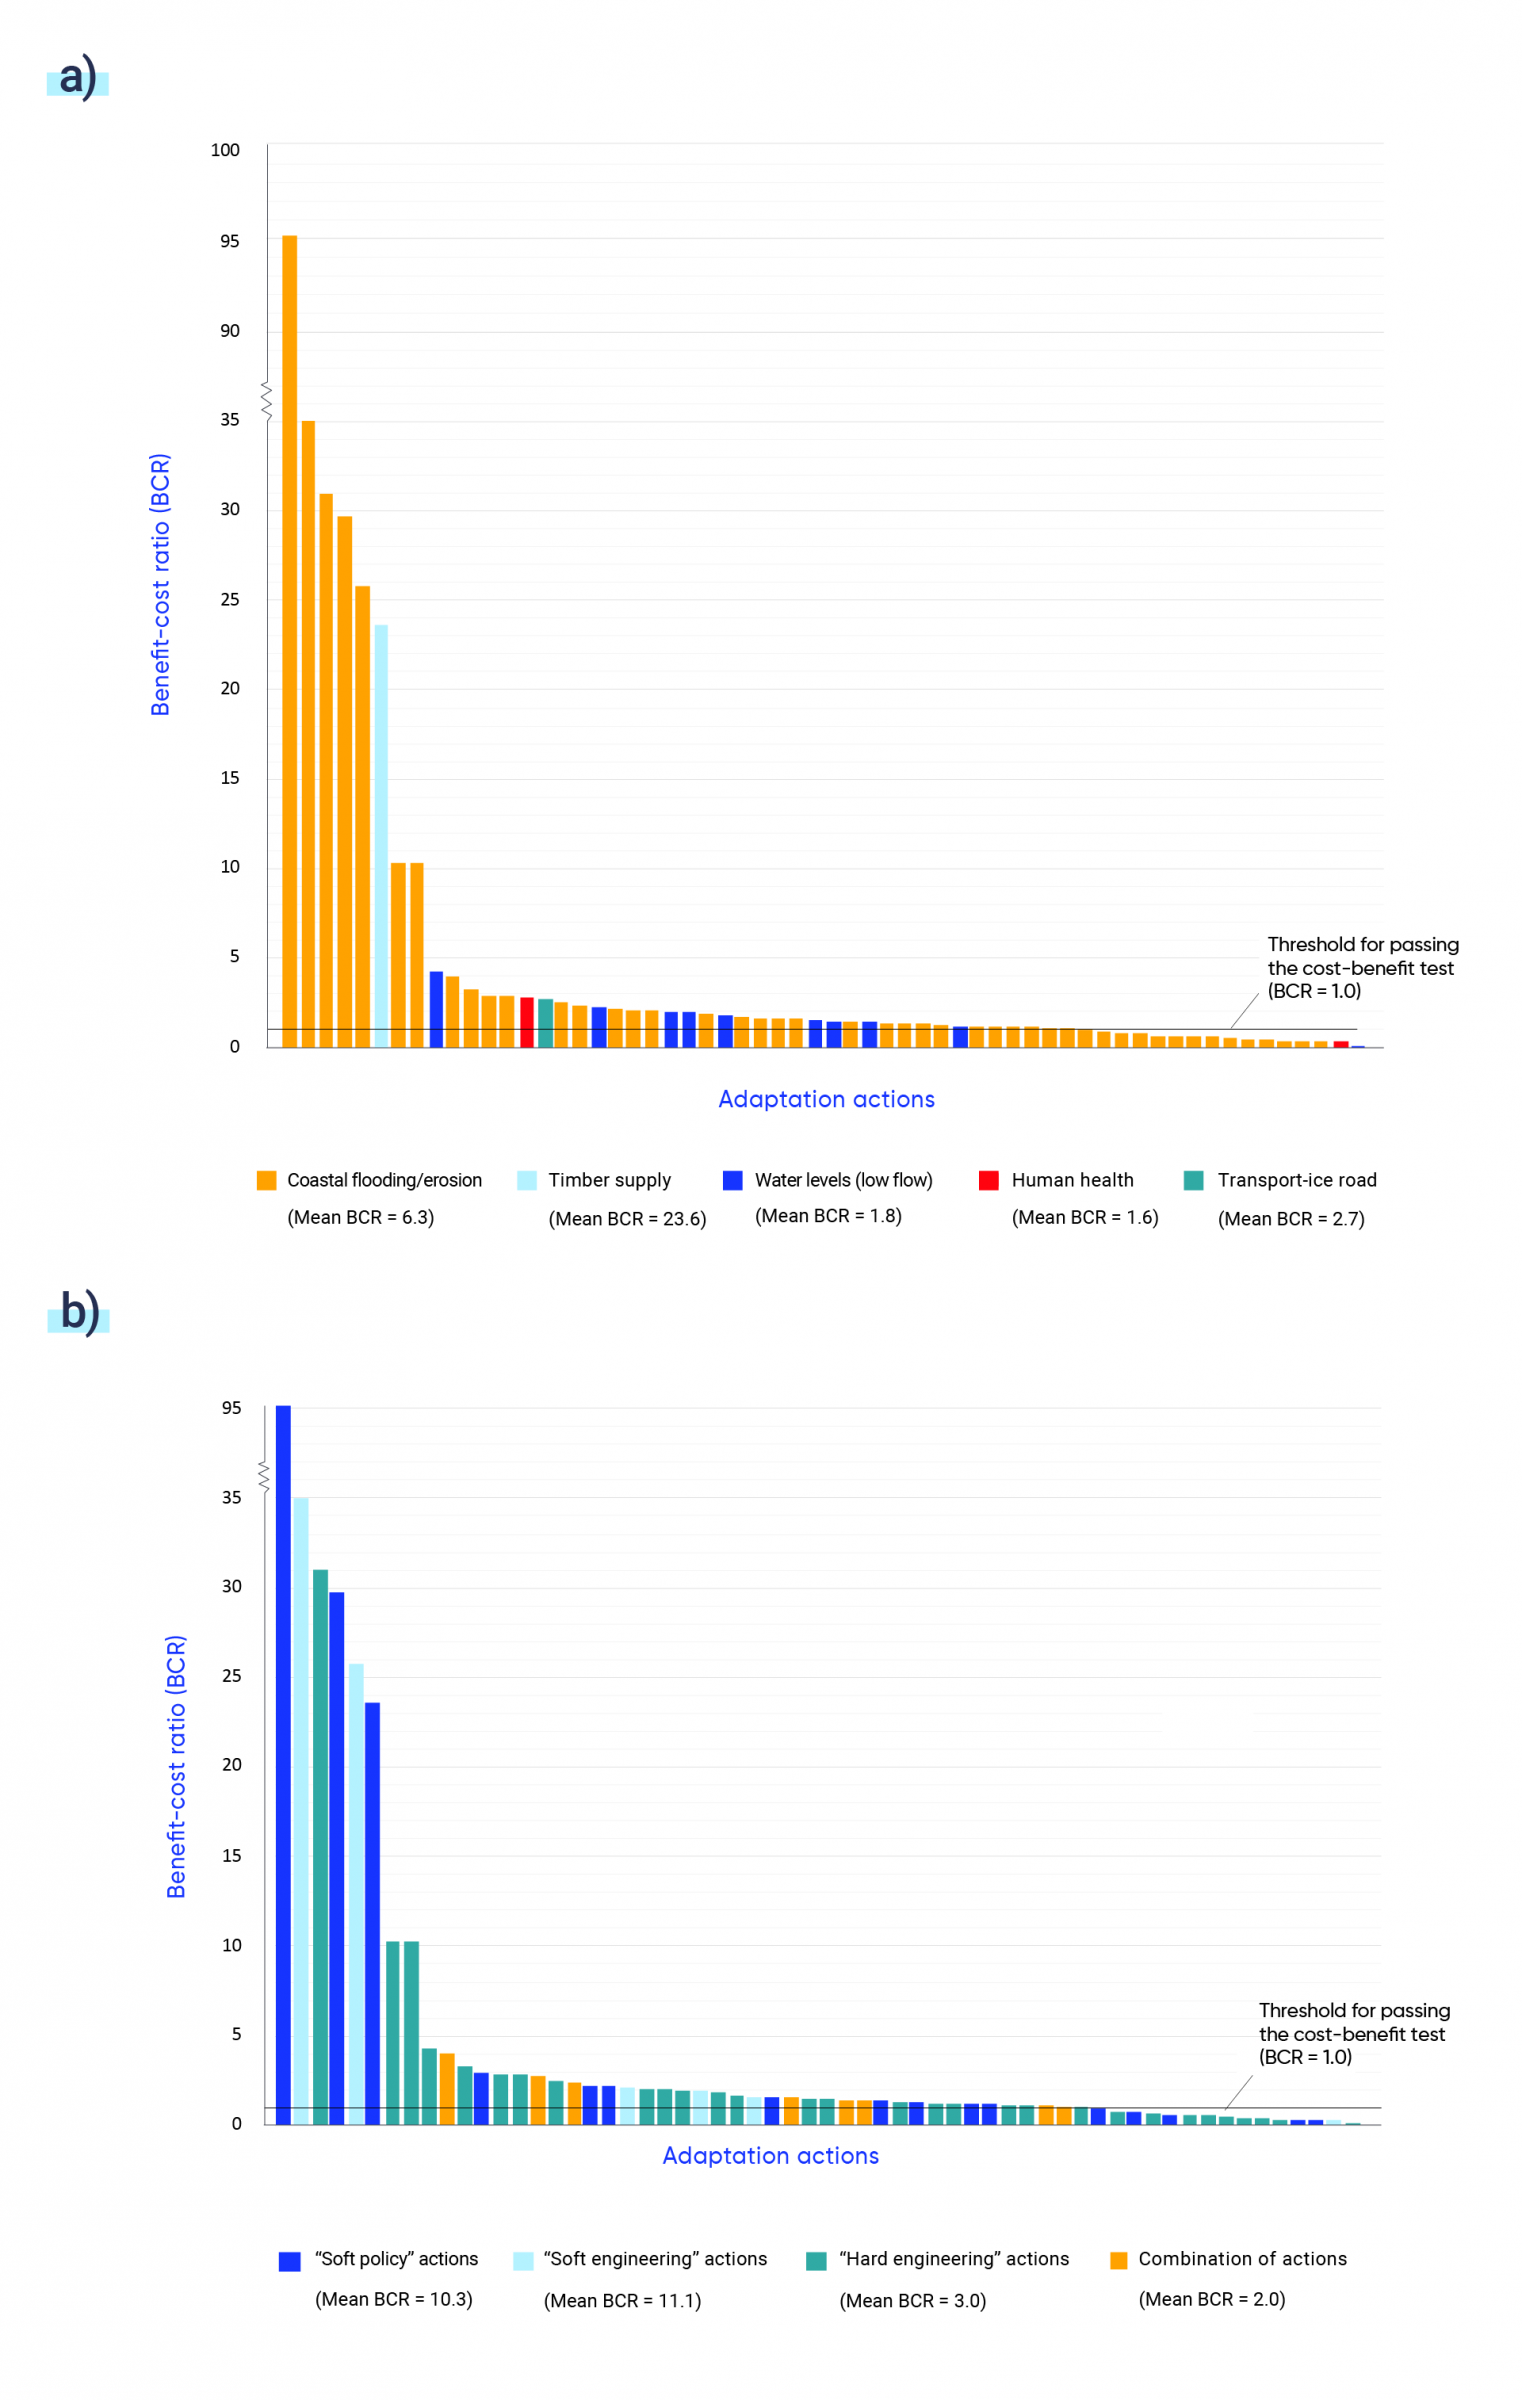
Adaptation can significantly reduce the projected costs of climate change by billions of dollars per year (U.S. Global Change Research Program, 2018), though it is unlikely to entirely offset economic damages (see Section 6.8.2). Ambitious policies to reduce global GHG emissions are also needed to limit the negative impacts of climate change (OECD, 2015; Agrawala et al., 2011; de Bruin and Dellink, 2011; Wang and McCarl, 2011). However, adaptation is not costless. Globally, it is estimated that investment needs for climate change adaptation in industrialized countries will reach US $29–$138 billion (2019 dollars) per year by 2030 (UNFCCC, 2007). Adapting coastlines and water, transportation and energy infrastructure in the United States could cost tens to hundreds of billions of dollars annually by 2050 (Sussman et al., 2014). In Canada, an investment of just over $5 billion (2019 CAD dollars) will be needed annually, on average, over the next 50 years to adapt municipal infrastructure (buildings, facilities, roads, etc.) to climate change (Insurance Bureau of Canada and Federation of Canadian Municipalities, 2020). The exponential shape of adaptation cost curves suggests that initial levels of adaptation can be achieved at relatively low cost, but that costs could be substantially higher in the long term as increasingly less cost-effective actions are required to achieve greater levels of adaptation (Agrawala et al., 2011). Nevertheless, judicious adaptation decisions can yield benefits—in the form of avoided damages—that far exceed costs (Global Commission on Adaptation, 2019; Lempert et al., 2018).

Given the potential magnitude of investment costs for climate change adaptation in the short and long terms, there is a need to provide decision makers with reliable economic information on costs and associated benefits to support adaptation investment decisions. Decision makers—whether in the public or private sector—face limited human and financial resources. They will not be able to pursue every prospective program or policy, and so must justify and set priorities for allocating available resources, including for climate change adaptation strategies and actions. In this regard, the field of economics can be of assistance, as it encompasses the study of how to efficiently allocate resources to meet desired goals. Specifically, economic analysis can help decision makers to weigh the costs of acting vs. the costs of inaction (i.e., continuing with a business-as-usual approach); to choose how much to invest in relation to competing priorities that are not climate-related; to decide which types of adaptation options, sectors and locations should receive resources; to balance near-term and long-term objectives; and, relatedly, to consider the impacts for future generations (Chambwera et al., 2014; National Research Council, 2010). Many adaptation benefits (i.e., avoided damages) will also deliver impacts in other areas, including health and safety, cultural heritage, ecosystem services and equity. Failure to include these types of non-market considerations in the decision-making process leads to underinvestments in adaptation. Economic analysis can be helpful in this regard as well, offering specialist techniques for capturing non-market climate change impacts in decision making.

6.2

Economic analysis helps to inform adaptation planning

Faced with limited resources and competing priorities, decision makers can use economic analysis to clarify trade-offs and make the case for allocating resources to specific adaptation actions by obtaining information on the costs and benefits of different options.

Information on the costs associated with climate change provides the impetus for action. Providing decision makers with the costs and benefits of adaptation informs the overall scale of investment in adaptation and the selection of specific measures. Economic analysis has evolved from focusing on cost-benefit analysis (CBA) to identify the “optimal” adaptation option towards providing tools to inform early action, with greater emphasis placed on the value of information, and the costs and benefits of capacity building and overcoming barriers to adaptation. Increasing emphasis is also being placed on the use of adaptive risk management frameworks and the need to better manage uncertainties.

6.2.1

Introduction

As decision makers become increasingly aware of the risks of climate change, there is growing demand for more effective ways to support adaptation decisions (Moss et al., 2014; National Research Council, 2010). The framing for adaptation planning has changed to meet these demands. With increased recognition of the need to manage uncertainty and develop practical early actions, there has been a shift towards a more policy-centric approach. Such an approach has the starting objective of climate change adaptation, as well as increased interest in the timing and sequencing of adaptation options, and the use of adaptive risk management frameworks for decision making (Rouillard et al., 2016a; Watkiss, 2015). These changes have important consequences for the use of economic analysis in informing adaptation decisions.

6.2.2

Entry points for economic analysis in risk management frameworks

Decision support in the context of climate change presents unparalleled challenges. Uncertainties associated with climate change—relating to how future social and economic systems will evolve; time lags between human activities and the response of the climate system; the dynamics of climate and biophysical systems; the diverse mix of potentially affected stakeholders; and autonomous adaptation by natural and human systems—make it hugely difficult to predict when and where climate change impacts will occur, as well as their relative importance (Chambwera et al., 2014; Jones et al., 2014; Heal and Millner, 2013). Regarding adaptation, these uncertainties are exacerbated at the regional and local levels, where many adaptation options are implemented. Adaptation decisions are complicated by further uncertainties relating to different stakeholder perspectives, multiple and competing objectives, long decision time frames, the choice of monetary values, and the broad range of adaptation options to select from (e.g., private or public, reactive or planned, stand-alone or integrated (“mainstreamed”) (Rouillard et al., 2016a; Jones et al., 2014; Li et al., 2014; Randall et al., 2012).

Consideration of uncertainty is fundamental to adaptation decisions and related economic analyses. Given the multifaceted and uncertain nature of adaptation decisions, the consensus view is that such decisions are best considered in an adaptive (i.e., iterative) risk management framework (Lempert et al., 2018; Jones et al., 2014; Moss et al., 2014; IPCC, 2012; National Research Council, 2010).

Adaptive risk management provides a framework in which potentially significant, but uncertain, consequences of current and future climate change and adaptation actions are continually identified, assessed, prioritized, managed and revised; this framework includes monitoring, which takes into account new information, experience and stakeholder input (Lempert et al., 2018; National Research Council, 2010). It entails an ongoing cycle of assessment, action, reassessment and response that will continue in perpetuity, rather than informing one-off decisions at a single point in time (Lempert et al., 2018; Willows and Connell, 2003). The National Research Council (2010) draws an analogy with decisions in a chess game, where pieces are repositioned and risk is reassessed in response to the opponent’s moves.

From an economic analysis perspective, adaptive risk management provides a useful framework for adaptation decision making. It allows for the use of a broad range of concepts, processes and decision support tools—including traditional tools like cost-benefit analysis (CBA), cost-effectiveness analysis (CEA) and multi-criteria decision analysis (MCDA) (see Table 6.4), as well as tools that are more adept at accommodating deep uncertainties, such as robust analysis and dynamic adaptation pathways (see Figure 6.3; Table 6.4; Moss et al., 2014). Importantly, adaptive risk management allows decision makers to consider a broad range of criteria (e.g., costs, benefits, co-benefits and co-impacts (see Section 6.3.4), equity, affordability, flexibility, robustness, etc.) when formulating adaptation strategies in the face of uncertainty (see Section 6.6.1).

The awareness, assessment and planning stages of a generalized adaptive risk management framework provide specific entry points for economic information, analysis and decision support (see Figure 6.1). During the awareness raising stage, information on the costs of inaction (i.e., the net cost reflecting the difference between economic damages and any beneficial opportunities arising from climate change) can be used to persuade decision makers of the need and urgency to allocate resources to adaptation planning. This information may include estimates of the scale of climate-related costs; the distribution of those costs across locations, sectors, population groups, etc.; and the time frame over which they are projected to become significant, if they are not already so. The same information can also be used by analysts and stakeholders to inform the prioritization of current and future climate risks and vulnerabilities during the assessment stage. Economic analysis also plays an important role during the planning stage, where it can be used to inform the overall scale of investment in adaptation; the selection, timing and sequencing of specific adaptation options; as well as the distribution of adaptation costs and benefits.

Figure 6.1

-

Circular figure shows the adaptive risk management framework, which is made up of five stages: awareness, assessment, planning, implementation, and monitoring and evaluation. The awareness phase involves defining the issue and objectives based on information about the net costs of climate change. The assessment stage involves establishing decision criteria, assessing climate and socioeconomic information, and assessing impact, vulnerability and risk information. The planning stage involves identifying vulnerability and risk priorities, identifying adaptation options, selecting the appropriate appraisal tool based on decision criteria, collecting and analyzing data, and appraising and prioritizing options. At various points in the planning process it may be necessary to go back several steps to improve data and modify tools or options. The implementation phase involves making, financing and implementing decisions. The monitoring and evaluation phase involves providing continuous monitoring, reviewing, and revising. The monitoring and evaluation phase leads back into the awareness phase, and the cycle repeats.
Figure 6.1

The generalized adaptive risk management framework for climate change adaptation comprises five stages: 1) awareness, 2) assessment, 3) planning, 4) implementation and 5) monitoring and evaluation. Not all feedback loops are shown in the figure for ease of presentation (e.g., between planning and awareness, and between planning and assessment).

Source

Adapted from Lempert et al., 2018; Rouillard et al., 2016a; and Meyer et al., 2015.

6.2.3

Shift towards policy-centric adaptation planning

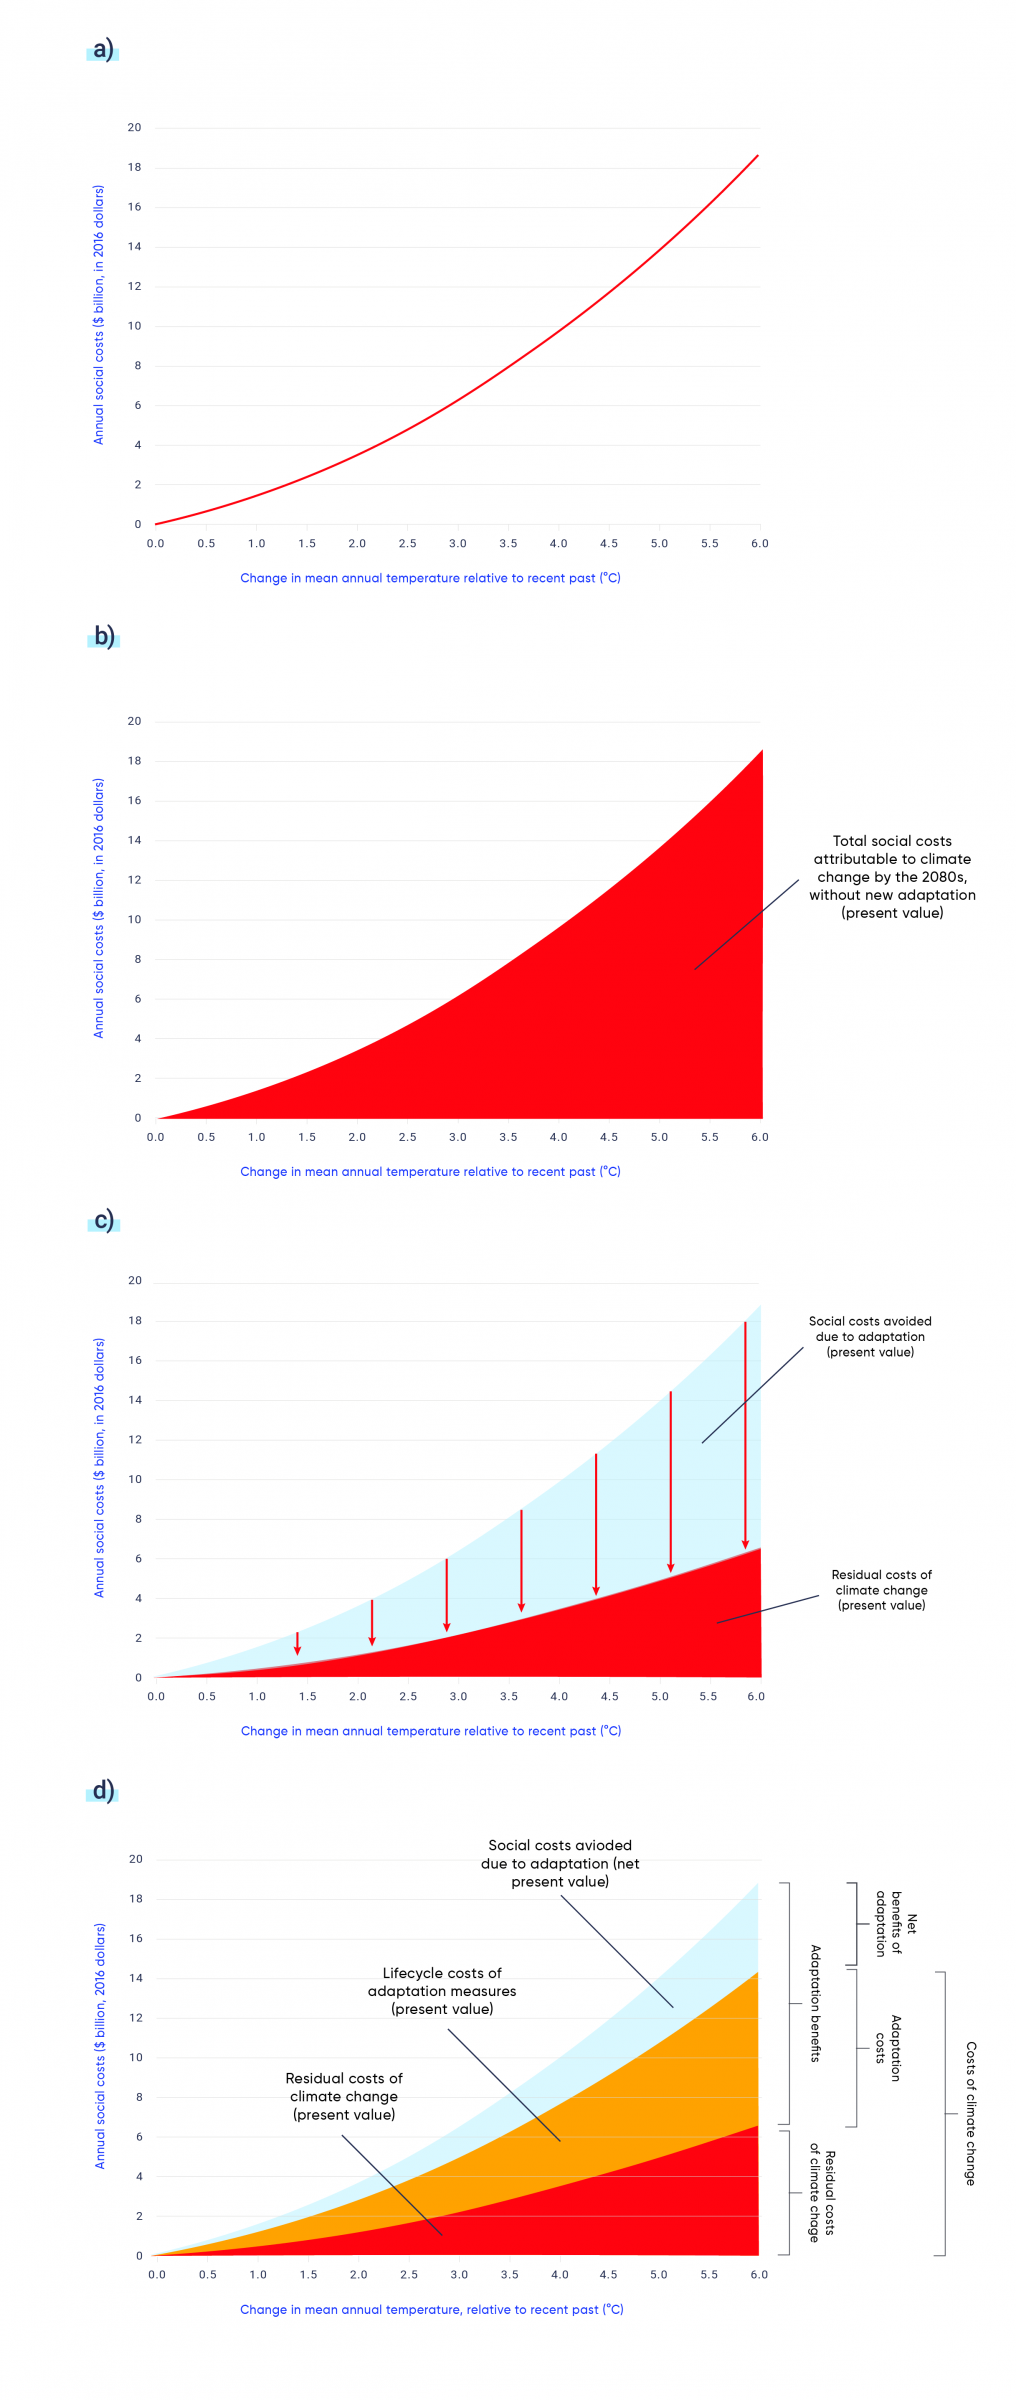
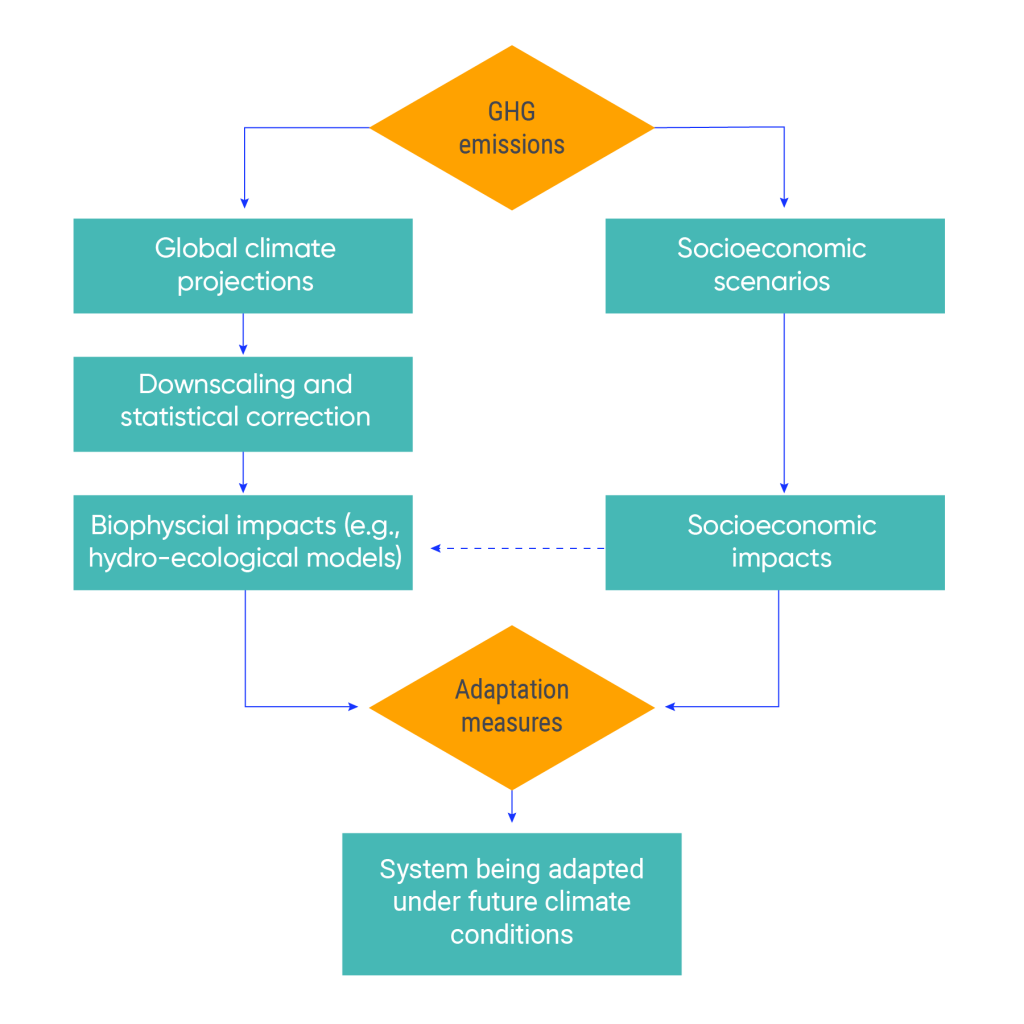
The assessment and planning stages of an adaptive risk management framework are typically navigated following one of two generic analytical processes (Jones et al., 2014). Historically, the predominant approach is based on a “science-first” (also known as “top-down”, “scenario-led” and “predict-then-act”) impact assessment-driven process (Gregory et al., 2012; Wilby, 2012; Ranger et al., 2010). This involves first defining impact pathways—climate change projections combined with socioeconomic information to assess future risks and costs—using impact models or damage functions (i.e., an empirical relationship characterizing the predicted change in monetary damages that is attributable to a change in a climate variable or index). The range of estimated risks is then used to frame the selection of adaptation options. Identified options are appraised as a final step in the process to determine the desired adaptation level, which is informed by adaptation costs, benefits and residual costs (i.e., the monetary damages attributable to climate change that will remain after adaptation) (Watkiss, 2015). With this approach, however, uncertainty is compounded at each stage of the analytical process (see Figure 6.2) and is seldom adequately characterized (Wilby, 2012). In the presence of such ballooning uncertainties, the range of plausible impacts and adaptation responses can become unworkable, rendering the “science-first” approach impractical (Dessai et al., 2009; Dessai et al., 2005). Further issues with the “science-first” process include the following: it does not adequately address non-climate drivers of impacts and risks; its long-term focus does not align with immediate policy needs to inform near-term adaptation decisions; it fails to consider the adaptation process itself and ignores potential barriers, transaction costs and baseline policies; and it tends to emphasize “hard” (i.e., engineered) adaptation options over “soft” options, like building adaptive capacity (Rouillard et al., 2016a; Watkiss, 2015; Patt et al., 2010).

Given the shortcomings of the “science-first” approach, there has been a shift in adaptation practice towards “policy-first” analytical processes (Rouillard et al., 2016a; Watkiss, 2015; Watkiss et al., 2015a; Downing, 2012). “Policy-first” approaches—also known as “bottom-up”, “assess-risk-of-policy” and “decision-centric” approaches (Pielke et al., 2012; Brown et al., 2011; Ranger et al., 2010; Dessai and Hulme, 2007)—place greater emphasis on adaptation as the starting objective, rather than considering it as the final step, which is usually the case in a traditional “science-first” impact assessment. With the “policy-first” approach, a significant amount of effort is devoted at the outset to characterizing the decision problem (e.g., a flood risk management plan). This includes first identifying relevant objectives, current practices, constraints and drivers of change, as well as stakeholder preferences and related decision criteria, all of which frame subsequent analyses. Next, the process involves assessing the vulnerability of the defined system to current climate, socioeconomic and policy conditions, before considering sensitivities to future stressors, including climate and non-climate related stressors (Ranger et al., 2010). Once the limitations of current practices are understood, alternative options are identified if necessary and assessed with respect to achieving the stated objectives across a range of plausible future scenarios. For instance, the Thames Estuary 2100 Project in London, U.K., (see Case Story 6.4) was one of the first large-scale infrastructure projects to adopt a “policy-first” approach to adaptation planning (Ranger et al., 2013).

Figure 6.2

-

Illustration of ballooning uncertainties along a “science-first” causal impact chain. The level of uncertainty increases as one moves along the chain (from left to right), leading to a high level of uncertainty in the cost and benefit estimates at the end of the chain. On the left-hand side of the causal impact chain are socioeconomic and emissions scenarios, followed by the response of the carbon cycle to different CO2 concentrations, global climate sensitivity, downscaling climate models to regional and local levels, then the range of models for assessing biophysical impacts and for assessing economic costs. Finally, the range of adaptation responses (with implications for effectiveness, costs and benefits) is the most uncertain variable.
Figure 6.2

Illustration of ballooning uncertainties along a “science-first” causal impact chain. The level of uncertainty increases as one moves along the impact chain (from left to right), leading to a high level of uncertainty in the cost and benefit estimates at the end of the chain.

Source

Adapted from Fussel, 2003.

Compared to the classic “science-first” approach, the “policy-first” approach has a number of advantages (Gregory et al., 2012; Pielke et al., 2012; Brown et al., 2011; Ranger et al., 2010; Wilby and Dessai, 2010; Dessai et al., 2009). For example, because the “policy-first” approach requires only climate information pertinent to the decision problem at hand and focuses the assessment on adaptation options that are acceptable given the objectives and constraints of a particular decision, the analysis is streamlined and targeted from the outset, which makes it less resource- and data-intensive, as well as less sensitive to ballooning uncertainties. Furthermore, because the analysis is context-driven and not unduly influenced by scientific modelling, it emphasizes “big picture thinking” and encourages decision makers to consider interactions with broader policy priorities and to seek adaptation options that deliver co-benefits with other policy areas.

6.2.4

Focus on early adaptation and the timing and sequencing of options

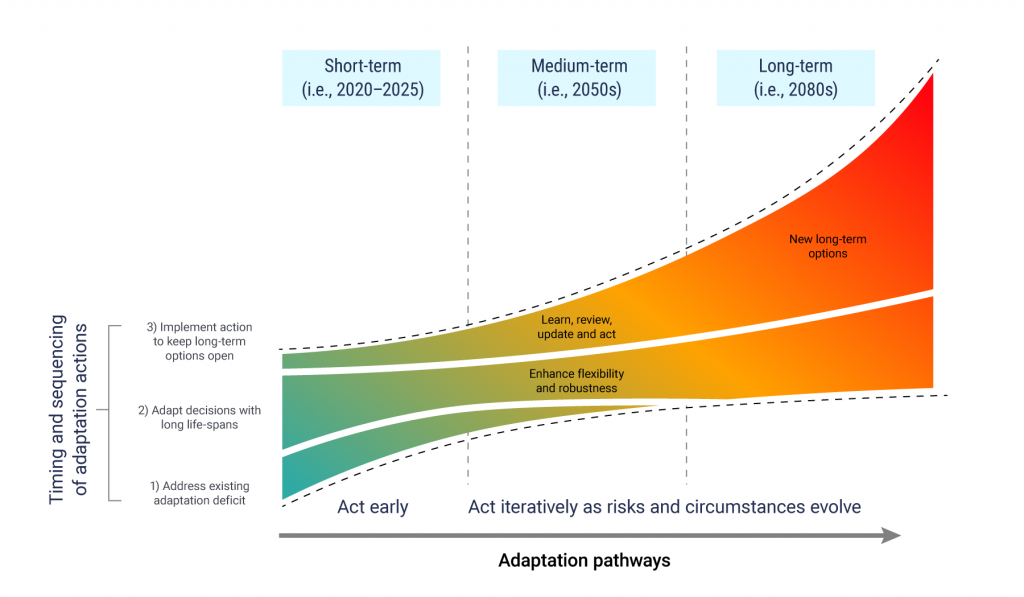
Alongside the shift towards a “policy-first” approach and the use of adaptive risk management frameworks, increased consideration is also being given to the timing and sequencing of adaptation as a further means to manage uncertainties (Wise et al., 2014). There has been a move away from viewing adaptation as comprising one single response (e.g., a wall to reduce future flood risk). Instead, there has been a shift towards viewing adaptation as a coherent package of options to address current vulnerabilities and to prepare for medium- and long-term climate change risks, with a focus on practical early implementation (Rouillard et al., 2016a; Watkiss, 2015). Packages of options will typically comprise three types of activities or building blocks for early action (Rouillard et al., 2016a; Watkiss, 2015; Watkiss et al., 2014):

  1. Actions to address the existing adaptation deficit: Immediate adaptation options that address risks arising today from current weather and climate extremes and, in so doing, also build resilience to future climate change. This would include “win-win”, “no-regret” and “low-regret” adaptation options that provide clear, immediate benefits or co-benefits.
  2. Actions to adapt decisions with long lifespans: Adaptations that are mainstreamed into near-term decisions that have long lifetimes (e.g., decisions relating to climate-sensitive infrastructure or land-use planning), and thus will be influenced by future climate conditions and future risks, in addition to current conditions. In contrast to the previous category, uncertainty over future benefits is a much bigger concern. As a result, greater emphasis is placed on using robust options (i.e., actions that provide future benefits under a range of plausible future scenarios) and flexible strategies that provide opportunities for learning, with options that can be delayed or brought forward, and/or scaled up or down as new information emerges over time.
  3. Actions to support long-term adaptation: This includes activities such as monitoring, surveillance, research and engagement, which immediately start building the capacity needed to support future actions to manage long-term climate impacts and risks. Examples include generating better information—which is required to inform later decisions about managing major, highly uncertain long-term risks—and actions that are needed to create a suitable policy and socio-cultural environment to enable and ensure that future options are still possible.

When viewed collectively as an integrated adaptation strategy, these three building blocks form a dynamic adaptation pathway (Haasnoot et al., 2018; 2013), as shown in Figure 6.3.

Figure 6.3

-

Illustration shows that adaptation pathways typically comprise three types of activities or building blocks. These adaptation pathways begin in 2020-2025 with actions that address the existing adaptation deficit, actions to adapt decisions with long life-spans, and implementing action to keep long-term options open. In the medium-term (for instance, in the 2050s) each adaptation pathway includes a stage to learn, review, update and act, and to enhance flexibility and robustness. In the long-term (for instance, in the 2080s) new long-term options must be identified as risks and circumstances evolve.
Figure 6.3

Illustration of the timing and sequencing of adaptation options within short, medium and long time frames along an adaptation pathway.

Source

Adapted from Watkiss et al., 2014.

6.2.5

Implications of changing practices for economic analysis

The shift towards a “policy-first” assessment process, coupled with greater emphasis on the timing and sequencing of adaptation, and use of adaptive risk management frameworks, has had significant implications for the economic analysis of adaptation strategies. Mainly, these changing practices have necessitated the development, application and refinement of alternative decision support tools. Traditional economic decision support tools (e.g., CBA, CEA) are adequate for appraising early actions to address the existing adaptation deficit, where uncertainty over future impacts is less of a concern. However, for mainstreaming adaptation into decisions with long lifespans—where consideration of climate and non-climate-related uncertainties over future drivers of change is much more important, and where decision makers are thus looking for robust options or flexible strategies—alternative economic decision support tools like real options analysis, robust decision making, portfolio analysis and dynamic adaptation pathways are more appropriate for appraising options (see Table 6.5). Use of these tools globally in a climate change adaptation context is still in its infancy, and they have yet to be formally applied in Canada (see Section 6.7.1).

Further consequences of these changing practices for the economic analysis of adaptation include:

  • With greater importance being placed on 1) mainstreaming and understanding the process of adaptation (including barriers to action), and 2) capacity building to ensure that long-term adaptation options remain possible (such as research, monitoring and institutional strengthening), there is an increasing need to assess the costs and benefits of non-technical options, including behavioural interventions to overcome barriers to change, and the value of information collated through monitoring systems. The characteristics of these options are different from those of outcome-based or engineered actions, with costs and benefits that are more challenging to measure and to include in economic analysis.
  • Likewise, the increased emphasis on no-regret and low-regret adaptation options places greater importance on the need to fully capture co-benefits in the economic analysis, which requires the monetization of a broader range of non-climate impacts, in addition to avoided climate-related damages.
  • Viewing adaptation strategies as a set of time-sequenced activities presents challenges for economic analysis, since each building block is unique and may require different information and methods for the quantification and valuation of physical impacts, and may entail resource implications for the analysis.
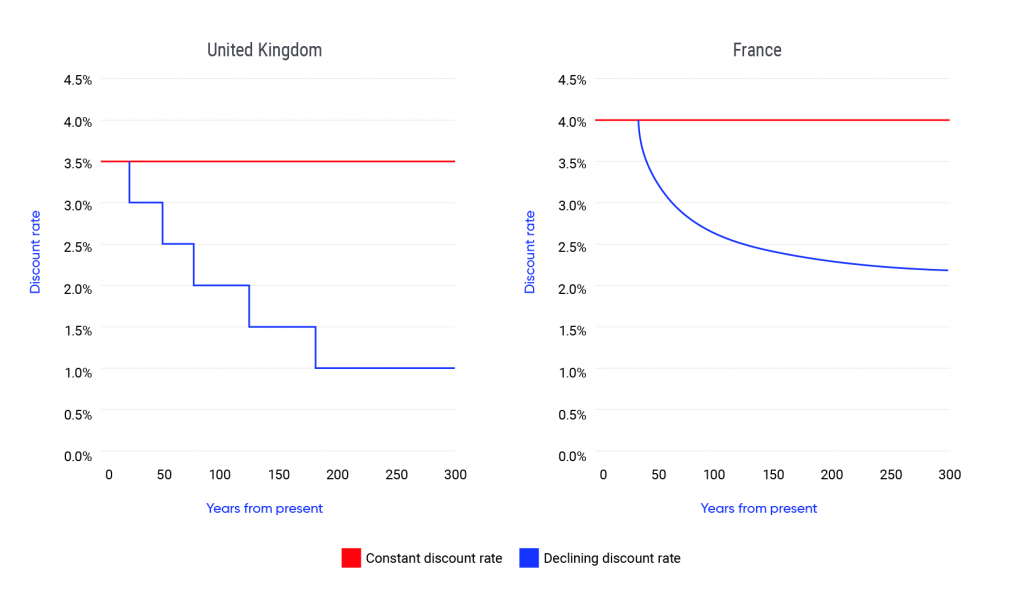
  • All economic analyses typically need to consider trade-offs between early costs and future benefits, rendering the results sensitive to the discounting process and choice of discount rate (see Section 6.6.3.2). Analysis of actions to address the current adaptation deficit will generally be less sensitive to discounting assumptions. However, for early actions to adapt long-life decisions and keep long-term options open over many decades, outcomes will be more sensitive to the discounting of future benefits, making it essential to consider alternative and inter-generational discounting practices.
6.3

Climate change leads to a wide range of economic and social costs

Climate change results in a wide range of direct and indirect costs, with numerous economic and social implications. Actions to adapt to climate change can deliver significant co-benefits in other areas, as well as result in unintended costs.

There is a wide spectrum of terms used to characterize the economic consequences of climate change impacts, including direct costs (e.g., damage from a flooding event) and indirect costs (e.g., disruption in service delivery), macroeconomic impacts (e.g., reduction in gross domestic product (GDP) growth) and losses in the welfare of affected populations. Adaptation actions can result in a range of co-benefits in other areas, but can also lead to unintended costs. The range of terms used in the literature—many of which overlap and are sometimes used interchangeably—can lead to confusion among practitioners and decision makers, and can also impede efforts to compare the estimated costs and benefits of different adaptation actions.

This section describes key cost and benefit terms as they are used in the remainder of this chapter, based on common definitions from the literature.

6.3.1

Direct and indirect costs

Typologies of the economic consequences of climate change impacts—specifically impacts arising from extreme events—often distinguish between direct and indirect impacts, similar to the literature on natural disaster impacts. Direct and indirect impacts can be negative or positive, giving rise to costs (i.e., from losses or damages) or benefits (i.e., gains), respectively. This section refers solely to costs, although it applies equally to benefits.

Direct costs arise from the physical impacts of climate hazards, such as damage or disruption to tangible goods and services that can be traded in a market and thus have an observed price (e.g., costs incurred to repair or replace damaged homes, medical treatment costs for heat stress, lost revenue from reduced crop yields, etc.). Direct costs also arise from physical impacts to intangible items not bought or sold in a traditional market and thus having no readily observable price (e.g., ecosystem services, stress or pain levels, and general quality of life). Economists have developed multiple techniques to allocate a “shadow price”—an estimated price for a good or service whose market price does not accurately reflect its actual value or for which no market price exists—to these intangible items, which are referred to as non-market impacts. When non-market impacts are rendered equivalent to market impacts using shadow prices, they can be substantial—perhaps larger than market costs (Nordhaus and Boyer, 2000). Omitting relevant non-market impacts from the economic analysis of adaptation strategies could substantially bias the outcomes.

Indirect costs stem from direct climate change impacts. When infrastructure, a building or a park is damaged or destroyed, this can interrupt normal use or service flows (e.g., a flooded shop may have to temporarily close for repairs). Damaged infrastructure may result in disruption to the delivery of critical services (e.g., electricity, water, sanitation), which may interrupt the operations of businesses that are not directly affected by climate hazards. Workers may also not be able to get to work if road networks or transit infrastructure have been affected. These impacts are referred to as business interruption costs (Kousky, 2012). Interactions between businesses may in turn result in secondary or multiplier impacts through the economy (e.g., a flooded shop that closed its doors for repairs will not need to purchase supplies until it reopens). Like direct costs, indirect losses can also be divided into market costs (e.g., business interruption costs) and non-market costs (e.g., delayed illnesses and mental health disorders, increased inequality, etc.). In contrast to direct costs, indirect costs often span a longer time period and take place over a wider spatial scale than the site of the direct physical impacts of climate change (Hallegatte, 2013).

The sum of all relevant direct and indirect, market and non-market costs provides one measure of the total economic impact of climate change. Interest often focuses on the overall net result—the sum of potentially positive and negative impacts—and whether climate change produces net costs or net benefits.

6.3.2

Macroeconomic costs

If the sum of direct and indirect market costs is sufficiently significant, it may impact macroeconomic indicators, such as consumer and producer price inflation, the unemployment rate and GDP. GDP measures the value of output in an economy, part of which reflects investment and part of which reflects consumption. The GDP impacts of climate change can be estimated directly using computable general equilibrium (CGE) models—large-scale numerical models that simulate the main economic interactions (e.g., those between different product markets) in an economy—or through supply and use tables available from Statistics Canada that capture all relevant direct and indirect market costs. Projected changes in macroeconomic indicators, like GDP, should be used only as a supplementary lens through which to view the economic consequences of climate change. Macroeconomic indicators capture the aggregated direct and indirect climate change impacts on the economy. Macroeconomic impacts, if estimated directly, should not be added to other estimates of direct and indirect market costs, as this would entail double counting (Ratti, 2017; Kousky, 2012). At the same time, focusing solely on aggregate macroeconomic indicators like GDP can be misleading from a distributional perspective. The spatial scale of an extreme weather event can be different from the scale over which GDP is measured. Significant losses for local populations may have no visible impact on national GDP, or even on provincial or territorial GDP. However, this does not imply that the impacts are negligible for the people who are affected. This particularly applies to disadvantaged populations or locations, whose economic output is generally invisible in aggregate macroeconomic indicators. A further distributional issue regarding the spatial scale of climate change impacts and the use of aggregate macroeconomic indicators is that losses at one location can be offset by gains at another.

6.3.3

Welfare losses

The theoretically correct measure of the economic consequences of climate change is the resultant change in the welfare of affected populations (Kousky, 2012; Stern, 2006; Nordhaus and Boyer, 2000). Estimating changes in a theoretical metric like welfare is nonetheless difficult in practice. Consequently, GDP is often used as a practical, though far from perfect, proxy for welfare (Diaz and Moore, 2017a, b; Jones and Klenow, 2016). In addition to the aforementioned problems with using GDP to measure climate change costs, GDP only captures the value of impacts to market goods and services. As noted above, non-market impacts can be substantial—perhaps larger than market costs. Failure to account for non-market impacts will lead to seriously underestimating welfare losses. The output of the economy, as measured by GDP, also does not directly affect the welfare of individuals—what matters most to people is consumption and the loss of consumer surplus (Hallegatte, 2013). In the aftermath of extreme events, GDP can increase as the amount of investment increases to repair damaged assets—while this might suggest an increase in welfare based on the above definition, welfare will actually fall since households are foregoing consumption that they would otherwise have enjoyed in favour of investment. As a result, a more appropriate proxy for welfare costs resulting from climate change is a measure of consumption loss, rather than output loss as measured by GDP. Notwithstanding these concerns, the welfare costs of climate change in monetary terms are sometimes expressed as a percentage of projected GDP, referred to as a GDP-equivalent impact (Vivid Economic, 2013).

6.3.4

Co-benefits and other co-impacts

When making adaptation decisions, it is essential to consider another category of impacts that are important from an economic perspective and are referred to as “co-impacts”—these are more commonly referred to as “co-benefits” when the impacts are positive. In addition to applicable lifecycle costs and avoided climate-related damages, adaptation options can give rise to various ancillary impacts of potential significance, known as co-impacts (Chambwera et al., 2014). Recognizing co-impacts in adaptation decisions is important, as evidence suggests that people are more likely to act on climate change if the related impacts associated with specific actions are highlighted (Bain et al., 2015).

Many different terms are used with reference to co-impacts, depending on whether they are positive or negative, and intentional or unintentional (Floater et al., 2016; Urge-Vorsatz et al., 2014). Intentionality refers to the degree to which co-benefits are explicitly pursued by the decision maker, as early no-regret and low-regret adaptation options are prioritized to manage uncertainty (see Section 6.2.3). In addition to avoiding climate-related damages, adaptation options can contribute to GHG emissions reduction and other non-climate policy objectives related to issues such as economic development, public health, sustainability and equity. Avoiding climate-related damages can be the secondary objective of GHG emissions reduction or non-climate policies, or can serve as one of a number of objectives to be pursued simultaneously as part of a coherent, integrated package of policies (Floater et al., 2016). For example, the use of green roofs in cities as a strategy for reducing urban heat also helps to manage storm water, sequester carbon and improve urban biodiversity. In this case, using green infrastructure to address the adverse health effects of heat waves also contributes to the co-benefits of reducing GHG emissions, flood management, and the delivery of ecological services (see Case Story 6.1).

A range of terms are used to describe negative co-impacts—which are treated as unintentional—including co-costs, ancillary costs, adverse side-effects and externalities (Urge-Vorsatz et al., 2014). Examples of negative co-impacts generated by adaptation options would include increasing GHG emissions, increasing risks to other groups or sectors that are not targeted by the option, or limiting future adaptation choices.

6.3.5

Private and social costs

The final set of economic terms commonly encountered in the literature relates to the perspective adopted by the decision maker for appraising adaptation options. The costs and benefits of adaptation options can be assessed from a social, as well as a private, perspective (Halsnæs et al., 2007). From a social perspective, where a public policymaker is looking for a socially optimal allocation of resources to climate change adaptation, the appraisal of adaptation options should consider co-benefits, as well as potential negative consequences alongside estimated lifecycle costs and avoided damages (Floater et al., 2016; Chambwera et al., 2014). In contrast, households and businesses will be interested in a narrower set of private costs and benefits when making adaptation decisions—specifically, those costs and benefits that accrue to the individual decision maker. These private costs and benefits (sometimes referred to as financial impacts) are typically based on actual market prices. To understand the importance of the difference between the two perspectives, consider, for example, a home damaged by a flood event, where some direct costs are reimbursed through the Government of Canada’s Disaster Financial Assistance Arrangements (DFAA) program. The private cost of the event to the homeowner is the difference between the repair costs incurred (not covered by private insurance) and the amount of aid received from the government. However, from the perspective of society, the aid represents a transfer payment from one taxpayer (a loss) to another (an equivalent gain); the loss and gain cancel each other out, leaving the full cost of repairs as a measure of the social cost of the flood event.

6.4

Costs related to extreme weather events are increasing

Costs associated with damage from extreme weather events in Canada are significant and rising, largely due to growing exposure and increasing asset values. The scale of costs suggests that households, communities, businesses and infrastructure are not sufficiently adapted to current climate conditions and variability.

 The number of extreme events has increased since 1983, although the distribution of these events across Canada varies significantly, with Alberta being affected the most. Studies on the attribution of such events in Canada indicate that climate change is increasing the likelihood of certain types of extreme weather events, and may be playing a role in the trend of growing losses from such events. However, the majority of rising losses related to extreme weather events are the result of growing exposure and rising asset values. The scale of costs suggests that there is an adaptation gap or deficit, whereby households, communities, businesses and infrastructure are not sufficiently adapted to current climate conditions and variability.

6.4.1

Introduction

Prior to reviewing evidence of the projected economic consequences of climate change for Canada, information on the costs of past severe climate and weather events is presented for context. Extreme events—such as heat waves, drought, flooding or strong storms—have the potential to cause extensive damage and impacts to people, buildings, infrastructure and the natural environment; severe weather causes tens of billions of dollars of damage each year worldwide (Aon, 2020; Swiss Re Institute, 2020). It is anticipated that climate change will intensify some types of extreme weather events in the future (Bush and Lemmen, 2019) and will contribute to rising damages in the coming decades. As a result, an appreciation of current vulnerabilities and gaps in preparedness in Canada is a good starting point for building a robust case for early action for climate change adaptation (see Section 6.2.3).

This section focuses on a single line of evidence—damages associated with weather extremes in Canada, as documented by the insurance industry. While extreme events might be the face of climate change, gradual trends in Canada’s climate (e.g., rising mean annual and seasonal temperatures, rising sea levels, melting glaciers and permafrost, etc.) may also be leading to impacts with important economic consequences, including recent problems with mountain pine beetle infestations in B.C. (Withey et al., 2015) and the spread of Lyme disease vectors (Ebi et al., 2017). Compared to the impacts of extreme weather events, evidence of the economic consequences of these slow-onset impacts is sparse. The information presented in this section provides only a partial picture of the economic costs of past climate-related hazards in Canada, recognizing that current risks from weather extremes are significant and rising, and warrant early action.

6.4.2

Global trends in damages

The insurance industry is a key source of information on the economic consequences of weather extremes. Large reinsurers, such as Munich RE and Swiss Re, monitor and record information on losses from natural catastrophes globally to evaluate the capacity of national and international reinsurance markets to absorb losses (see Box 6.1 for a description of key insurance industry terminology).

In 2018, weather-related natural disasters globally caused total economic losses of about $215 billion (2018 dollars USD), of which private insurers paid out a record $100 billion in losses (Munich RE, 2020). The global protection gap—the difference between insured losses and total losses—was therefore $115 billion (54% of total economic losses). These figures are similar to those produced by the Swiss Re Institute for 2018; estimated total economic losses and insured losses from weather-related natural disasters globally were, respectively, about $201 billion and $98 billion (2018 dollars USD), making the protection gap about $103 billion (or 51% of total economic losses) (Swiss Re Institute, 2019a). Both economic losses and insured losses in 2018 were higher than the corresponding inflation-adjusted annual average for the last ten years (2008–2018), which are $174 billion and $65 billion, respectively (Munich RE, 2020).

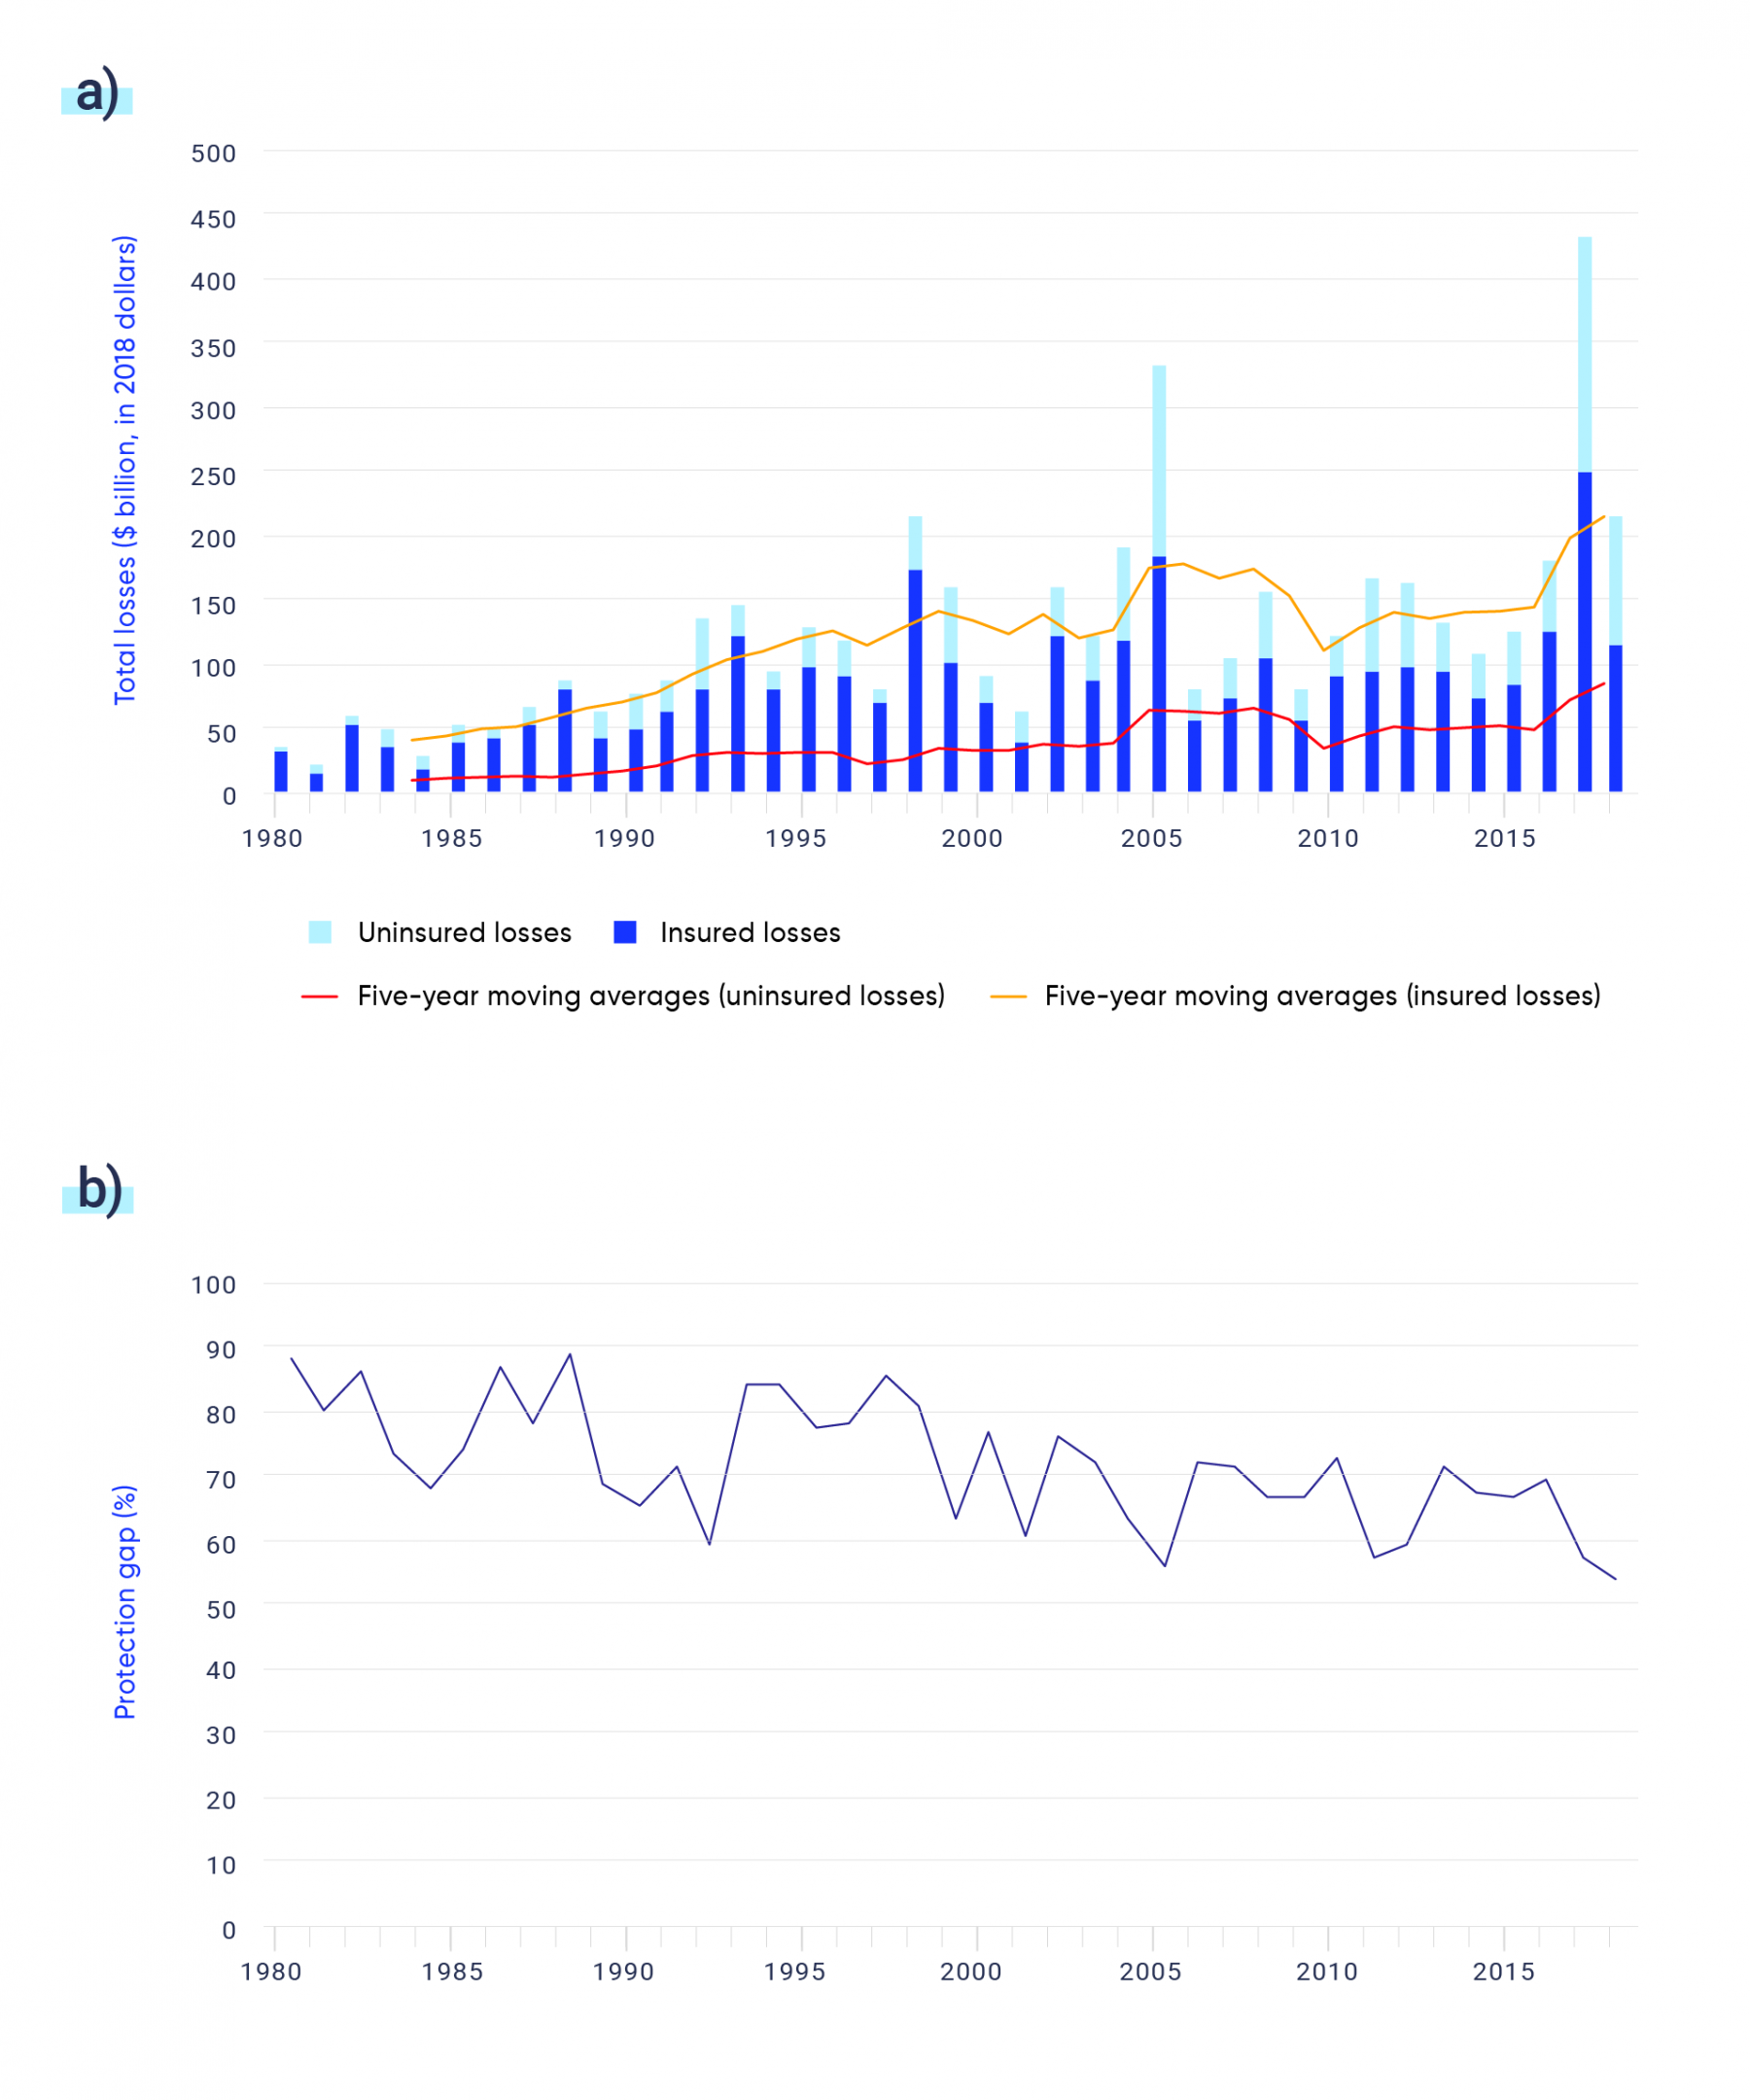
Globally, economic losses from natural disasters are rising. Overall losses and insured losses have been trending upward over the last several decades; this is evident in Figure 6.4, which shows worldwide loss data for the period 1980–2018 as recorded by Munich RE, the world’s largest reinsurance company. Loss data recorded by the Swiss Re Institute also shows rising economic damages from weather-related natural disasters worldwide (Swiss Re Institute, 2019a). In terms of five-year moving averages, overall losses recorded by Munich RE grew by 5.1% annually between 1980 and 2018, and insured losses grew by 4.3% annually. With growth in overall economic losses outpacing insured losses, the protection gap has risen in absolute dollar terms over time, although the gap is falling in percentage terms. Despite increasing penetration of relevant insurance products with a greater proportion of damages covered by insurance (Swiss Re Institute, 2019a), society is absorbing increasing residual losses from weather-related natural disasters.

Economic losses from natural disasters affecting the U.S. are also rising (e.g., National Centers for Environmental Information, 2020). For example, the frequency of billion-dollar disasters between 1980 and 2011 increased at about 5% per year (Smith and Katz, 2013). During the period of 1980–2019, the U.S. experienced, on average, 6.6 events annually; over the most recent 5 year period (2015–2019), the annual average number of billion-dollar disasters was roughly double, at 13.8 events (National Centers for Environmental Information, 2020).

Figure 6.4

-

Figure A is a bar graph that shows annual economic and insured losses (in 2018 Canadian dollars) from 15,788 weather-related events (for example, flooding, storms, wildfires, extreme heat, et cetera) worldwide that meet Munich RE’s NatCatSERVICE inclusion thresholds for dollar losses and fatalities over the period 1980 to 2017. Five-year moving averages of uninsured and insured losses are included as trend lines over the bar graph. The graph shows that insured losses tend to remain between 50 billion and 100 billion dollars. Uninsured losses appear to be growing since the 1990s. There are notable spikes in insured and uninsured losses in 1998, 2005, and 2017. Figure B is a line graph that illustrates the “protection gap,” which is the proportion of insured losses compared with total economic losses, highlighting the economic loss generated by catastrophes that are not covered by insurance. The protection gap changes year-by-year but remains between 50 and 90 percent, with a low point of 54 percent in 2018.
Figure 6.4

The figure shows annual insured and uninsured losses (in 2018 Canadian dollars) from 15,788 weather-related events (e.g., flooding, storms, wildfires, extreme heat, etc.) worldwide that meet Munich RE’s NatCatSERVICE inclusion thresholds for dollar losses and fatalities over the period 1980‒2017. a) The dark blue bars indicate the total insured losses and the light blue bars indicate the total uninsured losses from all weather-related loss events globally in each year. The combined light blue and dark blue bars indicate the total economic losses from all weather-related loss events globally in each year. b) This figure illustrates the “protection gap”—the proportion of insured losses compared with total economic losses—highlighting the economic loss generated by catastrophes that are not covered by insurance.

Source

Data source: Munich RE, 2020.

6.4.3

Damage trends in Canada

Public Safety Canada’s Canadian Disaster Database (CDD) monitors overall economic losses from significant meteorological and hydrological disasters, including payments made under the DFAA program (see below) and those made by private insurers. The Insurance Bureau of Canada (IBC) also tracks private insurance payouts for extreme weather events dating back to 1983. However, data on overall losses in the CDD seems incomplete considering that, in over half of the years since 1983, insured losses recorded by the IBC exceeded total economic losses in the CDD. Due to the incomplete nature of the economic loss data, the narrative below focuses only on insured losses. If the U.S. can be considered to provide a reasonable analogy for Canada, overall losses from weather extremes are roughly double the amount of the insured losses (Aon, 2020).

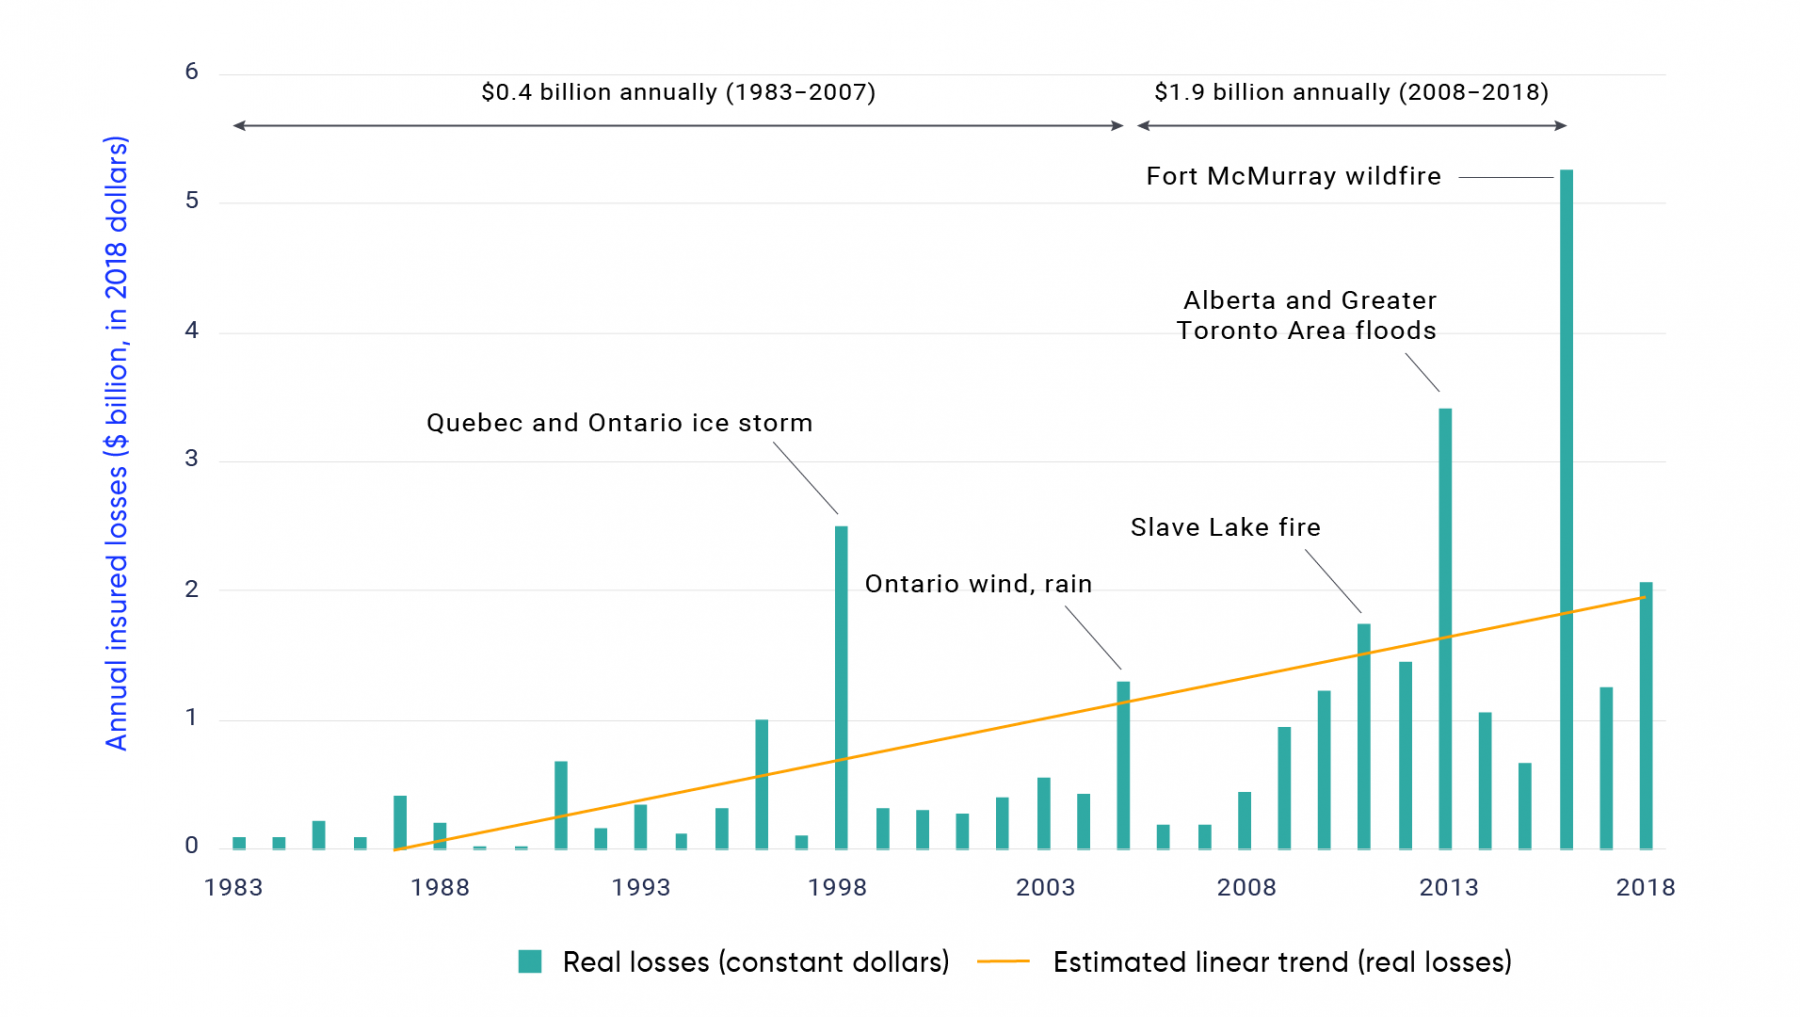
Insured losses in Canada have been rising since 1983, as is evident from the trend line in Figure 6.5. Between 1983 and 2007, annual losses averaged about $0.4 billion (2018 dollars); in contrast, over the most recent decade, losses have averaged about $1.9 billion per year (Insurance Bureau of Canada, 2018). The largest insured loss in a single year on record was $5.3 billion (2018 dollars) in 2016, with the wildfire in Fort McMurray and the surrounding area resulting in insurance payouts totalling $3.9 billion (Insurance Bureau of Canada, 2019).

Figure 6.5

-

Bar graph shows annual insured losses plus adjustment expenses (in 2018 dollars) from extreme weather events in Canada over the period 1983 to 2018. The height of the bars shows the total losses plus expenses from all extreme weather-related events in each year. Real losses spiked to 2.494 billion dollars in 1998 due to the Quebec and Ontario ice storm, 1.3 billion dollars in 2005 due to wind and rain events in Ontario, 1.74 billion dollars in 2011 due to the Slave Lake Fire, 3.418 billion dollars in 2013 due to the Alberta and Greater Toronto Area floods, and 5.261 billion dollars in 2016 due to the Fort McMurray wildfire. The solid yellow line shows the estimated upward trend in insured losses plus adjustment expenses. The line begins at 0 in 1997 and reaches approximately 2 billion dollars by 2018.
Figure 6.5

The figure shows annual insured losses plus adjustment expenses (in 2018 dollars) from extreme weather events in Canada over the period 1983‒2018. The height of the bars shows the total losses plus expenses from all extreme weather-related events in each year. The solid yellow line shows the estimated upward trend in insured losses plus adjustment expenses.

Source

Data source: Insurance Bureau of Canada, 2018.

Like insured losses, the number of extreme weather events has been increasing over time—the five-year moving average grew by about 7% annually between 1983 and 2018. In terms of the distribution of extreme weather events in Canada, Alberta was affected the most, with 55 events impacting the province over the period 1983‒2018, followed closely by Ontario, with 52 events. The Maritime provinces experienced the fewest events. Alberta is the epicentre of extreme weather events when it comes to losses—six of the ten largest insured loss events in Canada since 1983 occurred in this province (see Table 6.1).

Table 6.1

Top 10 most costly weather-related disasters in Canada, in terms of insured losses (1983‒2018)

Rank Date of event Affected area, province Weather-related event(s) Insured loss

($ million)*

1 May 3‒19, 2016 Fort McMurray, AB Fire 3,899.1
2 January 1998 Southern Quebec Ice storm 2,022.3
3 June 19‒24, 2013 Southern Alberta Flooding, water 1,737.4
4 July 8, 2013 Greater Toronto Area, ON Flooding, lightning, water 1,004.6
5 August 19, 2005 Southern Ontario Hail, tornadoes, wind 779.7
6 May 4, 2018 Hamilton, ON; Greater Toronto Area, ON; and Quebec Windstorm, water 680.0
7 May 15‒16, 2011 Slave Lake, AB Fire, windstorm 587.6
8 August 7, 2014 Central Alberta Windstorm, hail, lightning, water 582.3
9 August 12, 2012 Calgary, AB Hail, lightning, water 571.8
10 July 12, 2010 Calgary, AB Hail, flooding, windstorm, lightning 557.7
* All figures are in 2018 dollars.

Data source: Insurance Bureau of Canada, 2019.

As with payments from private insurers, the annual cost of the federal DFAA program has been rising since the 1970s (Office of the Auditor General Canada, 2016; Parliamentary Budget Officer, 2016). In the event of a disaster—and if the response and recovery costs exceed certain thresholds deemed acceptable for a province or territory to bear on its own—the Government of Canada provides financial assistance on a sliding scale through the DFAA program. Payments are made directly to provinces, which then distribute funds to individuals, businesses, non-profit organizations and local governments. Between 1970 and 1994, annual average DFAA payouts for hurricanes, convective storms, floods and winter storms averaged $56 million (2018 dollars) (Parliamentary Budget Officer, 2016). In contrast, annual average payouts averaged $303 and $427 million (2018 dollars) over the periods of 1995‒2004 and 2005‒2014, respectively (Parliamentary Budget Officer, 2016).

Long-term trends in losses have been interpreted as indicative of a contemporary adaptation deficit (Burton, 2009) and of increasing future climate-related risks (Hallegatte, 2014; Schipper and Pelling, 2006). There are many reasons for the observed adaptation deficit, including a range of market, behavioural and policy failures (see Section 6.8.1). The deficit has been increasing and is anticipated to widen with climate change (Burton, 2009), strengthening the case for early adaptation efforts.

6.4.4

What is influencing growing losses?

The observed increase in losses from weather-related disasters has led to questions about whether climate change is contributing to the trend (Bouwer, 2011). The IPCC, for example, suggested that the upward trend in historic losses provided indirect evidence of a potential climate change signal. However, some scholars argued that to make reliable comparisons between the losses of past and more recent weather-related natural disasters, it is necessary to control for changes in various socioeconomic factors that influence the magnitude of losses; otherwise, one is comparing apples to oranges (e.g, Pielke, 2007). The process of making adjustments for relevant socioeconomic and non-climate related factors is known as “loss normalization” (Swiss Re Institute, 2020; Pielke et al., 2003). Normalization helps to address the following question: “What would the magnitude of losses be if present-day assets and values were exposed to a historic event?” Analyses of normalized losses help to clarify the extent to which socioeconomic factors contribute to observed rising damages over time and, by inference, the role of other factors in shaping loss trends. One likely factor contributing to the trend of rising losses is improved and more comprehensive data collection over time; similarly, lower observed losses in the early 1980s may partly be explained by a lack of available data.

Studies that analyze time series of normalized economic and insured losses from weather-related disasters—whether they occur at a global or regional level—generate mixed results. Some studies find no significant upward trends, despite substantial increases in nominal losses (e.g., Bouwer, 2011; Neumayer and Barthel, 2011). Other studies find statistically significant long-term trends in losses (e.g., Gall et al., 2011; Schmidt et al., 2009). A recent study of normalized natural disaster losses globally uncovered strong evidence of a rightward skewing of the loss distribution and a corresponding increasing trend in the most extreme damages, but weaker evidence for an increasing trend in mean losses (Coronesea et al., 2019).

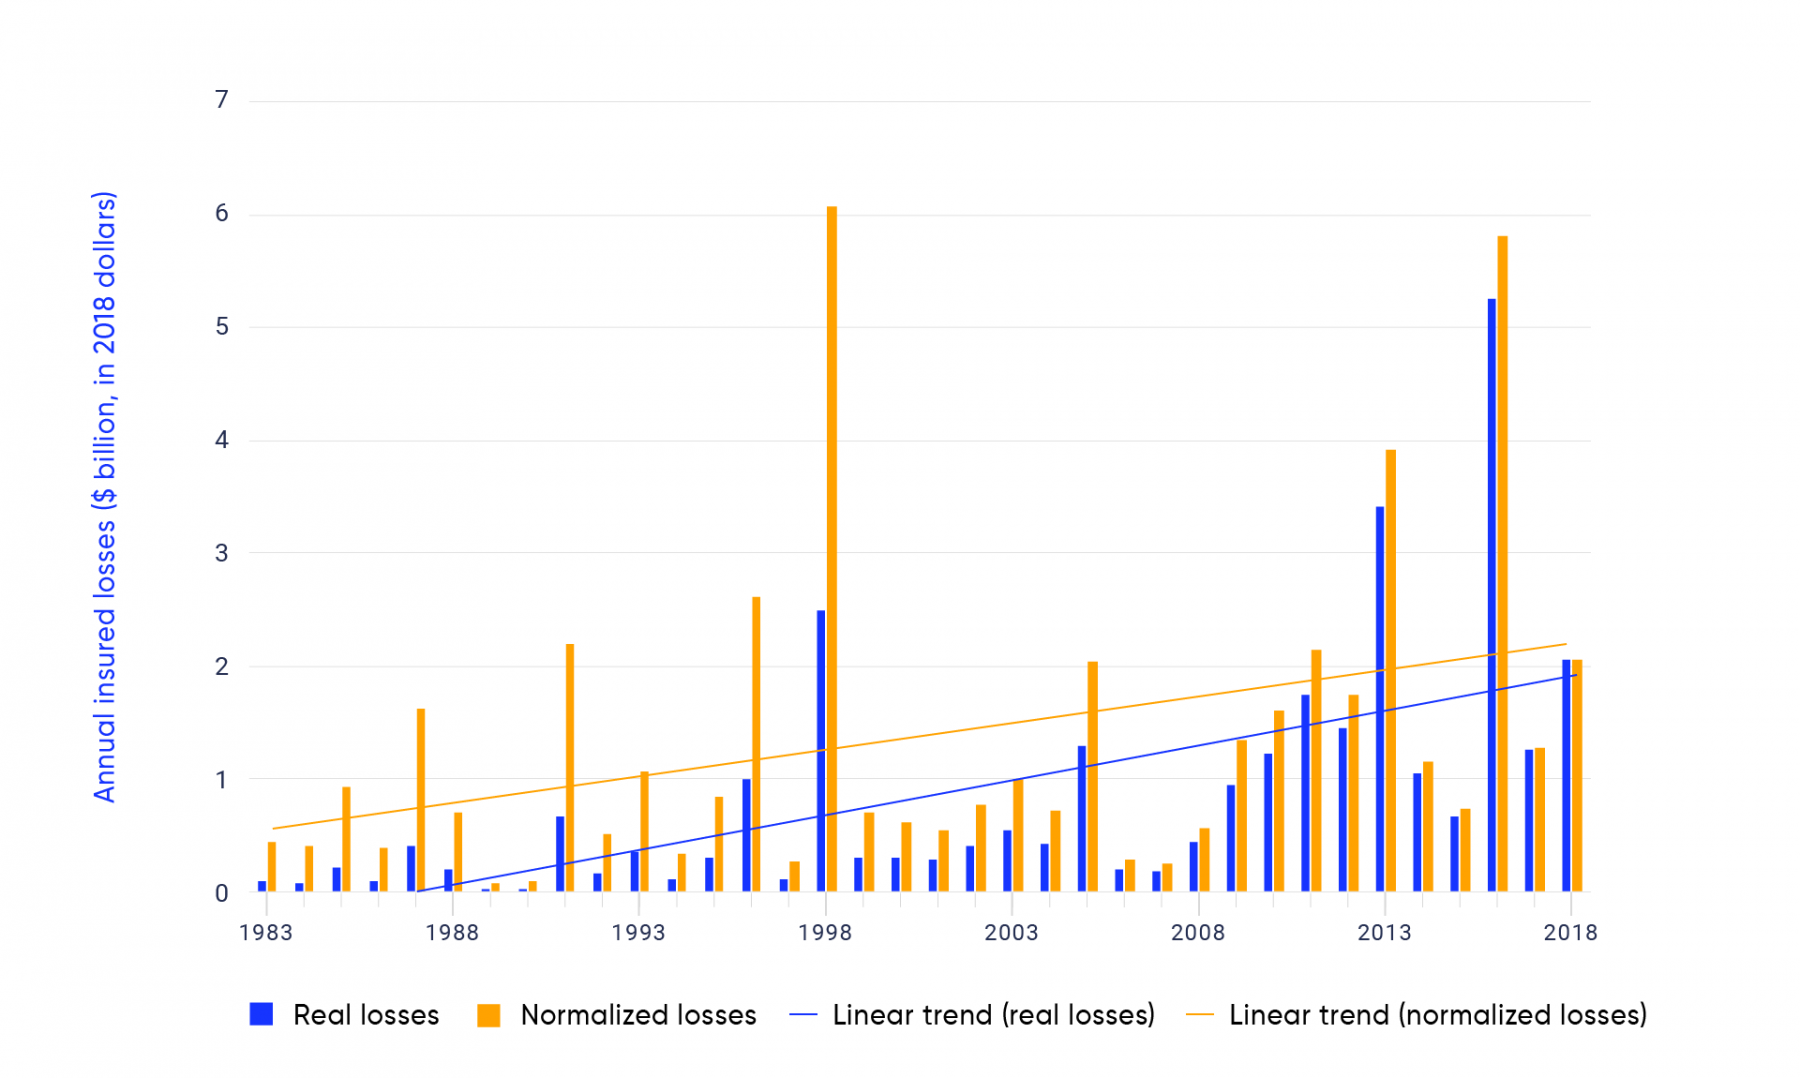
Figure 6.6 presents normalized insured losses for the same extreme weather events in Canada as shown in Figure 6.5. Losses are normalized using a conventional approach (e.g., Miller et al., 2008; Pielke et al., 2008; Pielke et al., 2003): the original nominal values, not adjusted for inflation, are modified by three multipliers to account for changes in producer prices, population and wealth, which are measured in terms of GDP per capita over time. A significant, though slightly weaker, positive trend is still observed in normalized losses from weather-related disasters in Canada. This upward trend is also evident when considering the five-year moving average of normalized losses, which produced an annual growth rate of 3.5% between 1983 and 2018; this rate was still increasing, but at a much slower rate than that of nominal losses (10.6%) and real losses (8.2%), adjusted for inflation, over the same period. Since 1983, the increasing trend in insured losses associated with extreme weather disasters in Canada has primarily been due to an accumulation of value (e.g., people, assets, wealth) year-on-year. But rising losses cannot entirely be explained by growing exposures, asset values and general price inflation—climate change may be playing a role. While a rise in normalized losses is not “proof” of climate change, it is certainly consistent with the anticipated intensification of some weather extremes with rising temperatures (Swiss Re Institute, 2020; Coronesea et al., 2019; IPCC, 2013).

Research on event attribution in Canada—which assesses how the likelihood of extreme weather events is altered by GHG emissions from human activity—found that climate change increased the likelihood of the 2016 Fort McMurray wildfire and the extreme rainfall that contributed to the 2013 flooding in southern Alberta (Zhang et al., 2019), two of the most costly weather disasters on record in Canada (see Prairie Provinces chapter).

Figure 6.6

-

Bar graph shows normalized annual insured losses plus adjustment expenses (in 2018 dollars) from extreme weather events in Canada over the period 1983 to 2018. The height of the bars shows the total normalized losses in orange and real losses in blue, plus expenses from all extreme weather-related events in each year. There are spikes in normalized losses in 1987, 1991, 1996, 2005, 2011, 2012, 2013, 2016, 2017, and 2018. The solid lines show the estimated upward trend in normalized insured losses and real insured losses, plus adjustment expenses. The trend line shows that both normalized and real losses have been trending upwards since the 1980s.
Figure 6.6

Normalized annual insured losses plus adjustment expenses (in 2018 dollars) from extreme weather events in Canada over the period 1983‒2018. Losses are normalized following the approach used in Pielke et al., 2008, Miller et al., 2008, and Pielke et al., 2003, which adjusts for inflation and changes in population and wealth over time. The height of the bars shows the total normalized losses (orange) and real losses (blue), plus expenses from all extreme weather-related events in each year. The solid lines show the estimated upward trend in normalized losses (orange) and real losses (blue), plus adjustment expenses.

Source

Data source: Insurance Bureau of Canada, 2019.

6.5

Future climate change costs for Canada will be high

While climate change will present some benefits for Canada, the associated economic impacts are overwhelmingly negative. Much of the available evidence covers only a subset of the full extent of potential economic impacts from climate change for Canada. Projected costs are likely very conservative.

In the absence of new adaptation actions, the available evidence suggests that climate change will adversely impact the rate of economic growth in Canada and will result in negative economic consequences for forestry, coastal regions, the Great Lakes region (associated with low water levels), public health, and ski resorts in Quebec and B.C. Under high-emissions scenarios, the economic costs to these sectors could range from 100s of millions to 10s of billions of dollars annually by mid-century, and could amount to higher still by the end of the century. Most studies project economic benefits to the agriculture sector from climate change—with the largest gains in the Prairie provinces—while some large-scale global studies project minor losses for Canada’s agriculture sector. The limited evidence available for cities suggests that climate change will have potentially significant negative economic impacts. Approaches for investigating the economic consequences of climate change have advanced considerably over the last decade. However, improving consistency across studies related to scope, assumptions and foundational data, and further refining methods are necessary to form more robust conclusions about the importance of economic impacts for one sector or region relative to another. There are also important knowledge gaps to fill. Information on the economic impacts of climate change is limited to a few sectors, regions and municipalities, and is lacking for Indigenous peoples.

6.5.1

Introduction

A key piece of economic information supporting climate-related decisions is the future cost of inaction—the economic consequences that result from allowing climate change to continue unabated and without further planned adaptation (Ackerman and Stanton, 2011; European Environment Agency, 2007). While the magnitude of the projected cost of inaction is uncertain, judiciously caveated estimates can be used in tandem with information on the current costs of climate and weather extremes (see Section 6.4) to persuade decision makers of the urgent need to allocate resources for adaptation, and to prioritize the allocation of such resources to address key climate risks. Projected costs also provide a baseline for weighing the cost of adaptation projects, programs and policies. To supplement the observed cost information for historic extreme weather events presented in Section 6.4, this section reviews available evidence relating to the projected future costs of climate change for Canada: looking at aggregate, multi-sector and national-level cost assessments; cost assessments for single climate-sensitive sectors at the national, regional and provincial level; and cost assessments for specific municipalities.

6.5.2

Multi-sector national cost assessments

Aggregate estimates of the economic consequences of climate change strictly for Canada and across multiple sectors are scarce. The frequently cited study by the NRTEE (2011) remains the benchmark multi-sector national assessment of the economic costs of climate change for Canada. Using the integrated assessment model, PAGE09 (Hope, 2011), the future economic cost of climate change for Canada was estimated for two climate and two socioeconomic scenarios, producing four plausible futures: 1) “low climate change–slow growth”, 2) “low climate change–rapid growth”, 3) “high climate change–slow growth” and 4) “high climate change–rapid growth”.2 Projected annual costs for Canada in 2050—assuming no new adaptations—range from $30 billion (2019 dollars) under the “low climate change–slow growth” scenario to $62 billion under the “high climate change–rapid growth” scenario. Under the “high climate change–rapid growth” scenario, more people, assets and wealth are exposed to a larger temperature change than under the “low climate change–slow growth” scenario, resulting in larger projected costs. The PAGE09 model explicitly captures uncertainty in its parameters, which generates a frequency distribution of estimated annual costs. The distributions of possible costs across all scenarios suggest a small chance that costs could be much higher—there is a 5% chance that the annual cost of climate change in 2050 could exceed $131 billion under the “high climate change–rapid growth” scenario. By 2075, under the same four plausible scenario combinations, annual costs are projected to range from $74 to $319 billion, with a 5% chance that they could exceed $1,185 billion annually under the “high climate change–rapid growth” scenario. These projections reflect the undiscounted expected costs to traditional economic sectors (e.g., construction, manufacturing, retail trade, educational services, etc.) and non-economic sectors (e.g., impacts to health and ecosystems) from warming, the expected costs of sea-level rise and the expected costs of “fat-tail” catastrophic events3 (e.g., from rapid melting of the Greenland and West Antarctic ice sheets) (NRTEE, 2011).

The only other multi-sector national estimates of the aggregate impact of climate change on Canada come from large-scale global macroeconomic studies. Results for Canada from three of these studies are presented in Table 6.2. All three studies use similar approaches, which involve integrating information about biophysical impacts and economic valuation derived from independent damage assessments for specific sectors (like agriculture) into a multi-regional, multi-sector model of the global economy to estimate the impact of climate change on economic output (GDP). The studies include similar sector-specific impact categories (see Table 6.2) and draw damage information to inform the magnitude of projected impacts largely from the same set of primary studies (e.g., Lafakis et al., 2019; Kompass et al., 2018; Roson and Sartori, 2016; Kjellstrom et al., 2009; Bosello et al., 2006; Hamilton et al., 2005). Despite these similarities, the results are not strictly comparable due to, among other things, different time horizons and modelled temperature changes, and differences in how the independently estimated climate impacts are integrated into each macroeconomic model.

Table 6.2

Summary of national economic consequences for Canada from a selection of large-scale global macroeconomic studies

Study Projected impact on GDP Climate change scenario Categories of climate change impact included in the assessments1
Organisation for Economic Co-operation and Development (2015) +0.89% change in real GDP per year in 2060, relative to projected GDP without climate change impacts Projected regional change in mean annual temperature in 2060 under RCP8.5 relative to pre-industrial levels (1850–1900) Agriculture and fisheries: changes in crop yields and changes in fishery catches

Coastal zones: loss of land and capital from sea-level rise

Extreme events: damages from hurricanes

Public health: changes in labour productivity and healthcare expenditures due to vector-borne diseases, heat- and cold-related diseases, diarrhea

Occupational health: changes in labour productivity due to heat stress

Residential energy demand: changes in space heating and cooling costs

Tourism: changes in net tourism flows and associated expenditures

Kompass et al. (2018) 0.10% (+1°C) to

-0.32% (+4°C) change in real GDP per year in 2100, relative to projected GDP without climate change impacts

+1°C to +4°C change in global mean annual temperature by 2100 relative to pre-industrial levels (1850–1900) Agriculture: changes in crop yields

Coastal zones: loss of land from sea-level rise

Public health: changes in labour productivity and healthcare expenditures due vector-borne diseases, heat- and cold-related diseases, diarrhea

Occupational health: changes in labour productivity due to heat stress

Lafakis et al. (2019) +0.31% change in real GDP in 2048 (fourth quarter), relative to forecast GDP without climate change impacts Projected global change in mean annual temperature in 2048 under RCP8.5 relative to 1986–2005 Agriculture: changes in crop yields

Coastal zones: loss of land

Public health: changes in labour productivity and healthcare expenditures due vector-borne diseases, heat- and cold-related diseases, diarrhea

Occupational health: changes in labour productivity due to heat stress

Residential energy demand: changes in space heating and cooling costs

Tourism: changes in net tourism flows and associated expenditures

1 Biophysical and economic impacts are derived from independent studies for each climate change impact category, and this information is used to develop “shocks” to the global macroeconomic models to simulate impacts on GDP. For example, Lafakis et al., 2019, used projected changes in oil prices to shock the Moody’s Analytical Macroeconomic Model for projected changes in residential energy demand related to climate change.

All three studies suggest that projected climate change impacts on annual real Canadian GDP will be less than (plus or minus) 1%. Though small in percentage terms from a national perspective, this still equates to very large dollar amounts, which will be significant for affected Canadian sectors and regions. Both the Moody’s Analytics study and the OECD study project small net gains for the Canadian economy. In each case, the dominant driver behind the result is projected increases in tourism flows, with fewer domestic departures and more international arrivals expected as Canada warms. These gains more than offset output losses attributable to the other climate impacts that were analyzed. However, the projected increases in tourism flows for Canada should be viewed with caution, due to the simplified and aggregate nature of the underlying impact model, in which tourist flows only depend on mean annual temperature, per capita incomes, an attractiveness index, and the distance between the capitals of origin and destination countries (Hamilton et al., 2005). Other key determinants of future tourism flows are ignored, including the influence of changing precipitation patterns, supply-side constraints on the availability of tourist infrastructure, and feedback effects on international arrivals due to reduced incomes in origin countries related to climate change impacts on other sectors of the global economy. Kompass et al. (2018) deliberately excluded climate change damage functions for tourism from their analysis because of these concerns, and they projected small net losses for the Canadian economy related to climate change.

Estimates of the aggregate impact of climate change on the Canadian economy are available from another global macroeconomic study. Kahn et al. (2019) used a “top-down” empirical approach—which estimates a relationship between a climate variable (e.g., temperature) and an aggregate measure of economic output for the whole economy (e.g., national GDP)—to investigate the impact of climate change on long-term economic growth across 174 countries, including Canada. To put the results of this study into perspective, the PAGE09 integrated assessment model used by the NRTEE measures climate change impacts on GDP levels, not the GDP growth rate (i.e., it measures short-term growth effects). However, climate change can cause lasting damage to capital stocks and productivity in most sectors of the economy, and is likely to impact long-term growth rates (Revesz et al., 2014; Stern, 2013). In this case, output and consumption at some future date will not depend solely on the temperature at that date, but is more likely to be affected by the entire path of temperature, output and consumption up to that date. Studies that have investigated the impact of climate change on GDP growth rates have found substantially larger losses than studies that measured impacts on the annual level of GDP (Diaz and Moore, 2017a, b). The assessments summarized in Appendix 6.1 incorporated a mix of both effects—some of the sector-specific impacts that were analyzed affected GDP growth rates (e.g., damage from sea-level rise to capital stocks), while others affected output levels (e.g., changes to crop yields).

Kahn et al. (2019) used a model linking mean annual temperature deviations from historic norms over the period 1960–2014 to changes in labour productivity (see Case Story 6.2), and in turn to real GDP per capita. The model was used to investigate the cumulative effect of changes in labour productivity resulting from persistent increases in mean annual temperature under RCP8.5. In contrast to the projections presented in Appendix 6.1, Kahn et al. (2019) found that climate change would substantially reduce real GDP per capita in Canada in 2050 and 2100 by 4.4% and 13.1%, respectively.

The global macroeconomic studies discussed above have several limitations, meaning that the projected impacts of climate change for Canada are likely overwhelmingly negative and much higher than shown. For a start, many important impacts were omitted, including impacts on livestock and aquaculture, changes to forestry yields, impacts associated with the spread of invasive species and pests, impacts of water stress on electricity production and the availability of potable water for end users, impacts on human security (e.g., conflict and migration) and impacts on the provision of ecosystem services. Furthermore, macroeconomic studies cannot capture non-market impacts, such as welfare losses from impacts to cultural ecosystem services, premature mortality, or pain and suffering from illness or injury. The economic consequences of extreme weather events were also not covered, with the exception of hurricanes in the OECD study. The costs of these disasters can be considerable (see Sections 6.4, 6.5.2 and 6.5.3). Finally, large scale disruptive or “fat-tail” catastrophic events were not captured.

6.5.3

Sector and regional cost assessments

While only a few studies provide aggregate cost estimates across multiple sectors for Canada, many more studies have investigated the economic consequences of climate change for individual climate-sensitive sectors (e.g., forestry, agriculture, coastal areas). Appendix 6.1 provides a summary of these studies and results, organized by climate-sensitive sector.

It is nearly impossible to compare the relative magnitude and significance of estimated economic consequences between climate-sensitive sectors, or even within a sector, due to differences in assumptions and methodologies across studies. In addition to differences in geographical scope, key differences between studies that influence the results relate to:

  • The choice of emissions scenario(s) driving the biophysical impacts and, relatedly, the future time period(s) and climate norms used to measure changes in relevant climate variables. Looking at coastal areas, for example, some studies use the old IPCC Special Report on Emissions Scenarios (SRES), whereas others use the Representative Concentration Pathways (RCPs). This affects the time horizon over which streams of losses or gains are aggregated (e.g., the studies in Appendix 6.1 assessing the same coastal area sites use three different time periods: 2009–2054, 2015–2064 and 2011–2100).
  • Assumptions about future socioeconomic developments, which will influence both the quantity and monetary valuation of buildings, infrastructure, crops, etc. that are affected under the assumed baseline and against which the impacts of projected climate change are assessed. Some of the studies examined the impact of future climate change on the sector today (based on current or historical information), while others—such as the NRTEE (2011) forestry and coastal area studies—investigated the impact of future climate change on future projections for the sector.
  • Whether one or more biophysical impacts are considered. For example, some studies that focused on coastal areas included erosion and flooding from sea-level rise and storm surge, while others only considered impacts from flooding.
  • The types of economic consequences resulting from the biophysical impacts included in the analysis. Most studies considered only direct impacts (e.g., damage-related costs, changes in agricultural land values, foregone ski revenues, increases in ski resort operating costs or fire suppression costs), while some studies also assessed indirect and macroeconomic impacts. The more recent studies measured economic consequences in terms of changes in projected GDP or welfare, which were estimated using CGE models. Furthermore, some studies that measured only direct impacts considered both market and non-market impacts (e.g., coastal area studies for Quebec), while others included only the former.
  • The choice of economic modelling tool, specifically with respect to agriculture. Most agricultural studies estimate using a Ricardian model (an approach that estimates an empirical relationship between land values and climate variables) to measure the economic consequences of climate change on farmland values, while some use CGE models. As noted above, CGE models measure direct and indirect impacts, and account for market-driven behavioural (price) responses throughout the economy; Ricardian models capture only direct impacts and typically assume that prices are fixed. Results from both modelling approaches applied to agriculture are not comparable.
  • Whether the economic consequences are measured in current (nominal) dollars or constant (real) dollars, and which base year is selected in the latter case (e.g., coastal area studies measured costs in 2000, 2008 and 2012 constant dollars). This is less of an issue, though, since it is possible to express all results in the prices of a common base year.
  • The choice of discount rate, where results are reported as the present value of cumulative losses or gains over a defined time horizon (e.g., some studies use a real annual discount rate of 3%, whereas others use 4%). A higher discount rate will produce lower present-value costs or benefits, and a lower discount rate will produce the opposite. For reference, the value of a $1 cost (in 2020) incurred in the 2080s is $0.15 and $0.08 at a discount rate of 3% and 4%, respectively. Some studies also present undiscounted costs or benefits. Discounting and discount rates are discussed in Section 6.6.3.2.

While the above factors make it difficult to arrive at firm conclusions about the magnitude of economic impacts, it is possible to draw conclusions about the direction of projected impacts for all sectors studied, except for agriculture. The available evidence (based on the studies listed in Appendix 6.1) suggests that climate change will have predominantly negative economic consequences for forestry, coastal areas, human health in Quebec, low water levels in the Great Lakes and St. Lawrence River region, ski resorts in British Columbia and Quebec, and ice-based access roads in the Northwest Territories. Below are key observations across this series of studies, by climate-sensitive sector.

6.5.3.1

Forestry

Climate change impacts on timber supply (related to factors such as forest productivity, fires, pests and disease) are projected to reduce forest sector output, GDP and welfare. Nationally, present-value cumulative GDP losses over 70 years through 2080 could be as high as $459 billion (2008 dollars), without adaptation measures (Ochuodho et al., 2012). Losses are not evenly distributed across Canada—British Columbia, Saskatchewan, Manitoba and the Territories are the worst affected areas in terms of projected GDP losses (Ochuodho et al., 2012; NRTEE, 2011). In contrast, Quebec and Ontario could experience slight improvements in GDP under the most optimistic scenario of climate change impacts on timber supply, and modest losses under the most pessimistic scenario (Ochuodho et al., 2012). Climate change is also projected to increase historical fire management costs nationally by 60‒‍120% per year by the 2080s, with Alberta and Saskatchewan seeing much larger increases in costs than the national average (Hope et al., 2015).

6.5.3.2

Coastal regions

Climate change is projected to impose costs on Canada’s coastal regions. By 2050, annual damages from coastal flooding attributable to climate change could range from $1 to $8 billion (in 2008 dollars), depending on the growth and emissions scenario (NRTEE, 2011). In present value terms, cumulative losses over the period of 2011–2100 could be as high as $380 billion (in 2008 dollars) (NRTEE, 2011). As in the forestry sector, losses are distributed unevenly across Canada—British Columbia is estimated to incur the largest losses, accounting for upwards of 80–90% of the total losses nationally (Withey et al., 2016; NRTEE, 2011). Detailed regional studies of specific stretches of coast in Quebec and Atlantic Canada also find significant variation in projected losses, suggesting that the economic costs of climate-related coastal flooding are very site-specific (Boyer-Villemaire et al., 2016; Circé et al., 2016b; Parnham et al., 2016).

6.5.3.3

Water levels

Low water levels in parts of the Great Lakes‒St. Lawrence River system due to future climate change are anticipated to adversely affect a range of economic activities, recreational opportunities and other shoreline amenities. Present-value cumulative costs associated with these impacts are projected to amount to $12 billion over 50 years through 2065 (in 2012 dollars) (Dorling and Hanniman, 2016; Millerd, 2005). Approximately 90% of these costs result from three economic impacts: the replacement of lost hydroelectric output (50%), foregone earnings from ecological services and fishing (25%) and lost shipping capacity (15%) (Dorling and Hanniman, 2016; Millerd, 2005).

6.5.3.4

Human health

Changes to the incidence of climate-sensitive health outcomes under future climate conditions can increase healthcare expenditures and welfare losses. In Quebec, the present value of cumulative expenditures on health services attributable to the impact of climate change on vector-borne diseases, extreme heat events and aeroallergens is estimated at just under $1 billion over 50 years through 2065 (in 2012 dollars) (Larrivée et al., 2015). The present value of cumulative welfare losses associated with increased mortality—measured using the Value of Statistical Life—is approximately $35 billion (in 2012 dollars) over the same period (Larrivée et al., 2015). This finding is consistent with other economic studies of the impact of climate change on human health; welfare losses can substantially exceed healthcare resource costs (e.g., Paci, 2014; Kovats et al., 2011).

6.5.3.5

Ski resorts

Climate change is anticipated to adversely impact the economic viability of ski resorts. For instance, the net income of three resorts in Quebec is estimated to fall by just under 30% over a 20-year period through 2045, as a result of changes in the length of the ski season and in snow conditions (DaSilva et al., 2019). Evidence for Fernie and Whistler in British Columbia also shows that the impact of climate change on snow conditions can reduce the value of property in resorts (Butsic et al., 2011).

6.5.3.6

Agriculture

In contrast to other climate-sensitive sectors, most of the available literature summarized in Appendix 6.1 suggests that the economic consequences of climate change for agriculture in Canada could be positive and potentially significant—even by the 2080s—and especially for the Prairie provinces. For example, estimated increases in farmland values by the 2050s on the Prairies resulting from climate change are as high as +40% (Amiraslany, 2010). The exception is a small area of southeast Alberta, where farmland values are anticipated to decrease through the century. In dollar terms, projected increases in farmland values on the Prairies by the 2050s could amount to just under 25% of the value of agricultural GDP in 2011 (Amiraslany, 2010). These estimated benefits are derived from Ricardian models of agricultural land values and should thus be viewed as optimistic. It is assumed that the estimated relationships embedded in these statistical models are valid beyond the range of empirical evidence from which they were derived; however, this may not be the case, especially towards the end of the century. Furthermore, the estimated relationships capture historical autonomous adaptations by farmers. However, farmers may face new barriers to private action in the future (see Section 6.8.1), reducing the efficacy of autonomous adaptation. None of the agricultural studies in Appendix 6.1 account for the impacts of climate and extreme weather events on agricultural output and land values, nor do they account for the changes in pest damage or the timing of precipitation.

Studies using CGE models—which capture interprovincial and international trade flows—have produced more conservative and differing values. One study indicated that climate change impacts on agricultural crops would increase GDP in Canada through 2050 (Ochuodho and Lantz, 2015), while another study that considered impacts on livestock and processed foods, in addition to impacts on crops, estimated that GDP in Canada would decrease slightly by the 2080s (Zhai et al., 2009). The latter result was mainly due to large decreases in livestock output. Using a global multi-sector model, the Organisation for Economic Co-operation and Development (2015) likewise projected a decline in GDP from climate change impacts on agriculture in Canada by 2060.

One study (Ochuodho and Lantz, 2015) that generated regional results for Canada using a CGE model found the largest GDP gains primarily in the Prairie provinces, in terms of percentage increases in GDP. Interestingly, GDP increases due to climate change do not translate into proportional welfare changes for consumers and do not necessarily lead to increased welfare. Price changes, input substitution and trade dynamics may result in welfare losses for consumers, despite increases in GDP. For example, the present cumulative GDP value in Manitoba over 45 years is projected to increase by 1.3%, while welfare is projected to decline by 0.1% over the same period. For the same reasons, while increasing the wealth of farmers, the beneficial impacts of climate change estimated by the Ricardian models do not necessarily translate to improvements in consumer welfare.

6.5.4

Municipal cost assessments

Projections of the economic consequences of climate change have also been made for individual cities in Canada. Appendix 6.2 provides a summary of key city-specific studies, which vary markedly in scope, methods, emissions scenarios, socioeconomic assumptions, time horizons considered and measures of economic impact, making comparisons difficult. The small number of studies also makes it difficult to draw assured conclusions. Nevertheless, initial observations from the available evidence suggest that the net economic consequences of climate change for cities are projected to be negative.

It is also evident from the studies in Appendix 6.2 that the scope of the analysis—the number of climate hazards, biophysical impacts and exposures considered, and whether the economic impacts include both direct and indirect impacts, as well as market and non-market impacts—is an important determinant of the magnitude of projected costs. For example, non-market impacts accounted for 23‒42% of total flooding costs in Fredericton due to climate change (Lantz et al., 2012). The omission of non-market impacts from these analyses would result in a significant underestimate of projected climate-related costs. The scope of the City of Edmonton analysis (see Case Story 6.3) was more comprehensive than the other city studies and included many more climate-related impacts (17 rapid-onset impacts alongside changes in heating and cooling degree days) on a broader inventory of exposed buildings, assets, infrastructure and services, as well as non-market economic impacts on human health and the natural environment. This more expansive scope also included direct and indirect impacts, explaining why the projected climate-related costs found by the study are relatively high; expected annual GDP costs are $1.6 billion in 2055 and $3.5 billion in 2085 (both in 2016 dollars), which is equivalent to 1.6% and 1.9%, respectively, of the city’s projected GDP.

All studies employed bottom-up, process-based modelling approaches. The City of Edmonton and the Cities of Halifax and Mississauga studies also adopted good practices, determining incremental losses attributable to climate change with and without socioeconomic development relative to today. This allows for an analysis of how socioeconomic development in relation to climate change contributes to projected economic costs, as well as an analysis that isolates the fraction attributable solely to climate change. Consistent with observations from the multi-sector regional studies discussed in Section 6.5.3, growth in the “stock at risk” to climate change and rising valuations of that stock can be an equally important determinant of future economic costs as climate change itself (see Case Story 6.3).

6.6

Economic decision support tools help with assessing adaptation options

Economics offers a range of tools to help decision makers appraise adaptation actions, understand trade-offs and generate information on the costs and benefits of different options. The appropriate economic tool to use depends on the criteria for the adaptation decision, the nature of the climate change impacts and the level of uncertainty.

Although there is no one-size-fits-all approach, economics offers a range of tools that can support decision makers in appraising adaptation options—each tool has strengths and weaknesses depending on the context for the adaptation decision. Appraising adaptation actions requires weighing a diverse range of factors, as well as quantifiable financial costs and benefits. This includes non-monetary and non-market impacts, positive and negative co-impacts, barriers to implementation, equity and, importantly, uncertainty. There are methods to capture distributional impacts, intergenerational equity issues and non-market impacts within traditional economic decision-support tools like cost-benefit analysis (CBA). There are also a range of new approaches that work with traditional tools like CBA, but are better at supporting decision making under deep uncertainty, and incorporating the time-phasing of actions and multi-metric evaluations, such as adaptation pathways and robust decision making. When the chosen economic tools do not account for this diverse range of factors, decision making can be biased against vulnerable populations, disadvantaged groups, future generations, and “soft” actions with fewer quantifiable costs, benefits and non-market impacts.

6.6.1

Introduction

In addition to seeking evidence on the economic consequences of climate change, decision makers are increasingly requesting information on the costs, benefits and key trade-offs of actions to support their adaptation decisions. This section provides a review of economic analysis tools to support adaptation decision making and will provide context for the next section, which reviews the application of these tools in Canada. Prior to an examination of the economic decision support tools, common evaluation criteria are introduced to highlight the trade-offs that decision makers often consider in making adaptation decisions.

6.6.2

Decision criteria

Decision makers bring diverse objectives, interests, knowledge and values to climate change adaptation decisions. This results in a diverse range of decision criteria to consider as various courses of action are weighed. The literature contains many decision criteria and groupings of those criteria to support the appraisal of adaptation actions and their implementation (e.g., Rouillard et al., 2016b; Weiland and Tröltzsch, 2015; PROVIA, 2013; United Nations Environment Programme, 2011). These reviews conclude that the appraisal of adaptation actions should ideally capture trade-offs between all relevant outputs (benefits) and all relevant inputs (costs) that are needed to deliver those outputs. Two further important considerations relate to uncertainty surrounding the anticipated outputs and the ease with which an adaptation action can be successfully implemented, which will also affect costs. Based on these reviews, the main decision criteria typically used to assess the relative merit of investment in adaptation actions are described in Table 6.3.

Table 6.3

Description of main decision criteria commonly used to appraise adaptation actions

Inputs Potential goal of the decision maker
Costs Total lifecycle costs

The total costs of the adaptation action, including the following, where relevant: upfront investment costs (capital), annual recurring costs (operations and maintenance), renewal and reinvestment costs, decommissioning costs and transaction costs.

Minimize total lifecycle costs for a given target output.
Negative co-impacts

Negative side-effects of the adaptation action for other economic, social or environmental objectives of the decision maker. Examples include increasing GHG emissions, increasing risks to other groups or sectors that are not the target of the option, or limiting future adaptation options.

Keep aggregate negative co-impacts to a minimum.
Ease of Implementation Feasibility

The capacity of the decision maker to successfully implement the adaptation action, including accessing the necessary knowledge, technologies, human resources, budget etc. (all of which could act as barriers to action). Feasibility is also influenced by the presence of entry points or windows of opportunity to implement the option.

Prioritize the most feasible actions.
Acceptability

The degree of social, cultural, economic and political support for the adaptation action, both from those directly affected (i.e., groups that benefit and bear costs) and the general public.

Prioritize actions with the most support and the least opposition.
Outputs
Benefits Effectiveness

The degree to which the adaptation action achieves the goal(s) of the decision maker (e.g., reduces anticipated adverse consequences of a specific climate-related threat, enables anticipated beneficial consequences of a climate-related opportunity to be realized, etc.).

Maximize effectiveness through project design.
Relevance

The significance of the climate-related threat or opportunity targeted by the adaptation action. Threats and opportunities with “extreme” consequences that are “almost certain” to occur would have high relevance.

Prioritize actions that target threats or opportunities of highest relevance.
Co-benefits

Positive side-effects of the adaptation action for other economic, social or environmental objectives of the decision maker. Examples include GHG emission reductions, recreation opportunities, maintaining or enhancing ecosystem services, employment opportunities, encouraging innovation and decreasing risks to other groups or sectors that are not the target of the option.

Take account of aggregate positive co-impacts when selecting among candidate adaptation options.
Equity

Equitable distribution of adaptation costs, benefits and residual impacts between population groups and generations. The action benefits the broadest possible range and number of people. Equity also encapsulates the degree to which options reduce existing inequalities (e.g., to disadvantaged groups or neighbourhoods).

Prioritize equitable actions that support disadvantaged and low-income groups, and that address existing inequalities.
Uncertainty Urgency

Refers to how soon the adaptation action needs to be implemented. Addressing priority threats or opportunities that occur under current climate conditions would be assigned greater urgency than actions that target threats or opportunities expected only under projected future climate conditions. Adaptations that target future threats and opportunities with the potential to affect near-term decisions with long lifetimes, such as current land-use planning and infrastructure choices, would also be treated with greater urgency.

Prioritize actions that address risks from current climate conditions or that mainstream adaptation considerations into near-term, long-lived decisions.
Static robustness

The degree to which an action is effective in terms of achieving the decision maker’s objectives, over a range of plausible emissions scenarios and socioeconomic scenarios. This criterion is most relevant to near-term, long-lived decisions.

Prioritize actions that reduce vulnerability to the largest possible range of future climate and socioeconomic conditions.
Dynamic robustness (flexibility)

Adjustable actions that can be implemented incrementally and readily adapted if future climate and socioeconomic conditions change or turn out differently from what is expected today. This criterion is also most relevant to near-term decisions with long lifespans.

Prioritize actions that are readily adaptable to changing climate and socioeconomic conditions, with minimal transition costs.
Source: Weiland and Tröltzsch, 2015; PROVIA, 2013
6.6.3

Conventional economic decision support tools

There are multiple methods for appraising adaptation actions. The standard analytical technique used for the economic appraisal of policies, programs and projects is cost-benefit analysis (CBA) (see Figure 6.9). CBA is a suitable method for economic appraisal when the adaptation goal is to minimize the economic costs of a climate-related threat or to maximize the economic benefits of a climate-related opportunity. In some decision contexts, however, the adaptation goal might be to achieve a given level of risk reduction or to cancel out all adverse climate-related impacts (i.e., to maintain baseline conditions) (Chambwera et al., 2014). In this context, the other main economic appraisal method, cost-effectiveness analysis (CEA), could be used to identify the action or portfolio of actions necessary to achieve this goal at the lowest cost or the greatest level of risk reduction for a fixed investment budget.

A third traditional method that can be used to appraise adaptation actions is multi-criteria decision analysis (MCDA). Though it is not technically an economic appraisal tool, it can accommodate monetized costs and benefits information in the decision calculus, alongside a range of other decision criteria. A decision maker may want to use MCDA when economic efficiency is not the sole decision criterion of interest or when important inputs to, or outcomes of, the adaptation action cannot be valued in monetary terms. Given the multiple criteria now being considered when making adaptation decisions, increasing emphasis is being placed on such “multi-metric” appraisal tools to provide support for decision makers (see Table 6.4; Chambwera et al., 2014).4 Only CBA, however, has been applied in the available literature for Canada (see Section 6.7).

Figure 6.9

-

Figure A shows a trend line of the relationship between change in mean annual temperature relative to the recent past in degrees Celsius and the annual social cost in billions of dollars for the City of Edmonton. As mean temperature increases so do social costs. Figure B shows the estimated social costs of climate change under a baseline scenario in which no new adaptation actions are taken. In this scenario, as mean temperature increases so do social costs. For instance, 6 degrees Celsius of warming is estimated to raise annual social costs to 18 billion dollars. Figure C shows how social costs could be reduced if new adaptation actions are taken. The graph estimates that social costs due to 6 degrees Celsius of warming could be reduced to 6 billion dollars if adaptation actions are taken. Figure D shows how social costs could be reduced if new adaptation actions are taken and adds information about the cost of adaptation actions. This graph shows that even when the cost of adaptation actions are taken into account there is a net benefit.
Figure 6.9

This stylized depiction of present-value benefits, costs and residual damage costs of adaptation (in 2016 dollars) assumes that the decision makers’ objectives are as follows: to reduce negative impacts and minimize the total cost of climate change. a) Projected baseline scenario (estimated damage function with climate change), b) estimated present-value social costs of climate change under the baseline scenario with no new adaptation actions, c) estimated reduction in projected social costs with new adaptation actions (i.e., defines the present-value benefits of adaptation), and d) estimated net benefits of adaptation actions, once the lifecycle costs of actions are taken into account.

Source

Adapted from Metroeconomica, 2004, and based on the social cost damage function for the City of Edmonton in Boyd, 2018.

Table 6.4

Commonly used economic appraisal methods for adaptation decision support

Tool Summary Uncertainty Benefit metric Complexity
Cost-Benefit Analysis (CBA) This method appraises options in terms of their monetary value, weighing the lifecycle costs of options against projected benefits (e.g., Boyer-Villemaire et al., 2016). The option with the highest net present value or benefit-cost ratio is selected. CBA requires the setting of a baseline against which costs and future expected benefits will be measured. This is challenging because it requires predicting autonomous adaptation behaviour by individuals and organizations in the absence of the option. Does not explicitly deal with uncertainty, but can be combined with probabilistic information to generate expected values. Economic (dollars) Medium
Cost-Effectiveness Analysis (CEA) This method identifies the most economically efficient option to achieve a specific adaptation goal (e.g., Boyd and Walton, 2006): for instance, which of several options alleviates the risk of water shortages at the lowest cost, or how much of the risk can be alleviated for a given expenditure. CEA is useful when the primary benefit metric cannot be expressed in monetary terms. However, as it can only be used to compare options in relation to a single benefit metric (e.g., cubic metres of water), it is generally not possible to appraise options that address impacts across different sectors that do not have a common benefit metric. As with CBA, this method requires the setting of a baseline. In contrast to CBA, it cannot say whether an option is “worth doing”—the starting premise for applying CEA is that a decision has already been taken and that the outcome to be achieved has already been justified as “worthy” of pursuing. Does not explicitly deal with uncertainty, but can be combined with probabilistic information to generate expected values. Quantitative Medium
Multi-Criteria Decision Analysis (MCDA) This method uses multiple metrics, in addition to economic efficiency, to assess adaptation options in terms of achieving specified adaptation goals (e.g., de Bruin et al., 2009b). MCDA is useful when it is difficult to assign monetary values to one or more outcomes of importance, or when it is simply not possible to quantify some outcomes, as qualitative and quantitative information can be combined. As with CBA, this method requires the setting of a baseline. Can incorporate uncertainty as an evaluation criterion, typically relying on the subjective judgement of experts or stakeholders. Economic, quantitative or qualitative Low to medium
Source: Rouillard et al., 2016a; Watkiss et al., 2015a; Boyd et al., 2013; PROVIA, 2013; Watkiss and Hunt, 2013.
6.6.4

Key methodological challenges

Key methodological challenges related to the economic appraisal of adaptation actions include how to handle uncertainty in economic appraisal, discounting choices and distributional considerations. Because of these challenges, the literature is skeptical about relying mainly on traditional economic appraisal tools to rank adaptation actions (e.g., Dennig, 2018; Lempert, 2014; Li et al, 2014).

6.6.4.1

Handling deep uncertainty

When appraising adaptation actions, climate-related uncertainties arise from both climate modelling and socioeconomic aspects (see Figure 6.10). These are in addition to the usual uncertainties about the costs and effectiveness of actions that are present in all economic appraisals. The point of departure is the unknown path of future GHG emissions, which feed into climate projections through climate models. The specification of the relationships between projected emissions and projected changes in the global climate is subject to uncertainty, and different models resolve this in different ways. Most models provide projections at a scale that is too broad to be used for assessing actions at the local level, where adaptation generally takes place. Some downscaling must be done, which creates additional uncertainties. In addition, uncertainty arises from socioeconomic scenarios, which provide a range of estimates for populations at risk in different locations, and also take into account socioeconomic status and wealth. These scenarios are linked to GHG emissions since the latter will in part influence future living standards, and also because different development pathways will influence the amount of GHG emissions. These elements, however, are highly uncertain, especially over the time frames that most analyses need to consider. Finally, there are uncertainties regarding the effectiveness of different adaptation actions. In short, uncertainties “balloon” along the impact chain from GHG emissions to adaptation choices (see Figure 6.2).

Figure 6.10

-

Diagram shows how GHG emissions influence both global climate projections and socioeconomic scenarios. Both downscaling and statistical correction and socioeconomic impacts influence biophysical impacts (for example, hydro-ecological models). Biophysical impacts and socioeconomic impacts influence adaptation measures. Adaptation measures impacts the system being adapted under future climate conditions.
Figure 6.10

The structural elements involved in assessing climate change impacts and adaptation.

Source

Adapted from Markandya et al., 2014.

If the range of possible outcomes can be represented by a probability distribution, one can calculate an expected value. A “risk value” or “premium” can also be calculated, including a component to account for there being a range of possible outcomes. Methods for doing this are well established (e.g., Ranger et al., 2010). The problem is that such probability distributions are rarely available, and it is frequently not possible to calculate the risk value. When probabilities are not available, the traditional practice is to undertake a sensitivity analysis, which involves using scenarios to identify the robustness of the chosen adaptation action in relation to the dominant uncertainties.

While many of the uncertainties described above are reducible, there is little prospect that they will be resolved in a time frame that is useful for early adaptation decisions (Fankhauser, 2017). As a result, scholars have developed a range of heuristics (e.g., Hallegatte et al., 2012) and appraisal tools (e.g., Bloemen et al., 2018; Dittrich, et al., 2016; Watkiss et al., 2015a; Lempert, 2014; Walker et al., 2013) to support adaptation decision making in the presence of deep uncertainty (i.e., uncertainty that cannot be quantified with probabilities) (Weaver et al., 2013). The main approaches for accommodating uncertainty in the economic appraisal of adaptation actions include real options analysis (ROA), adaptation pathways, robust decision making (RDM) and portfolio analysis. See Table 6.5 for a brief description of each tool, how it deals with uncertainty and measures benefits, the resource demands that it places on users, and an example application.

Table 6.5

Economic appraisal methods for adaptation decision support under uncertainty

Description Uncertainty Benefit metric Complexity Example(s)
Robust decision making (RDM)
Uses quantitative models/scenario generators to evaluate how different adaptation options perform under large ensembles of scenarios, each reflecting different plausible future conditions (both climate and socioeconomic). The goal is to identify options that are robust to many different futures (i.e., options that are not necessarily “optimal”, but “good enough” and that minimize negative outcomes). This tool is useful when future uncertainties are poorly characterized and probabilistic information is not available. Explicitly incorporates uncertainties and risks—particularly systemic risks—to derive solutions that are robust to multiple future conditions Quantitative or economic Medium to high Lempert et al., 2013; Dessai and Hulme, 2007
Portfolio analysis
Traditionally used to evaluate trade-offs between returns on an investment and the riskiness of that investment. In a climate change adaptation context, the trade-off is between the likelihood of a high degree of effectiveness in reducing a threat and the risk that the options under consideration will fail to be effective under certain future conditions. This tool helps to identify the set of options that, collectively, are effective over a range of plausible future conditions, as opposed to one option that is optimal for one future. It is useful when there are many complementary adaptation options available to achieve a goal and when good data is available. It requires probabilistic information to compute the variance of returns (net present values) across the portfolio of options under consideration. Deals explicitly with uncertainty by examining the complementarity of a mix of adaptation options for dealing with future conditions Quantitative or economic High Hunt, 2009
Real options analysis (ROA)
Used to explicitly assess the level of flexibility in the timing for implementing one or more adaptation options (i.e., whether to invest now or wait). It is also used to assess the flexibility for adjusting an adaptation option over time, once it has been implemented (e.g., allowing an option to scale up or scale down in response to changing conditions or as new information becomes available). In this way, the tool reveals whether it is better to invest in options that offer greater flexibility in the future.It is useful for adaptation decisions involving large, upfront and irreversible investments, where there is flexibility in the timing of the investment, opportunity for new information to emerge, and the ability to adjust the option in response to learning. Deals explicitly with uncertainty by analyzing the performance of adaptation options related to different potential future conditions Economic High Jeuland and Whittington, 2013; van der Pol et al., 2013; Woodward et al., 2011
Adaptation pathways
Used to operationalize the criterion of flexibility by characterizing adaptation options in terms of: 1) “adaptation turning points” (i.e., points in time beyond which options are no longer effective); and 2) what alternative adaptation options are available once a turning point has been reached. Rather than taking an irreversible decision now to implement an “optimal” adaptation option—which may or may not actually be needed depending on how future climate conditions evolve—this tool encourages decision makers to adopt a flexible plan, where adaptation decisions are made over time and the plan is adjusted as pertinent information emerges. Additional options can be brought forward or delayed to a later time, depending on future conditions. The main challenge relates to defining appropriate “turning points” and data to monitor. Deals explicitly with uncertainty by promoting iterative analysis, monitoring, evaluation, learning and adjustment Quantitative or economic Medium to high See Case Story 6.4; Rosenzweig and Solecki, 2014; Haasnoot et al., 2013; Ranger et al., 2013
Source: Rouillard et al., 2016a; Scussolini et al., 2015; Watkiss et al., 2015a; Boyd et al., 2013; PROVIA, 2013; Watkiss and Hunt, 2013.

The most appropriate appraisal method depends on the decision-making context and the level of uncertainty (Chambwera et al., 2014). Choosing an economic appraisal tool could itself be viewed as a decision problem. For instance, in decision contexts where uncertainty is less of an issue (perhaps relevant probabilities are known) and where adaptation actions are short-term (i.e., low-regret and no-regret actions to address current climate risks), it may be possible to apply traditional CBA or CEA. When uncertainties are deeper, however, and when considering choices among a range of complementary actions to achieve the same adaptation goal, portfolio analysis can be used to help decision makers evaluate trade-offs between the benefits of an action and the riskiness of that action, thereby formulating a portfolio of actions that strike the best balance between risk and return. When uncertainties are anticipated to reduce over time and where individual actions or an adaptation strategy have some degree of flexibility, approaches that support iterative decision making will be more appropriate (such as ROA and adaptation pathways). These approaches encourage decision makers to develop flexible plans where the most efficient adaptation decisions are made sequentially over time, as evidence emerges on how future conditions are evolving. If there is little prospect for uncertainties to be resolved—where decisions are required in the short term with respect to long-lived adaptation actions—then RDM will provide appropriate decision support, helping to identify adaptation actions that achieve the decision maker’s goals under a range of different futures.

While the above economic appraisal methods have been presented individually, they are not mutually exclusive. All of the available tools to support adaptation decision making under uncertainty essentially provide an alternative framing for the application of CBA, CEA, MCDA or some combination thereof. This is demonstrated in Case Story 6.4, where CBA and MCDA are embedded in an adaptation pathways approach to flood management on the Thames River in London, UK.

Two aspects of the application of traditional economic decision support tools in relation to climate change have been the focus of much critical debate: 1) the practice of discounting future economic consequences, and 2) valuing all contemporary consequences equally, regardless of who bears the costs or benefits (Dennig, 2018; Li et al., 2014).

6.6.4.2

Discounting choices

Adaptation actions will typically entail an upfront investment that yields a stream of benefits—and possibly costs—that do not occur in the same year as the investment, but rather are spread out over many years and even decades into the future. The practice of discounting (i.e., of assigning weights to future impacts) has been developed to assist with comparing costs and benefits that occur at different points in time (see Boyd et al., 2013 for a more in-depth review of this topic). Individuals acting on their own, as well as societies acting collectively, prefer to have something now rather than in the future5—in short, they give more weight to the present than to the future. The difference between the value of a dollar today and the value of a dollar in one year’s time is referred to as an individual’s or society’s discount rate. This rate determines how quickly the weight-assigned future costs and benefits decline over time; the higher the rate, the less influence future costs and benefits have on present values. The discount rate is hugely instrumental in determining the weight assigned to future economic impacts (see Appendix 6.3 for more on the discounting process).

The choice of discount rate in climate policy analysis has been the subject of much debate among economists, though primarily in the context of GHG emissions reduction (e.g., Markandya, 2019; Stern, 2008; Nordhaus, 2007). The debate has focused on what rate to apply and, more recently, on whether that rate should be constant over time. On the first question, there is a distinction between the “prescriptive approach” and the “descriptive approach” (Arrow et al., 1996). The former—often referred to as the social discount rate—is based on what rate should be applied on ethical and policy grounds, while the latter—often associated with the opportunity cost of capital—is based on rates applied in the decisions that businesses and individuals make in their daily lives. Prescriptive rates are typically lower than descriptive ones, but there are also substantive differences between scholars as to what the prescriptive rate should be. For example, in the discussion on what rate to apply in deciding on targets for reducing GHG emissions, Stern (2006) advocates for a social discount rate of about 1.4%, whereas Nordhaus (2007) and Weitzman (2007) present arguments for rates in the range of 4–6%. Furthermore, a survey of 197 experts on the determinants of the social discount rate found a mean recommended long-term rate of 2.27% (Drupp et al., 2015). There was considerable disagreement on the value of the rate, as indicated by the range of values recommended by individual experts (with values ranging from 0–10%). However, 92% of experts were comfortable with social discount rates somewhere in the range of 1–3% (Drupp et al., 2015). The official social discount rate for CBA of proposed federal regulations in Canada, as recommended by the Treasury Board of Canada Secretariat (TBS), is 3% (TBS, 2007); this rate was still effective as of September 1, 2018. According to the TBS (2018), it is appropriate to use the social discount rate test when “a regulatory proposal primarily affects private consumption of goods and services and [the] proposal’s impacts occur over the long term (50 years or more).” Still, even when the social discount rate is used in CBA, present values based on the opportunity cost of capital should still be presented.

Descriptive rates also vary a lot depending on the nature of the investment, the risks entailed and the opportunities for alternative investments in the country. From 1976 until the release of the CBA guidelines in 2007, the TBS required that federal departments use an annual real discount of 10% (Boardman et al., 2008), derived from market data. The revised guidelines, which are still effective today, recommend a discount rate of 8% per annum (TBS, 2007, estimated from market data by Jenkins and Kuo, 2007).6 This rate is based on the weighted opportunity cost of capital from three sources—domestic private-sector investors, domestic private-sector savers and foreign savers—and is characterized as a descriptive approach, in contrast to the prescribed 3% “social” discount rate.

On the question of whether a discount rate should be constant over time, the view has gradually been shifting away from a single constant discount rate to one that declines over time (Howard and Sylvan, 2015). This is a major change in thinking, as the determination of the discount rate as described above assumes that the rate does not change over time—although there is no reason for this to be the case. Several scholars have presented arguments for why the discount rate should decline with time. For instance, there is evidence suggesting that individuals and societies do not discount the future at a constant rate, but rather that they adopt a declining or “hyperbolic” path (Gowdy, 2013; Kim and Zauberman, 2009; Settle and Shogren, 2004). Consider the following example: an individual is faced with two choices: 1) postponing consumption for one year from now, and 2) deferring an equal amount of consumption for one year from year 50 to year 51 in the future. While postponing consumption right now for one year might mean a lot to the individual, postponing it for one year in 50 years might not. The weight placed on an extra year in the future declines with time. However, the standard formula for constant discounting gives the same value to both types of postponement. Other arguments, which are often technical in nature, have been made for declining discount rates relating to uncertainty about the future (e.g., Epper et al., 2011; Newell and Pizer, 2003; Sozou, 1998) or the “right” discount rate (e.g., Weitzman, 2001; Azfar, 1998).

This work has provided a compelling case for using declining discount rates (Arrow et al., 2014, 2012; Cropper et al., 2014), especially when deciding on investments with long lifetimes (i.e., 30–50 years). It is important to maintain as much consistency as possible, however, in the way that discount rates are used. It is noteworthy that both the United Kingdom and France have shifted to declining discount rate schedules for the economic appraisal of public investments (see Figure 6.13). Boardman et al. (2008) propose a declining social discount rate schedule for intergenerational, public investments in Canada with lifetimes greater than 50 years: discount costs and benefits at 3.5% per annum from year 0 to year 50, 2.5% per annum from year 51 to year 100, 2.0% per annum from year 100 to year 200, and 1.5% per annum from year 200 onwards.

Figure 6.13

-

Two side-by-side line graphs show the declining social discount rate schedules in practice in the UK and France. The solid red line shows the social discount rate if it were assumed to be constant over time, whereas the solid blue line shows the schedule of declining discount rates used to appraise public policies, programs and projects in each country. The social discount rate schedule for the United Kingdom declines in discrete steps from 3.5 percent per annum to 1 percent per annum. In France, the official rate begins to decline after 30 years, following a hyperbolic path.
Figure 6.13

Declining social discount rate schedules in practice in the UK and France. The solid red line shows the social discount rate if it were assumed to be constant over time, whereas the solid blue line shows the schedule of declining discount rates used to appraise public policies, programs and projects in each country. The social discount rate schedule for the United Kingdom declines in discrete steps from 3.5% per annum to 1% per annum. In France, the official rate begins to decline after 30 years, following a hyperbolic path. In both countries, the discount rate to be applied to benefits in year 200 is lower than the rate for year 100. As a result, more weight is being assigned to the future rather than applying a constant discount rate to benefits in all years.

Source

Adapted from Damon et al., 2013.

Across available examples of the economic appraisal of adaptation actions in Canada (see Appendix 6.4), present values are determined using a discount rate of 3–4% per annum. This implies that studies are using a social or “prescriptive” discount rate. The discount rate is also kept constant over time, even over time horizons of 50 to 100 years.

The choice of discount rate and schedule may not be as critical an issue for appraising adaptation investments as it is for investments in GHG emissions reduction. With the increasing emphasis on early adaptation, and the timing and sequencing of adaptation actions, time horizons for adaptation decisions can be relatively short—typically involving costs and benefits spread over decades, rather than centuries, as with the benefits of GHG emissions reduction projects. For “flow” adaptation actions7, the costs and benefits will fall in the same time period. Furthermore, for most public and private sector decision makers, the discount rate will already be prescribed for specific decision contexts. When contrasting the economic performance of multiple actions to achieve the same adaptation goal that has been appraised using different discount rates, it is important to understand how the different discounting decisions influence the results to avoid “comparing apples and pears.”

6.6.4.3

Distributional considerations

When it comes to aggregating costs and benefits, the standard approach has been to apply equal weights to impacts experienced by diverse actors. This can present decision makers with a different set of distributional concerns, since all potentially exposed actors are not equally at risk. For instance, low-income and disadvantaged groups are often more vulnerable to climate change impacts and have reduced capacities to adapt. From a public policy perspective, it is important to include the distribution of the costs and benefits of adaptation in decision making. The Canadian Cost-Benefit Analysis Guide published by the TBS (2007)—which requires federal departments to analyze the costs and benefits of proposed regulations—explicitly refers to the need for distributional analysis: “Distributional analysis determines the impact of the regulatory proposal on affected stakeholders by category, such as―but not limited to―business size (small, medium-sized and large businesses), income, age, region and gender. Departments are to perform distributional analysis to assess how the estimated costs and benefits are distributed among stakeholders” (TBS, 2018).

Adaptation actions would, of course, be no exception to such a requirement. While trade-offs between an action’s net present value and its distributional impacts remain a political consideration, the literature includes an approach that explicitly integrates distributional dimensions into the summary estimate of net present value. It does this by weighting the different benefits and costs to reflect society’s value of a benefit or cost to one income group relative to the average (see Appendix 6.5). This method of dealing with distributional considerations (e.g., Alder, 2016)—where estimated benefits or costs are multiplied by weighting factors that are inversely proportional to people’s income—dates back to the 1950s and was included in the first CBA manuals (Squire and van der Tak, 1975). While this method does not capture all distributional issues that could be of interest to decision makers, it does focus on income inequality.

In practice, it is rare for equity weights to be applied in traditional economic analysis (Li et al., 2014). None of the economic appraisals of adaptation actions in Canada examined in Section 6.7 consider distributional issues or the formal use of equity weights. In general, however, there is renewed interest in incorporating equity considerations into the economic appraisal of climate change impacts and adaptation (Dennig, 2018), and the application of equity weights is an established way to do it (Rouillard et al., 2016b).

6.7

The benefits of adaptation actions in Canada outweigh the costs

The benefits of planned actions to adapt to climate change in Canada generally exceed the costs, sometimes significantly, providing a strong business case for proactive investment in adaptation. Even when beneficial adaptations are adopted, residual damage costs are often still incurred, suggesting that there are economic limits to adaptation.

Studies of the costs and benefits of adaptation in Canada have used traditional cost-benefit analysis (CBA). Across a sample of 60 adaptation actions to address impacts such as coastal flooding, low water levels, reduced timber supply, heat stress and poor air quality, the average benefit-cost ratio was 5.6:1, with 75% of actions having a ratio greater than one. Across this sample, soft adaptation actions (e.g., changes to planning and pest control practices) performed better than hard engineered actions (e.g., dykes and sea walls). The economic performance of adaptation actions is also highly site-specific and context-specific. Adaptation does not generally cancel out all costs related to climate change costs—some level of residual damage cost is generally still incurred.

6.7.1

Economic analysis of adaptation options in Canada

The body of literature on the appraisal of adaptation costs and benefits in Canada is limited to the public sector and a few climate-sensitive sectors; it therefore covers a narrow range of climate change impacts, regions and potential adaptation actions. This makes it difficult to form widespread generalizations about the costs and economic attractiveness of adaptation actions in all contexts. This section reviews the application in Canada of the methods discussed in Section 6.6.

6.7.1.1

Economic appraisals of adaptation

In general, while the body of evidence on the benefits and costs of climate change adaptation actions has increased significantly in recent years, its scope remains very narrow in terms of climate-sensitive sectors considered, the regional representation of economic studies, and the application of different economic appraisal methods. Nearly 75% of the individual adaptation actions appraised relate to the potential adoption of adaptation actions in coastal areas to address the risk of sea-level rise, storm surge flooding and erosion (see Case Story 6.5). It is worth noting that, while all the available studies perform prospective appraisals of potential adaptation actions that could be adopted, none provide retrospective appraisals of adopted actions. Several studies appraised adaptation actions to address the adverse impacts of low water levels on issues such as marine transport, hydroelectric generation, waterfront property prices, ecological services and fishing in the Great Lakes–St. Lawrence River system. The remaining studies performed economic appraisals of adaptation actions to address adverse climate change impacts on timber supply across Canada, heat stress and air quality in Toronto, snow conditions and length of the ski season at resorts in Quebec, and the functionality of a winter ice road in the Northwest Territories.

These studies clearly represent only a sub-set of climate-sensitive sectors in Canada; there are significant evidence gaps with respect to the economic appraisal of climate change adaptation actions for sectors such as transportation (rail, road and air), water resources (water security and quality), sanitation, energy (including electricity), fishing, agriculture, tourism, ecosystem services and human health. There is also a dearth of evidence on the benefits and costs of planned adaptation to climate-related health impacts, although impacts associated with human health can be some of the most economically significant. As the Larrivée et al. (2015) study for Quebec shows, the total present-value costs of premature mortality due to temperature extremes over the period 2015–2064—measured from a social perspective—were estimated at $33 billion (in 2012 dollars). When also considering Lyme disease, West Nile virus and aeroallergens, the total present-value cost rises to about $35 billion (see Appendix 6.1; Larrivée et al., 2015).

The concentration of accessible studies on a narrow set of sectors means that specific regions of Canada are well represented in the literature (e.g., coastal areas, particularly in Quebec and Atlantic Canada), while others are poorly represented. Except for the forestry sector, there are significant evidence gaps for the Northwest Territories, the Yukon and Nunavut, Ontario, the Interior of British Columbia and the Prairie provinces. Even though Alberta has historically experienced a disproportionate share of weather-related natural catastrophes in Canada (see Section 6.4.2), no accessible studies have examined the benefits and costs of adaptation to climate change in the province. Several studies have performed cost-benefit analyses of measures to reduce impacts from riverine flooding (e.g., IBI Group 2015a, b and c for the City of Calgary), although these studies make no reference to climate change.

There is also a scarcity of accessible literature on the benefits and costs of climate change adaptation actions in Indigenous communities. As part of the First Nation Adapt Program of Crown-Indigenous Relations and Northern Affairs Canada, a methodology was developed to provide department staff with guidance on how to assess the economic implications of continuing to meet the department’s obligations with respect to Indigenous communities in the face of climate change (Girard, 2018). This methodology has been used to appraise the economic impacts of adaptation actions in two different decision contexts (Girard, 2018). The first considered the impact of projected warming on winter roads, and adaptation costs and benefits for the Northern Ontario winter road network. The second considered the costs and benefits of adaptation to coastal flooding from sea-level rise for Indian Island First Nation and Eel River Bar First Nation, both in New Brunswick. In the former context, the economic appraisal determined that building an all-season road network to service communities is economically inefficient compared with the status quo (i.e., winter roads plus emergency fuel subsidy funding), under all scenarios considered. In the second context, the appraisal concluded that investing in near-term flood reduction measures generated benefits that greatly exceeded the associated costs under all flood protection scenarios examined. Quantitative results were not available for these two studies.

In all studies summarized in Appendix 6.4, the appraisal of adaptation benefits and costs was performed using CBA. The available body of literature for Canada does not include applications of CEA or MCDA, or applications of new economic tools—such as RDM, ROA, portfolio analysis and adaptation pathways—to support adaptation decision making under uncertainty.

6.7.1.2

Cost of adaptation

Appendix 6.4 provides some information on the estimated cost of adaptation options, which serve as inputs to cost-benefit analyses. In general, understanding of the cost of climate change adaptation in Canada is in its infancy. Two recent studies, however, have sought to address this knowledge gap. The Insurance Bureau of Canada and the Federation of Canadian Municipalities (2020) estimate that $5.3 billion dollars (in 2019 dollars) need to be invested annually, on average, over a 50-year planning horizon to adapt Canadian public infrastructure (e.g., roads, dykes, water treatment facilities, sewer systems, etc.) to climate hazards. This is equivalent to about 0.26% of national GDP per year. This level of spending on climate change adaptation is consistent with large cities internationally; for example, actual expenditure on climate change adaptation in London, New York and Paris in 2014–2015 amounted to 0.22–0.23% of the GDP for these cities (Georgeson et al., 2016). In terms of individual climate hazards and types of infrastructure, reducing flood risk and investment in grey infrastructure (such as buildings, dykes, roads, etc.), respectively, were associated with the highest levels of expenditures. Regionally, planned annual expenditures on climate change adaptation in Atlantic Canada account for about two-thirds ($3.6 billion) of the national total. The relative cost at a regional level should be viewed with caution, however. The above results are derived from a database of over 400 cost estimates from the climate change adaptation plans of 34 communities across Canada (Insurance Bureau of Canada and Federation of Canadian Municipalities, 2020). Some regions of Canada are underrepresented (such as British Columbia and Nunavut), as are mid-sized urban centres, while other regions (Alberta) and small population centres are over-represented. Furthermore, the adaptation planning process used by the 13 Alberta communities (40% of the sample) in the database encourages prioritization of no-regret and low-regret “soft” measures, with low investment requirements. For these reasons, and the fact that the adaptation actions costed in the community plans likely focus on the top-priority climate risks—and not all risks—the estimated expenditure of $5.3 billion per year is likely an underestimate of the needed investment in adaptation.

A further recent study estimated the required expenditure to adapt municipal infrastructure in Quebec for climate-related risks at $2.8–$5.4 billion (2019 dollars) over the next five years (AGECO Group, 2019).8 This is equivalent to about 0.12–0.23% of GDP annually. Again, the full scale of the required investment in adaptation is likely underestimated, since only a sub-set of public infrastructure is included in the analysis—specifically, water assets (drinking water, sanitation and drainage), green infrastructure and roads.

6.7.2

The economic case for adaptation

To help draw conclusions regarding the economic case for climate change adaptation from the available studies listed in Appendix 6.4, adaptation actions where a benefit-cost ratio (BCR) was reported or could be derived (60 actions in total) are rank-ordered and presented in Figure 6.16. A BCR is given based on the present value of benefits of an adaptation action, divided by its present value costs. As such, it controls for the scale of adaptation actions, thereby facilitating comparisons across actions of different size (other factors limiting comparisons are discussed below). A BCR greater than one indicates that an adaptation action’s benefits exceed the costs incurred to generate those benefits—such an action would typically be a justifiable investment on economic efficiency grounds. However, not all actions with a BCR greater than one are necessarily implemented, as their implementation depends on a range of factors, including available resources (see Section 6.8.1).

Figure 6.16 shows that, across the 60 adaptation actions, 75% pass a cost-benefit test. The unweighted average BCR is 5.6 (i.e., every dollar invested in climate change adaptation actions generates, on average, $5.60 in benefits). The average BCR is heavily skewed by a handful of extremely high values, however. The unweighted median BCR is 1.5, and half of the values lie between 0.9 and 2.7. These values are consistent with international experience—for example, in a review of a statistical sample of the nearly 5,500 Federal Emergency Management Agency (FEMA) grants in the U.S. awarded between 1993 and 2003 for addressing earthquake, flood and wind hazards, Rose et al. (2007) found that the overall average BCR ratio was about 4.0, whereas the average BCR for flood reduction measures was 5.1. Likewise, the Global Commission on Adaptation found that $1 judiciously invested in climate change adaptation could generate $2–10 in economic benefits (Global Commission on Adaptation, 2019).

The available examples from the 60 adaptation actions suggest that “soft” adaptation actions (with a mean BCR of more than 10:1) represent more economically efficient investments than “hard engineering” adaptation actions (with a mean BCR of about 3:1). This is largely due to the higher upfront investment expenditures needed for the latter set of actions. It is also partly due to the inclusion of monetized co-benefits generated by some of the “soft” actions (specifically in the appraisal of coastal adaptation actions in Quebec) and to the inclusion of both direct and indirect benefits (i.e., avoided costs) in a couple of studies (e.g., timber supply) that examined only “soft” adaptation actions. As noted in Section 6.6.1, the economic performance of a project is only one of several important criteria for selecting adaptation options. In some cases, “soft” options may not offer an acceptable level of risk reduction, thus necessitating the adoption of “hard” options, which may have less attractive BCRs.

In general, the diversity of methodological choices makes comparing results across available appraisals of adaptation costs and benefits difficult. Studies use different time horizons, emissions scenarios and norms; they make different assumptions about socioeconomic development, and monetize different combinations of market and non-market impacts, co-benefits, and direct and indirect impacts (see Case Story 6.6). They also use different discount rates, though this is less of an issue regarding the comparability of studies, since nearly all apply constant rates of 3–4% per annum, which is indicative of a prescriptive rather than a descriptive approach to discounting (see Section 6.6.3.2).

Figure 6.16

-

Figure A is a bar graph that shows the benefit-cost ratios of different types of adaptation actions from the sample, differentiated by sector. The coastal flooding and erosion sector makes up most of the projects with a very high benefit-cost ratio (BCR) and has a mean estimated BCR of 6.3. Timber supply adaptation has a mean BCR of 23.6. Water levels has a mean BCR of 1.8. Human health has a mean BCR of 1.6, and ice roads have a mean BCR of 2.7. Figure B is a bar graph that shows the benefit-cost ratios of these actions, differentiated by category of adaptation action: “soft policy” actions (for example, planned retreat, enhanced pest control, and flexible scheduling); “soft engineering” actions (for example, beach nourishment and green roofs); “hard engineering” actions (for example, dykes, weirs, and sea walls); and “combination” actions. Soft policy, soft engineering, and hard engineering are among the actions with the highest BCR. Soft policy actions have an average BCR of 10.3. Soft engineering actions have an average BCR of 11.1. Hard engineering actions have an average BCR of 3.0, and combination actions have an average BCR of 2.0.
Figure 6.16

The figure shows estimated benefit-cost ratios (BCR)—present-value benefits divided by present-value costs—for 60 adaptation actions in Canada (see Appendix 6.4). Of the actions considered, 75% have a BCR greater than one, indicating that the benefits exceed the costs incurred to generate those benefits (i.e., these would typically be considered as justifiable investments on economic efficiency grounds). The unweighted average BCR across the 60 actions is 5.6, although the unweighted median BCR is 1.5. a) shows the benefit-cost ratios of different types of adaptation actions from the sample, differentiated by climate-sensitive sector, and b) shows the benefit-cost ratios of these actions, differentiated by category of adaptation action: “soft policy” actions (e.g., planned retreat, enhanced pest control, flexible scheduling); “soft engineering” actions (e.g., beach nourishment, green roofs); “hard engineering” actions (e.g., dykes, weirs, sea walls); and “combination” actions.

Source

Data source: see Appendix 6.4

6.7.3

Residual damages

It is evident from the NRTEE (2011) studies in Appendix 6.4 that, even with adaptation actions in place, residual costs from damage due to climate change remain. For instance, the cost of adopting a portfolio of adaptation actions to address the impacts of climate change on timber supply is $2.3–3.6 billion (in present value terms, at a 3% constant discount rate over the period 2010‒2080) and reduces economic losses by $19.9‒137.9 billion, but residual losses of $4.6‒37.1 billion remain. The total costs of climate change in this case are therefore $6.9‒40.7 billion. While not explicitly reported by the other studies listed in Appendix 6.4, a quick comparison of the results in Appendix 6.1 and Appendix 6.2 with those in Appendix 6.4 reveals the presence of residual damage costs in most cases, suggesting potential—though undefined—limits to what adaptation can achieve (see Section 6.8.1). The presence of residual costs does not indicate that an action is poorly designed or that an insufficient level of adaptation was implemented; it may simply indicate that aiming for zero residual damages is not feasible or that its costs would exceed the dollar value of avoided damages.

6.8

There are economic barriers and limits to adaptation

There is a range of ecological, technological, economic and institutional barriers to adaptation, which limit the potential to reduce negative climate change impacts and benefit from new opportunities. Government can play an important role in addressing these barriers, although an economically efficient level of adaptation will likely involve some residual costs.

In addition to financial constraints, various market, behavioural and policy barriers are contributing to an adaptation gap—the difference between the level of adaptation required to offset all negative climate change impacts or to benefit from all new opportunities. This is further complicated by ecological and technological limits to adaptation. Government intervention can play a strong role in addressing these barriers and incentivizing adaptation by other actors. Some adaptation actions and public policies designed to support adaptation cannot be justified on economic grounds (i.e., with social costs that exceed social benefits) or will simply be too costly relative to available resources. Consequently, the level of adaptation that is achievable, even with government intervention, will generally not overcome all consequences of climate change. Residual damages will likely be part of any economically efficient adaptation strategy.

6.8.1

Introduction

Both theory and evidence indicate that adaptation cannot cancel out all negative climate change impacts, nor can it capture all positive impacts (Chambwera et al., 2014; Dow et al., 2013). Earlier sections in this chapter highlight potential instances of insufficient or ineffective adaptation (e.g., the current adaptation deficit with respect to extreme weather events in Canada) (see Section 6.4.2). This section examines barriers and limits to adaptation from an economic perspective. A barrier refers to any type of challenge, obstacle or constraint that can impede or stop the adoption of certain adaptation actions by businesses or households, but that is surmountable with concerted effort; a limit is a constraint that cannot be overcome without incurring unreasonable costs or taking unreasonable action (Eisenack et al., 2014; Productivity Commission, 2012).

6.8.2

Barriers and limits to adaptation from an economic perspective

From an economic perspective, private actors such as businesses and households are expected to undertake a significant amount of adaptation as they modify decisions and behaviours in response to climate signals to maximize their profit or welfare (Mendelsohn, 2012). Such behavioural reactions to climate stimuli form the premise underlying what is referred to as autonomous adaptation (Fankhauser, 2017). For example, people adjust their vacation destinations or travel dates in response to climate (Hamilton et al., 2005), and farmers adjust crops or use different harvest or seeding dates in response to changing precipitation patterns (Food and Agriculture Organization, 2007).

However, there is evidence that autonomous adaptation by businesses and individuals is not always adequate or efficient (Eisenack et al., 2014; Klein et al., 2014; Porter et al., 2014; de Bruin et al., 2011; Agrawala et al., 2010). There are multiple barriers and limits to private adaptation (Biesbroek et al., 2013), which means that only a subset of adaptation needs may be met in practice (see Figure 6.17). Limits can be technological (e.g., snow-making equipment may not be able to sustain adequate snow cover at lower altitude ski resorts as the climate warms), ecological (i.e., ecosystems and species may be unable to adapt at higher rates of warming), economic (i.e., the level of adaptation that is justified on economic grounds once the lifecycle costs of actions have been considered, in relation to the projected benefits), and institutional (e.g., available funding and capacity) (Chambwera et al., 2014). The gap between the level of adaptation required to cancel out all negative impacts (or capture benefits from all opportunities) and the maximum potential for adaptation after taking into account technological and ecological limits is referred to as the “unavoidable impacts” (Chambwera et al., 2014). However, not all actions for overcoming avoidable impacts will pass a basic cost-benefit test, which is indicative of the economic potential for adaptation. The lifecycle costs of some adaptation actions will exceed the economic costs averted, indicating that alternative investments offer better value for money.

Figure 6.17

-

Illustration of a layered circle showing the level of adaptation that is achievable after accounting for instruments to overcome barriers. Adaptation needs are represented by the largest circle and are defined as “the level of adaptation needed to either cancel out all negative impacts or to benefit from all opportunities related to climate change.” Maximum potential is represented by a slightly smaller circle and is defined as “the maximum level of adaptation possible, once technological and ecological limits have been considered.” Economic potential is represented by a smaller circle and is defined as “the economic potential for adaptation, once the lifecycle costs of actions have been considered (not all actions will pass a cost-benefit test).” Achievable potential is represented by a still smaller circle and is defined as “the level of adaptation that is achievable, after accounting for instruments to address barriers to adaptation (with these instruments having passed a cost-benefit test).” Policy potential is represented by the smallest circle and is defined as “the level of adaptation that can be adopted, depending on available funding and institutional capacity.”
Figure 6.17

Economic barriers and limits to the maximum potential for adaptation.

Source

Adapted from Chambwera et al., 2014; US Environmental Protection Agency, 2007.

6.8.2.1

Market failures

Simply because an adaptation action passes a cost-benefit test in theory does not necessarily mean that it will be adopted in practice. The economics literature is rife with a long list of barriers that can hamper the ability of individuals and businesses to allocate resources to welfare-improving adaptation actions (Klein et al., 2014). Markets may fail to provide decision makers with appropriate information about all of the costs and benefits of adaptation, leading to inefficient levels of investment in adaptation. This may happen because the required information is inadequate or not equally available to all parties in a decision, and may also be due to the presence of externalities, public goods and misaligned incentives, where the benefits of adaptation do not accrue to the individual or entity paying for it (see Box 6.2; Productivity Commission, 2012; Braeuninger et al., 2011; Ekstrom et al., 2011; Cimato and Mullan, 2010; Moser and Ekstrom, 2010; Stern, 2006).

6.8.2.2

Behavioural failures

Even when markets send private actors the right signals, these actors do not necessarily make choices in their best interests or those of society at large, due to several behavioural anomalies and biases. The type, complexity and volume of information available, and the way in which it is communicated and by whom, all have a significant impact on the likelihood that people will read, understand and use it efficiently. Cognitive capacity, for instance, is known to affect our ability to make efficient adaptation decisions involving complex, probabilistic information (Grothmann and Patt, 2005). Other potential behavioural anomalies and biases manifest as decision inertia, procrastination and high discount rates (e.g., Boyd et al, 2015). As a result, individuals are observed to make seemingly irrational choices that deviate from what classical economics would predict (i.e., to maximize net benefits or welfare). Such irrational aspects of decision making are often referred to as behavioural failures.

6.8.2.3

Policy failures

Policy failures can also create barriers to the adoption of an economically efficient level of adaptation (Her Majesty’s Government, 2013; Cimato and Mullan, 2010). These failures arise when regulation distorts market transactions, thus incentivizing private actors to under- or over-invest in adaptation. For example, government transfers for hard flood protection measures and disaster aid provide incentives that fuel a self-reinforcing cycle of continued growth in coastal areas that are prone to flooding, even though retreat or abandonment represents the welfare-maximizing course of action (Kousky, 2014; Filatova 2013; Filatova et al., 2011). Taxes on insurance products and property transactions are another example (Boyd et al., 2015). Policy failures can also occur in the presence of conflicting or competing policy objectives, or when there is a lack of clarity around objectives.

6.8.3

Role for governments

The presence of market, behavioural and policy failures means that the economic potential for adaptation is not fully realized. This creates a key role for government (Fankhauser, 2017):

  • Firstly, to remove policy distortions that impede economically efficient adaptation choices by private actors: for example, to reform (e.g., reduce, restructure or eliminate) the subsidies that fuel the self-reinforcing cycle of continued growth in coastal or riverfront areas that are prone to flooding (Boyd et al., 2015).
  • Secondly, to use regulatory and economic instruments to overcome market and behavioural failures, and to provide incentives for efficient private adaptation (e.g., Boyd et al., 2015; Hotte and Nelson, 2015). Regarding the use of economic instruments to incentivize adaptation, it is important for the design of these instruments to account for common behavioural failures that have the potential to undermine their effectiveness (Boyd et al. 2015).
  • Thirdly, to provide public goods and services dedicated to adaptation, like the production and dissemination of climate information, spending on research and monitoring programs, investment in large-scale flood protection, early warning systems for communities, improvements to emergency planning and preparedness, and the development of policies to enhance the resilience of ecosystems.

However, not all forms of government intervention will make sense from an economic perspective. It is also necessary to demonstrate that the benefits arising from such interventions exceed the costs of implementation for private actors and government (Productivity Commission, 2012). Only a certain level of adaptation is achievable after accounting for the effectiveness of regulatory and economic instruments to redress barriers to efficient adaptation, with these instruments themselves having passed a cost-benefit test (see Figure 6.11).

Some individuals, businesses or communities may be unable to afford or finance the required investment in planned adaptation actions, even though they know it is in their best interest to do so (Lecocq and Shalizi, 2007).9 Another role for government is to aid vulnerable and disadvantaged groups and communities that do not have access to the necessary resources to adapt sufficiently (Fankhauser, 2017). At the same time, governments too will face financial and capacity constraints, and must allocate resources among competing needs. When an economically efficient level of adaptation is achieved after allowing for technical, social and ecological constraints, residual damages may well occur. The fact that some level of residual damages may be unavoidable gives rise to a range of important ethical and social justice issues that are at the core of the “loss and damage” discourse at the international level—referring to unavoidable impacts beyond the limits of adaptation (van der Geest and Warner, 2015). While a discussion of these issues is outside the scope of this chapter (see Wallimann-Helmer et al., 2019 for an overview of the main ethical and justice challenges), government may also have a role in defining what is an acceptable level of residual damage and how best to reconcile the welfare effects of these unavoidable impacts.

6.9

Moving forward

Decision makers are increasingly demanding information on the current breadth and depth of evidence available for characterizing the costs of climate change for Canada, as well as the net value of different adaptation actions, for the purpose of informing the business case for action. There is an increase both in the volume and quality of evidence on the costs of climate change, and on the costs and benefits of adaptation, reflecting the growing importance of economic information for decision makers. However, there are also many knowledge gaps, which points to a rich new research agenda.

6.9.1

Costs of inaction

There is much that is yet to be known about the costs of climate change for Canada, both in aggregate and for specific sectors, regions, communities and vulnerable populations. Future projections of the total economic consequences of climate change for Canada are highly uncertain. Some simplified, highly aggregate modelling exercises project net gains for Canada’s economy, while others project net losses. Further study is needed to resolve uncertainty around the aggregate cost of climate change for Canada.

Adaptation decisions are largely made at the local or provincial level, where the current state of knowledge regarding the cost of inaction is highly fragmented. There are large knowledge gaps when it comes to the Prairie provinces, the Northwest Territories, the Yukon and Nunavut, the Interior of British Columbia, Ontario, as well as First Nations, Inuit and Métis peoples. Furthermore, high-quality estimates of economic consequences exist for only a few Canadian cities. Given that most adaptation decision making takes place at the local level, a priority for future research should be not only to resolve uncertainty around the total economic consequences for Canada in aggregate, but to improve the geographical coverage and scope of damage estimates for municipalities, as well as the level of disaggregation by sectors, assets and services, and climate hazards. This implies the need for a bottom-up, multi-sector approach that addresses several cross-cutting gaps in the current literature. Recommendations for new economic studies include the following:

Studies considering a broader range of climate hazards: Most of the available national-level aggregate projections (and most regional projections) are focused on slow-onset climate impacts (i.e., gradual changes in temperature and precipitation, and select biophysical impacts that result from these changes). Future investigations of economic consequences would benefit from increased attention on extreme events and catastrophes (i.e., low-probability and high-consequence events).

Studies considering a broader range of climate-sensitive sectors: Some sectors are better represented in the current economic literature than others. A range of estimates are available for coastal zones, agriculture and forestry. For other sectors—namely, tourism, labour, water resources and public health—only a few incomplete estimates are available. There are also major gaps in our understanding of the economic consequences of climate change for public health. Other sectors are not yet represented in the literature, such as ecosystems, fisheries, energy infrastructure (including oil and gas), transportation infrastructure (including rail, air and ports), water quality and security (e.g., crime, migration, conflict).

Studies considering a broader range of economic impacts: A comprehensive assessment of economic consequences would capture both market and non-market impacts. An important consequence of climate change for welfare is the loss of goods and services that are not traded in markets and therefore cannot be valued using market prices or captured by CGE models. Examples of broader economic impacts worthy of study include species loss, pain and discomfort, loss of cultural heritage, conflict and forced migration. These welfare losses can be sizeable, even though they are largely omitted from current estimates. Research is needed to ensure that they are better represented in future estimates of economic impacts.

Studies considering inter-sectoral impacts: There is a broad range of potentially important inter-sectoral impacts that are not well captured, especially within a bottom-up, multi-sector approach. For example, water is used to produce electricity (e.g., for thermal cooling), and electricity is used to supply water (e.g., to operate pump stations). These linkages are typically omitted from estimates. Some non-biophysical interactions occur through market mechanisms and can be captured using CGE models, for instance. Other interactions do not function in this manner, such as when damage to ecosystems amplifies other impacts. Research is needed to understand which inter-sectoral linkages are economically significant at a local or regional level, and should therefore be captured in the next generation of estimates.

Studies considering socioeconomic developments: An important conclusion from the current literature concerns the importance of future socioeconomic change (e.g., growth in populations, assets and wealth) as a key driver of the absolute magnitude of projected economic costs. Despite the demonstrable role of such change as a determinant of the cost of inaction, socioeconomic futures are either incompletely addressed or not addressed at all in many current studies.

6.9.2

Costs and benefits of adaptation

Knowledge relating to the appraisal of adaptation costs and benefits in Canada is currently restricted in scope to a few climate-sensitive sectors, which in turn means that only a narrow range of adaptations to a limited set of climate impacts in specific regions has been considered to date. Also, existing studies are almost exclusively focused on the public sector. Consequently, despite the promising results from existing studies (see Section 6.7.1), it is not possible to make widespread generalizations about the economic attractiveness of adaptation actions in all contexts. There is a lot to learn about the costs and benefits of the full range of adaptation that is likely needed to manage the impacts of climate change regarding tolerable levels. Research is needed to understand more about the economic efficiency of capacity building actions and public policy interventions to overcome barriers to adaptation. This includes understanding how lessons from behavioural economics can be used to improve the design and effectiveness of policies to provide incentive for implementing desirable levels of private adaptation. At the same time, a better understanding of current public policies that promote maladaptation is needed; removing prevailing policy failures is crucial if interventions to incent adaptation are to be effective.

While theory favours short-lived, flexible and relatively inexpensive “soft” adaptation measures over long-lived, capital-intensive, “hard” adaptation measures in the face of deep uncertainties, it has yet to be demonstrated in Canada through practical applications which adaptations have the greatest merits, and under what circumstances. Case studies are needed to better understand the economic merits of sequencing adaptation decisions over time under multiple futures, rather than making a single, seemingly optimal decision now. All of the current “proof of principle” examples are international.

Current economic appraisals pay scant attention to distributional issues and to the political economy of adaptation (i.e., how adaptation decisions are made, taking into account political, cultural and economic factors). Adaptation, like any form of intervention, will typically have winners and losers, although none of the economic studies that have been formally reviewed considered the distribution of costs and benefits across actors. Since distributional impacts are a major talking point in local, provincial and national debates about climate policy, a sounder understanding of these impacts would aid in both the design of adaptation actions and in moving towards implementation.

Finally, awareness of the cost of climate change adaptation in Canada is only starting to develop, helped by two recent studies of the level of investment needed to adapt public infrastructure to climate change at the national level (Insurance Bureau of Canada and Federation of Canadian Municipalities, 2020) and in Quebec (AGECO Group, 2019). However, many knowledge gaps remain. For instance, there is no information on the aggregate level of investment needed to adapt other economic sectors for anticipated climate change impacts. Even regarding public infrastructure, there is poor understanding of adaptation investment needs for certain parts of the country (e.g., British Columbia and Nunavut) and for larger population centres. These knowledge gaps make it difficult to characterize the scale of the required adaptation effort, how it should be financed and—in conjunction with estimates of adaptation benefits—how available funds should be deployed.

6.9.3

Emerging issues

The framing of adaptation decision making is changing, with implications for adaptation economics. Whereas the predominant approach to navigating the assessment and planning stages of an adaptive risk management framework was historically based on a “science-first” (or “top-down”) approach, there has been a recent shift in the economic literature towards a “policy-first” (or “bottom-up”) analytical process, with a focus on early action (see Section 6.2.3).

This shift has significant implications for the economic analysis of adaptation actions and necessitates the development and application of alternative decision support tools. Where consideration of deep uncertainties over future impacts is important—and where decision makers are looking for flexible or robust options—new economic decision support tools like adaptation pathways, real options analysis, robust decision making and portfolio analysis are more appropriate for economic appraisal than conventional tools like cost-benefit analysis (see Section 6.2.5).

The greater importance placed on capacity building, behavioural interventions and the value of information under the “policy-first” approach also creates challenges for the monetization of costs and benefits, requiring different approaches to the quantification of physical impacts and their subsequent valuation. Increased consideration of the adaptation process also places greater emphasis on understanding barriers and economic limits to efficient adaptation (e.g., market, behavioural and policy failures), and on the costs and benefits of government interventions designed to overcome these barriers (see Section 6.8). Designing effective policy interventions requires an understanding of behavioural responses to different incentives. In short, economic decision support is itself adapting to meet the evolving needs of decision makers.

There is growing recognition that an efficient level of adaptation is being hampered by more than issues of affordability. A combination of market failures (e.g., lack of quality, accessible information on relevant risks and adaptation responses, or the presence of public goods or externalities), behavioural anomalies (e.g., cognitive capacity, inertia, high discount rates) and prevailing policy distortions (e.g., subsidies that ultimately promote maladaptation) limit the potential for adaptation (see Section 6.8). There is a greater role for government at all levels to do more than provide financial assistance and invest in public goods (such as climate information services). Other important steps to take include removing prevailing policy distortions, and designing and implementing regulations and economic instruments to overcome relevant market imperfections and behavioural failures. Equally important is the need for governments to reflect on what would be an acceptable level of residual damage and how best to address the welfare effects of unavoidable impacts, given the potential for significant ethical and social justice concerns.

Another talking point in the economic literature is the extent to which the economic consequences of climate change could be much higher than current projections suggest—not because of the limitations of emissions and climate change impact models, which omit important risks, but because of how economic models treat damages and growth. The issue is whether the level of economic output is either reduced by a climate shock or stress, but with the underlying rate of economic growth being unaffected, or whether climate change has a more persistent, cumulative impact on the growth rate itself. Until recently, most estimates of the cost of climate change were based on static losses of annual economic output. However, if climate change causes lasting damage to capital stock, land and the efficiency at which these factors and labour are turned into economic output, as some scholars suggest, then the annual growth rate will be affected in addition to the output level, leading to much deeper and longer-lasting impacts on economic output, due to the compounding effects of reduced growth. The debate remains unsettled in the literature.

6.10

Conclusion

This chapter assessed the state of knowledge and practice of climate change impacts and adaptation economics in Canada. Information on the economic consequences of climate change, as well as the costs and benefits of adaptation actions, are increasingly being demanded by a wide range of decision makers. Within an adaptive risk management framework, economic information can be used to raise awareness about the need to allocate resources to adaptation planning, as well as to inform the prioritization of current and future climate risks and vulnerabilities. Economic information can also be used to inform the selection and level of resources allocated to adaptation actions. Overall, the breadth, depth and quality of knowledge in Canada on this topic are increasing. There is much that we now know about the potential costs of climate change for certain regions, sectors and cities. A strong business case is also evident for adaptation investments in specific contexts. While the state of knowledge and practice is improving, it is clear that the evidence base is still highly fragmented and that important gaps in knowledge and coverage remain.

There is evidence of an adaptation deficit or gap in Canada, demonstrated by the fact that households, businesses and infrastructure, etc. are under-adapted to current climate conditions and variability. Not all of the rising losses can be explained by growing exposures, asset values and general price inflation, suggesting that climate change may be playing a role, potentially foreshadowing growing levels of losses that might be expected in the future with climate change anticipated to intensify. Do projections of future climate change costs for Canada support this conjecture? The short answer is yes. The bulk of the evidence suggests that climate change will impose increasing overall welfare losses on Canadians, though welfare gains are expected in some sectors and in some parts of the country.

Looking to the future, climate change is projected to impose substantial economic costs on individual sectors and regions. Under high-emissions scenarios without new adaptation actions, economic costs in some sectors and regions could amount to 100s of millions to 10s of billions of dollars annually by the 2050s, and higher still by the end of the century (NRTEE, 2011). Affected sectors and regions include forestry, coastal areas, public health, ski resorts, marine transport, hydroelectric generation, municipal water treatment and waterfront properties in the Great Lakes–St. Lawrence River system. Projections of economic consequences for agriculture vary—most studies project economic benefits from climate change impacts on crops, with the largest gains being in the Prairie provinces. The limitation is that these studies only consider changes under average conditions, and do not consider the negative impacts associated with changes in climate and weather extremes. For the few cities for which information is available, climate change is anticipated to have negative economic consequences.

The economic consequences of climate change for Canada can be assessed at a mix of different spatial scales (national, provincial/territorial, regional, municipal) and sectoral scales (single-sector or multi-sector). At each scale, cost assessments may also differ significantly in scope—in terms of the climate impacts considered (e.g., one or more slow-onset impacts or rapid-onset impacts), the types of costs measured (e.g., direct, indirect, macroeconomic, market, non-market) and time frames (e.g., short-term, medium-term, long-term). In general, existing studies of the economic impact of climate change have been very narrow in scope and sectoral coverage. Higher damage costs are projected by studies with wider scopes that considered extreme weather and climate events in addition to slow-onset climate change impacts, captured impacts on multiple sectors, included non-market impacts and measured impacts on the welfare of Canadians, as opposed to changes in GDP. If cost assessments adopted a more comprehensive scope, then the estimated costs of climate change for Canada would likely be significantly higher than the current studies suggest.

Economic appraisals of adaptation actions in Canada find that the benefits generally exceed the costs, though results are highly context-specific. Across a narrow sample of 60 appraisals of actions (largely in municipal settings) to reduce impacts from coastal flooding, low water levels in the Great Lakes–St. Lawrence River system, reduced timber supply, heat stress and poor air quality in Toronto, 75% of the actions passed a cost-benefit test. The median benefit-cost ratio was 5.6:1 (1.5:1)—each dollar spent on risk reduction generated, on average, $5.60 in benefits (see Section 6.7.2). Returns on investment in adaptation of these magnitudes are consistent with the international experience.

Several observations can be drawn from the available evidence. Firstly, among the sample of adaptation actions that were assessed, “soft” adaptation actions provided better value for money than did “hard” engineering actions, due primarily to lower investment costs and the propensity to provide greater co-benefits. A number of these actions are also characterized as nature based solutions, where action is taken to reinforce and protect existing ecosystems. Secondly, the economic performance of adaptation actions is highly site-specific and context-specific—the same action that passes a cost-benefit test at one location may fail at another location, and results are not generally transferable. Thirdly, adaptation does not typically cancel out all climate change costs—some residual damage costs persist. This latter point highlights potential ecological, technological and economic limits to adaptation. It also implies that even with an economically efficient level of adaptation, welfare levels might still be lower than they otherwise would be in the absence of climate change. The fact that some level of loss may be unavoidable presents a range of ethical and social justice challenges, requiring governments to define what is an acceptable level of residual damage and how best to reconcile the welfare effects of these unavoidable impacts.

Overall, the emerging business case for adaptation looks promising, although the evidence base is incomplete. There is still a lot to learn about the costs and benefits of adapting to current and future climate change in a broader range of sectors (including the private sector), about the broader range of risks, and the need to consider a broader set of actions, including regulatory and economic instruments. Little is known about the distribution of adaptation costs and benefits. All current studies reviewed in this chapter are prospective appraisals of largely hypothetical adaptation actions that could—in principle—be adopted. None of the findings are based on retrospective evaluations of implemented actions; thus, the findings are more representative of the theoretical “economic potential” for adaptation, as opposed to the more realistic “policy potential” (see Figure 6.11).

Providing projections of quantifiable financial costs and benefits is not enough given the diverse objectives, interests, knowledge and values that decision makers now bring to climate change adaptation decisions. There are many available economic tools that can support multi-metric appraisals, although only simple forms of traditional CBA have been applied to date. Firstly, there are approaches to capture distributional impacts, intergenerational equity issues, co-impacts and non-market impacts within traditional tools like CBA. Secondly, economics offers a set of new approaches that work with traditional tools like CBA to provide useful support for adaptation decision making under deep uncertainty, incorporating the time-phasing of actions over long time frames and the potential for learning. Each of the available tools has unique strengths and weaknesses depending on the adaptation decision context and the level of uncertainty. There is no “best” one-size-fits-all approach to the economic appraisal of adaptation actions.

The choice of economic decision support tool(s) might be case-specific, but the literature does identify several best practices that would characterize good economic analysis, in particular the following: covering a broad representation of specific climate and biophysical impacts—including both extreme rapid-onset and slow-onset impacts; considering projected socioeconomic developments; considering multiple “hard” and “soft” adaptation actions, including analysis of barriers to their effective adoption, and interventions to address these barriers; investigating both climate and non-climate sources of uncertainty, including consideration of the time phasing and sequencing of actions using new economic tools for decision making under uncertainty (e.g., adaptation pathways, real options analysis); analyzing lifecycle costs (including transaction costs) and benefits across the broadest practical scope of market and non-market impacts; and scrutinizing distributional impacts on vulnerable populations, disadvantaged groups and future generations.

6.11

References

Ackerman, F. and Stanton, E. (2006). Climate Change – the Costs of Inaction. Report for Friends of the Earth England, Wales and Northern Ireland. Global Development and Environment Institute, Tufts University, Medford, Massachusetts, 38 p. Retrieved December 2020, from <http://frankackerman.com/publications/climatechange/Climate_Change_Costs_Inaction.pdf>

AGECO Group (2019). Vers de grandes villes résilientes : le coût de l’adaptation aux changements climatiques. Groupe AGECO, Montréal, Quebec, 25 p. Retrieved December 2020, from <https://umq.qc.ca/wp-content/uploads/2019/05/adaptations-chgt-climat-caucus-gdes-viles-10mai19b.pdf>

Agrawala, S., Carraro, C., Bosello, F. and de Bruin, K. (2010). Plan or react? Analysis of adaptation costs and benefits using integrated assessment models, OECD Environment Working Papers No. 23, OECD, Paris, France. Retrieved December 2020, from <https://www.oecd-ilibrary.org/plan-or-react_5km975m3d5hb.pdf?itemId=%2Fcontent%2Fpaper%2F5km975m3d5hb-en&mimeType=pdf>

Agrawala, S., Bosello, F., Carraro, C., De Cian, E., Lanzi, E., de Bruin, K. and Dellink, R.B. (2011). Plan or react? Analysis of adaptation costs and benefits using Integrated Assessment Models. Climate Change Economics, 2(3), 175–208. Retrieved December 2020, from <https://doi.org/10.1142/S2010007811000267>

Alder. M. (2016). Benefit-cost analysis and distributional weights: an overview. Review of Environmental Economics and Policy, 10(2), 264–285. Retrieved December 2020, from <https://scholarship.law.duke.edu/faculty_scholarship/3110>

Amiraslany, A. (2010). The impact of climate change on Canadian agriculture: a Ricardian approach. Doctoral dissertation, Department of Bioresource Policy, Business and Economics, University of Saskatchewan, Saskatoon, Saskatchewan, 169 p. Retrieved December 2020, from <https://harvest.usask.ca/handle/10388/etd-05252010-102012>

Aon (2020). Weather, climate and catastrophic insight: 2019 annual report. Aon plc, Chicago, Illinois, U.S., 80 p. Retrieved December 2020, from <https://www.aon.com/global-weather-catastrophe-natural-disasters-costs-climate-change-2019-annual-report/index.html?utm_source=regionemeauk&utm_campaign=natcat20>

Arrow, K.J., Cline, W.R., Maler, K-G., Munasinghe, M., Squitieri, R. and Stiglitz, J.E. (1996). Intertemporal equity, discounting, and economic efficiency, Chapter 5 in Climate Change 1995: Economic and social dimensions of climate change (Contribution of Working Group III to the Second Assessment Report of the Intergovernmental Panel on Climate Change), (Eds.) J.P. Bruce, H. Lee and E.F. Haites. Cambridge University Press, Cambridge, Massachusetts, 125–144. Retrieved December 2020, from <https://www.ipcc.ch/report/ar2/wg3/#report-chapters>

Arrow, K.J., Cropper, M.L., Gollier, C., Groom, B., Heal, G.M., Newell, R.G., Nordhaus, W.D., Pindyck, R.S., Pizer, W.A., Portney, P.R., Sterner, T., Tol, R.S.J. and Weitzman, M.L. (2012). How should benefits and costs be discounted in an intergenerational context? The views of an expert panel. Resources for the Future Discussion Paper No.12–53, Washington, D.C., 31 p. Retrieved December 2020, from <https://papers.ssrn.com/sol3/papers.cfm?abstract_id=2199511>

Arrow, K.J., Cropper, M.L., Gollier, C., Groom, B., Heal, G.M., Newell, R.G., Nordhaus, W.D., Pindyck, R.S., Pizer, W.A., Portney, P.R., Sterner, T., Tol, R.S.J. and Weitzman, M.L. (2014). Should governments use a declining discount rate in project analysis? Review of Environmental Economics and Policy, 8(2), 145–163. Retrieved December 2020, from <https://doi.org/10.1093/reep/reu008>

Asian Development Bank (2015). Economic analysis of climate-proofing investment projects. Mandaluyong City, Philippines, 85 p. Retrieved December 2020, from <https://www.adb.org/sites/default/files/publication/173454/economic-analysis-climate-proofing-projects.pdf>

Aubé, M., Hébert, C., Wilson, J., Trenholm, R. and Patriquin, M. (2016). Cost benefit analysis of climate change adaptation strategies for the Acadian Peninsula. Green Analytics and the Coastal Zones Research Institute Inc., Shippagan, New Brunswick, 87 p. Retrieved December 2020, from <https://adaptationpa.ca/images/PDF_-_Progression/R-Cost_Benefit_Analysis_of_Climate_Change_Adaptation_Strategies.pdf>

Ayouqi, H. and Vercammen, J. (2014). Evaluating the impact of climate change on Canadian prairie agriculture. Linking Environment and Agriculture Research Network (LEARN). Research Project PR-01-2014, University of British Columbia, Vancouver, 18 p. Retrieved December 2020, from <https://learnnetwork.ualberta.ca/wp-content/uploads/sites/70/2018/07/PR_01_2014_Ayouqi-Vercammen.pdf>

Azfar, O. (1998). Rationalizing hyperbolic discounting. Journal of Economic Behaviour and Organization, 38(2), 245–252. Retrieved April 2021, from <https://doi.org/10.1016/S0167-2681(99)00009-8>

Bain, P.G., Milfont, T.L., Kashima, Y., Bilewicz, M., Doron, G., Garðarsdóttir, R.B., Gouveia, V.V., Guan, Y., Johansson, L-O., Pasquali, C., Corral-Verdugo, V., Aragones, J.I., Utsugi, A., Demarque, C., Otto, S., Park, J., Soland, M., Steg, L., González, R., Lebedeva, N., Madsen, O.J., Wagner, C., Akotia, C.S., Kurz, T., Saiz, J.L., Wesley Schultz, P., Einarsdóttir, G. and Saviolidis, N.M. (2015). Co-benefits of addressing climate change can motivate action around the world. Nature Climate Change, 6, 154–157. Retrieved August 2020, from <https://doi.org/10.1038/nclimate2814>

Berry, P., Yassin, F., Belcher, K. and Lindenschmidt, K. E. (2017a). An economic assessment of local farm multi-purpose surface water retention systems under future climate uncertainty. Sustainability, 9(3), 456. Retrieved August 2020, from <https://doi.org/10.3390/su9030456>

Berry, P., Yassin, F., Belcher, K. and Lindenschmidt, K. E. (2017b). An economic assessment of local farm multi-purpose surface water retention systems in a Canadian Prairie setting. Applied Water Science, 7(8), 4461–4478. Retrieved August 2020, from <https://doi.org/10.1007/s13201-017-0592-7>

Biesbroek, G.R., Klostermann, J.E.M., Termeer, C.J.A.M. and Kabat, P. (2013). On the nature of barriers to climate change adaptation. Regional Environmental Change, 13, 1119–1129. Retrieved August 2020, from <https://doi.org/10.1007/s10113-013-0421-y>

Bloemen, P., Reeder, T., Zevenbergen, C., Rijke, J. and Kingsborough, A. (2018). Lessons learned from applying adaptation pathways in flood risk management and challenges for the further development of this approach. Mitigation and Adaptation Strategies for Global Change, 23, 1083–1108. Retrieved August 2020, from <https://doi.org/10.1007/s11027-017-9773-9>

Boardman, A.E., Moore, M.A. and Vining, A.R. (2008). Social Discount Rates for Canada. University of British Columbia and Simon Fraser University, Vancouver, 28 p. Retrieved December 2020, from <https://www.researchgate.net/publication/236935295_The_Social_Discount_Rate_in_Canada>

Bosello, F., Roson, R. and Tol, R. (2006). Economy-wide estimates of the implications of climate change: human health. Ecological Economics, 58, 579–591. Retrieved December 2020, from <https://doi.org/10.1016/j.ecolecon.2005.07.032>

Bouwer, L.M. (2011). Have disaster losses increased due to anthropogenic climate change? Bulletin of the American Meteorological Society, 92, 39–46. Retrieved December 2020, from <https://doi.org/10.1175/2010BAMS3092.1>

Boyd, R. (2018). Economic impacts of climate change on municipalities: Edmonton case study. Federation of Canadian Municipalities (FCM) Climate and Asset Management Network (CAMN) Webinar, 26th November 2018.

Boyd, R., Gados, A. and Maynes, T. (2013). Economic guidance for the appraisal and prioritization of adaptation actions. Report prepared for the Climate Change Impacts and Adaptation Program of Natural Resources Canada, Climate Change Central, Calgary, Alberta, 242 p.

Boyd, R. and Walton, H. (2006). Water resources, Chapter 9 in Climate change impacts and adaptation: cross-regional research programme project. Report by Metroeconomica Limited (UK) for Department for Environment, Food and Rural Affairs (DEFRA), London, United Kingdom. Retrieved August 2020, from <http://sciencesearch.defra.gov.uk/Default.aspx?Menu=Menu&Module=More&Location=None&Completed=0&ProjectID=13231>

Boyd, R., Zukiwsky, J. and Pringle, T. (2015). Economic tools for climate adaptation: private real estate decisions. Report prepared for the Climate Change Impacts and Adaptation Program of Natural Resources Canada, All One Sky Foundation, Calgary, Alberta, 139 p. Retrieved December 2020, from <https://www.retooling.ca/_Library/ReTooling_Resource_Library/Economic_Tools_for_Climate_Change_Adaptation.pdf>

Boyer-Villemaire, U., Circé, M., Da Silva, L., Desjarlais, C. and Morneau, F. (2016). Atlantic-Quebec cost-benefit analysis of adaptation options in coastal areas: synthesis report. Ouranos, Montréal, 33 p. Retrieved December 2020, from <https://www.ouranos.ca/publication-scientifique/Synthesis-Report-Atl-Qc.pdf>

Braeuninger, M., Butzengeiger-Geyer, S., Dlugolecki, A., Hochrainer-Stigler, S., Koehler, M., Linnerooth-Bayer, J., Mechler, R. and Michaelowa, A. (2011). Application of economic instruments for adaptation to climate change. Final Report, Brussels, Belgium. Retrieved December 2020, from <https://www.researchgate.net/profile/Michael_Braeuninger/publication/248399515_Application_of_economic_instruments_for_adaptation_to_climate_change_Final_report/links/53e0041b0cf2a768e49ea3dc/Application-of-economic-instruments-for-adaptation-to-climate-change-Final-report.pdf>

Brown, C., Werick, W., Leger, W. and Fay, D. (2011). A decision-analytic approach to managing climate risks: application to the Upper Great Lakes. Journal of the American Water Resources Association, 47, 524–534. Retrieved December 2020, from <https://doi.org/10.1111/j.1752-1688.2011.00552.x>

Burton, I. (2009). Climate change and the adaptation deficit, in The Earthscan Reader on Adaptation to Climate Change, (Eds.) L. Shipper and I. Burton. Earthscan, London, United Kingdom, 480 p.

Bush, E. and Lemmen, D. (Eds.), 2019: Canada’s Changing Climate Report, Government of Canada, Ottawa, Ontario, 444 p. Retrieved December 2020, from < https://changingclimate.ca/CCCR2019/>

Butsic, V., Hanak, E. and Valletta, R. (2011). Climate change and housing prices: hedonic estimates for ski resorts in Western North America. Land Economics, 87(1), 75–91. Retrieved December 2020, from <https://doi.org/10.3368/le.87.1.75>

Chambwera, M., Heal, G., Dubeux, C., Hallegatte, S., Leclerc, L., Markandya, A., McCarl, B.A., Mechler, R. and Neumann, J.E. (2014). Economics of adaptation, Chapter 17 in Climate Change 2014: Impacts, Adaptation, and Vulnerability. Part A: Global and Sectoral Aspects (Contribution of Working Group II to the Fifth Assessment Report of the Intergovernmental Panel on Climate Change), (Eds.) C.B. Field, V.R. Barros, D.J. Dokken, K.J. Mach, M.D. Mastrandrea, T.E. Bilir, M. Chatterjee, K.L. Ebi, Y.O. Estrada, R.C. Genova, B. Girma, E.S. Kissel, A.N. Levy, S. MacCracken, P.R. Mastrandrea, and L.L. White. Cambridge University Press, Cambridge, United Kingdom and New York, New York, USA, 945–977. Retrieved December 2020, from <https://www.ipcc.ch/site/assets/uploads/2018/02/WGIIAR5-Chap17_FINAL.pdf>

Chavaillaz, Y., Roy, P., Partanen, A.-I., Da Silva, L., Bresson, É., Mengis, N., Chaumont, D. and Matthews, H.D. (2019). Exposure to excessive heat and impacts on labour productivity linked to cumulative CO2 emissions. Scientific Reports: Nature, 9, 13711. Retrieved December 2020, from <https://doi.org/10.1038/s41598-019-50047-w>

Cimato, F. and Mullan, M. (2010). Adapting to climate change: analysing the role of government. Department for Environment, Food and Rural Affairs (DEFRA), London, United Kingdom, 79 p. Retrieved August 2020, from <https://assets.publishing.service.gov.uk/government/uploads/system/uploads/attachment_data/file/69194/pb13341-analysing-role-government-100122.pdf>

Circé, M., Da Silva, L., Boyer-Villemaire, U., Duff, G., Desjarlais, C. and Morneau, F. (2016a). Cost-benefit analysis for adaptation options in Quebec’s coastal areas – Synthesis Report. Ouranos, Montréal, 89 p. Retrieved August 2020, from <https://www.ouranos.ca/publication-scientifique/Synthesis-Report-Qc.pdf>

Circé, M., Boyer-Villemaire, U., Da Silva, L. and Jardine, D. (2016b). Atlantic-Quebec cost-benefit analysis of coastal adaptation options – integrated results. Ouranos, Montréal, 24 p.

Ciscar, J.-C., Iglesias, A., Feyen, L., Szabó, L., Van Regemorter, D., Amelung, B., Nicholls, R., Watkiss, P., Christensen, O.B., Dankers, R., Garrote, L., Goodess, C.M., Hunt, A., Moreno, A., Richards, J. and Soria, A. (2011). Physical and economic consequences of climate change in Europe. Proceedings of the National Academy of Sciences of the United States of America (PNAS). Retrieved August 2020, from <https://doi.org/10.1073/pnas.1011612108>

Cline, W.R. (2007). Global warming and agriculture: impact estimates by country. Peterson Institute of International Economics, Washington, D.C., 250 p.

Corbett, L.J., Withey, P., Lantz, V.A. and Ochuodho, T.O. (2015). The economic impact of the mountain pine beetle infestation in British Columbia: provincial estimates from a CGE analysis. Forestry, 0, 1–6. Retrieved August 2020, from <https://doi.org/10.1093/forestry/cpv042>

Coronesea, M., Lampertia, F., Kellerc, K., Chiaromontea, F. and Roventinia, A. (2019). Evidence for sharp increase in the economic damages of extreme natural disasters. Proceedings of the National Academy of Sciences of the United States of America (PNAS), 166(43), 21450–21455. Retrieved August 2020, from <https://doi.org/10.1073/pnas.1907826116>

Cropper, M.L., Freeman, M.C., Groom, B. and Pizer, W.A. (2014). Declining discount rates. American Economic Review: Papers and Proceedings, 104(5), 538-543. Retrieved August 2020, from <https://doi.org/10.1257/aer.104.5.538>

Daigle, R. (2012). Sea-level rise and flooding estimates for New Brunswick coastal sections. Report commissioned by the Atlantic Climate Solutions Association, managed by Climate Change Secretariat, New Brunswick Department of Environment, Fredericton, New Brunswick, 45 p. Retrieved August 2020, from <https://atlanticadaptation.ca/fr/islandora/object/acasa%253A569>

Damon, M., Mohlin, K. and Sterner, T. (2013). Putting a price on the future of our children and grand-children, in The globalization of cost–benefit analysis in environmental policymaking, (Eds.) M.A. Livermore and R.L. Revesz. Oxford University Press, New York, 352 p. Retrieved August 2020, from <https://doi.org/10.1093/acprof:oso/9780199934386.001.0001>

DaSilva, L., Desrochers, F.-A., Pineault, K., Gosselin, C.-A., Grenier, P. and Larose, G. (2019). Analyse économique des mesures d’adaptation aux changements climatiques appliquée au secteur du ski alpin au Québec. Ouranos, Montréal, 119 p. Retrieved August 2020, from <https://www.ouranos.ca/publication-scientifique/RapportDaSilva2019.pdf>

de Bruin, K. and Dellink, R. (2011). How harmful are restrictions in adapting to climate change? Global Environmental Change, 21(1), 34–45. Retrieved August 2020, from <https://doi.org/10.1016/j.gloenvcha.2010.09.008>

de Bruin, K. (2011). Distinguishing between proactive (stock) and reactive (flow) adaptation. Centre for Envrionmental and Resource Economics (CERE) Working Papers 2011:8, Umea University, Umea, Sweden, 45 p. Retrieved March 2021, from < http://doi.org/10.2139/ssrn.1854285>

de Bruin, K., Dellink, R. and Agrawala, S. (2009a). Economic aspects of adaptation to climate change: Integrated Assessment Modelling of adaptation costs and benefits. OECD Environment Working Papers No. 6, Organization for Economic Cooperation and Development (OECD), Paris, France, 48 p. Retrieved August 2020, from <https://doi.org/10.1787/225282538105>

de Bruin, K., Dellink, R.B., Ruijs, A., Bolwidt, L., van Buuren, A., Graveland, J., de Groot, R.S., Kuikman, P.J., Reinhard, S., Roetter, R.P., Tassone, A., Verhagen, A. and van Ierland, E.C. (2009b) Adapting to climate change in The Netherlands: an inventory of climate adaptation options and ranking of alternatives. Climatic Change, 95, 23–45. Retrieved August 2020, from <https://doi.org/10.1007/s10584-009-9576-4>

Dell, M., Jones, B.F. and Olken, B.A. (2012). Temperature shocks and economic growth – evidence from the last half century. American Economic Journal: Macroeconomics, 4, 66–95. Retrieved August 2020, from <https://doi.org/10.1257/mac.4.3.66>

Dell, M., Jones, B.F. and Olken, B.A. (2014). What do we learn from the weather? The new climate-economy literature. Journal of Economic Literature, 52, 740–798. Retrieved August 2020, from <https://doi.org/10.1257/jel.52.3.740>

Dennig, F. (2018). Climatic change and the re-evaluation of cost-benefit analysis. Climate Change, 151, 43–54. Retrieved August 2020, from <https://doi.org/10.1007/s10584-017-2047-4>

Dessai, S. and Hulme, M. (2007). Assessing the robustness of adaptation decisions to climate change uncertainties: a case study on water resources management in the East of England. Global Environmental Change, 17(1), 59–72. Retrieved August 2020, from <https://doi.org/10.1016/j.gloenvcha.2006.11.005>

Dessai, S., Hulme, M., Lempert, R.J. and Pielke Jr, R. (2009). Climate prediction: a limit to adaptation? in Adapting to climate change: thresholds, values, governance, (Eds.) W.N. Adger, I. Lorenzoni and K.L. O’Brien. Cambridge University Press, Cambridge, United Kingdom, 49–57.

Dessai, S., Lu, X. and Risbey, J.S. (2005). On the role of climate scenarios for adaptation planning. Global Environmental Change, 15, 87–97. Retrieved August 2020, from <https://doi.org/10.1016/j.gloenvcha.2004.12.004>

Diaz, D. and Moore, F. (2017). Valuing Potential Climate Impacts: A Review of Current Limitations and the Research Frontier. Technical update, product ID 3002011885. Electric Power Research institute (EPRI), Palo Alto, California, 36 p. Retrieved August 2020, from <https://www.epri.com/research/products/3002011885>

Dittrich, R., Wreford, A. and Moran, D. (2016). A survey of decision-making approaches for climate change adaptation: are robust methods the way forward? Ecological Economics, 122, 79–89. Retrieved August 2020, from <https://doi.org/10.1016/j.ecolecon.2015.12.006>

Dorling, R. and Hanniman, K. (2016). Restoring water levels on Lake Michigan-Huron: A cost benefit analysis. Mowat Centre, Munk School of Global Affairs and Public Policy, University of Toronto, Toronto, 74 p. Retrieved August 2020, from <https://munkschool.utoronto.ca/mowatcentre/wp-content/uploads/publications/120_restoring_water_levels_on_lake_michigan-huron.pdf>

Dow, K., Berkhout, F., Preston, B.L., Klein, R.J.T., Midgley G. and Shaw, M.R. (2013). Limits to adaptation. Nature Climate Change, 3, 305–307. Retrieved August 2020, from <https://doi.org/10.1038/nclimate1847>

Downing, T.E. (2012). Views of the frontiers in climate change adaptation economics. WIREs Climate Change, 3(2), 161–170. Retrieved August 2020, from <https://doi.org/10.1002/wcc.157>

Drupp, M., Freeman, M., Groom, B. and Nesje, F. (2015). Discounting disentangled: an expert survey on the determinants of the long-term social discount rate. Working Paper 172. Grantham Research Institute on Climate Change and the Environment, London School of Economics and Political Science, London, United Kingdom, 42 p. Retrieved August 2020, from <http://www.lse.ac.uk/GranthamInstitute/wp-content/uploads/2015/06/Working-Paper-172-Drupp-et-al.pdf>

Dunne, J.P., Stouffer, R.J. and John, J.G. (2013). Reductions in labour capacity from heat stress under climate warming. Nature Climate Change, 3, 563–566. Retrieved August 2020, from <https://doi.org/10.1038/nclimate1827>

Ebi, K., Ogden, N., Semenza, J. and Woodward, A. (2017). Detecting and attributing health burdens to climate change. Environmental Health Perspectives, 125(8), 085004. Retrieved August 2020, from <https://doi.org/10.1289/EHP1509>

Economics of Climate Adaptation (2009). Shaping climate resilient development: a framework for decision-making. A report of the Economics of Climate Adaptation (ECA) Working Group. Swiss Re, McKinsey, Global Environment Facility, European Commission, the Rockefeller Foundation, Climate Works, and Standard Chartered Bank, Zurich, Switzerland, 159 p. Retrieved August 2020, from <http://ccsl.iccip.net/climate_resilient.pdf>

Employment and Social Development Canada (2018). Thermal stress in the workplace: guideline 2018. Employment and Social Development Canada, Ottawa, 30 p. Retrieved August 2020, from <https://www.canada.ca/en/employment-social-development/services/health-safety/reports/thermal-stress-work-place.html>

European Environment Agency (2007). Climate change: the cost of inaction and the cost of adaptation. EEA Technical Report No 13/2007, European Environment Agency (EEA), Copenhagen, Denmark, 67 p. Retrieved August 2020, from <https://www.eea.europa.eu/publications/technical_report_2007_13/at_download/file>

Eisenack, K., Moser, S.C., Hoffman, E., Klein, R.J.T., Oberlack, C., Pechan, A., Rotter, M. and Termeer, C.J.A.M. (2014). Explaining and overcoming barriers to climate change adaptation. Nature Climate Change, 4, 867–872. Retrieved August 2020, from <https://doi.org/10.1038/nclimate2350>

Ekstrom, J., Moser, S. and Torn, M. (2011). Barriers to climate change adaptation: a diagnostic framework. Report prepared for California Energy Commission. Lawrence Berkeley National Laboratory, Berkeley, California. Retrieved August 2020, from <http://www.susannemoser.com/documents/Ekstrom-Moser-Torn_2011_BarriersFrameworkReport_CEC-500-2011-004.pdf>

Epper, T., Fehr-Duda, H. and Bruhin, A. (2011). Viewing the future through a warped lens: Why uncertainty generates hyperbolic discounting? Journal of Risk and Uncertainty, 43, 169–203. Retrieved August 2020, from <https://doi.org/10.1007/s11166-011-9129-x>

Fankhauser, S. (2017). Adaptation to climate change. Annual Review of Resource Economics, 9(1), 209–230. Retrieved August 2020, from <https://doi.org/10.1146/annurev-resource-100516-033554>

Felgenhauer, T. and Webster, M. (2014). Modeling adaptation as a flow and stock decision with mitigation. Climatic Change, 122, 665–679. Retrieved August 2020, from <https://doi.org/10.1007/s10584-013-1016-9>

Filatova, T. (2013). Market-based instruments for flood risk management: a review of theory, practice and perspectives for climate adaptation policy. Environmental Science and Policy, 37, 227–242. Retrieved August 2020, from <https://doi.org/10.1016/j.envsci.2013.09.005>

Filatova, T., Mulder, J. and van der Veen, A. (2011). Coastal risk management: how to motivate individual economic decisions to lower flood risk? Ocean and Coastal Management, 54, 164–172. Retrieved August 2020, from <https://doi.org/10.1016/j.ocecoaman.2010.10.028>

Floater, G., Heeckt, C., Ulterino, M., Mackie, L., Rode, P., Bhardwaj, A., Carvalho, M., Gill, D., Bailey, T. and Huxley, R. (2016). Co-benefits of urban climate action: a framework for cities. A working paper by the Economics of Green Cities Programme, LSE Cities, London School of Economics and Political Science, London, United Kingdom, 86 p. Retrieved August 2020, from <http://eprints.lse.ac.uk/68876/1/Cobenefits_Of_Urban_Climate_Action.pdf>

Fleurbaey, M. and Rafeh, R. (2016). The use of distributional weights in benefit-cost analysis: insights from welfare economics. Review of Environmental Economics and Policy, 10(2), 286–307. Retrieved August 2020, from <https://doi.org/10.1093/reep/rew003>

Food and Agriculture Organization (2007). Adaptation to climate change in agriculture, forestry and fisheries: perspective, framework and priorities. Food and Agriculture Organization (FAO) of the United Nations, Rome, Italy, 24 p. Retrieved August 2020, from <https://www.preventionweb.net/files/8342_j9271e1.pdf>

Fussel, H.-M. (2003). Impacts of climate change on human health — opportunities and challenges for adaptation planning. EVA Working Paper No. 4. Potsdam Institute for Climate Impact Research, Potsdam, Germany.

Gall, M., Borden, K., Emrich, C. and Cutter, S. (2011). The unsustainable trend of natural hazard losses in the United States. Sustainability, 3, 2157–2181. Retrieved August 2020, from <https://doi.org/10.3390/su3112157>

Georgeson, L., Maslin, M., Poessinouw, M. and Howard, S. (2016). Adaptation responses to climate change differ between global megacities. University College London, London, United Kingdom, 15 p. Retrieved August 2020, from <https://doi.org/10.1038/nclimate2944>

Girard, N. (2018). Personal communication with Nicholas Girard, Environmental Policy Analyst, First Nation Adapt Program, Climate Change and Clean Energy Directorate, Natural Resources and Environment Branch, Crown-Indigenous Relations and Northern Affairs Canada, Ottawa, Ontario.

Global Commission in Adaptation (2019). Adapt now: a global call for leadership on climate resilience. Global Commission on Adaptation, 81 p. Retrieved August 2020, from <https://cdn.gca.org/assets/2019-09/GlobalCommission_Report_FINAL.pdf>

Gowdy, J. (2013). Valuing nature for climate change policy: from discounting the future to truly social deliberation, in Handbook on energy and climate change, (Ed.) R. Fouquet. Edward Elgar, Cheltenham, 752 p.

Gregory, R., Failing, L., Harstone, M., Long, G., McDaniels, T. and Ohlson, D. (2012). Structured decision making: a practical guide to environmental management choices. Wiley-Blackwell, Chichester, 315 p.

Groom, B. and Maddison, D. (2018). New estimates of the elasticity of marginal utility for the UK. Environmental and Resource Economics, 72, 1–28. Retrieved August 2020, from <https://doi.org/10.1007/s10640-018-0242-z>

Grothmann, T. and Patt, A. (2005). Adaptive capacity and human cognition: the process of individual adaptation to climate change. Global Environmental Change, 15(3), 199–213. Retrieved August 2020, from <https://doi.org/10.1016/j.gloenvcha.2005.01.002>

Haasnoot, M., Warren, A. and Kwakkel, J.H. (2018). Dynamic adaptive policy pathways (DAPP), in Decision making under deep uncertainty: from theory to practice, (Eds.) V. Marchau, et al. Springer Open Access, Cham, Switzerland, 71-91. Retrieved August 2020, from <https://www.springerprofessional.de/content/pdfId/16610888/10.1007/978-3-030-05252-2_4?canonical=https%3A%2F%2Fwww.springerprofessional.de%2Fen%2Fdynamic-adaptive-policy-pathways-dapp%2F16610888%3FfulltextView%3Dtrue>

Haasnoot, M., Kwakkel, J.H., Walker, W.E. and ter Maat, J. (2013). Dynamic adaptive policy pathways: A method for crafting robust decisions for a deeply uncertain world. Global Environmental Change, 23(2), 485–498. Retrieved August 2020, from <https://doi.org/10.1016/j.gloenvcha.2012.12.006>

Haigh, N. and Fisher, J. (2010). Using a “Real Options” approach to determine a future strategic plan for flood risk management in the Thames Estuary. Government Economic Service Working Paper. Her Majesty’s Treasury, London, United Kingdom.

Hallegatte, S. (2013). The indirect cost of natural disasters and an economic definition of macroeconomic resilience. Impact Appraisal for Sovereign Disaster Risk Financing and Insurance Project: Phase 1 Public Finance and Macroeconomics, Paper 3. Sustainable Development Network, Office of the Chief Economist, The World Bank, Washington, D.C., 35 p. Retrieved December 2020, from <https://openknowledge.worldbank.org/bitstream/handle/10986/22238/The0indirect0c0oeconomic0resilience.pdf?sequence=1&isAllowed=y>

Hallegatte, S. (2014). Trends in hazards and the role of climate change, in Natural disasters and climate change. Springer, Cham, Switzerland, 77–97.

Hallegatte, S., Shah, A., Lempert, R., Brown, C. and Gill, S. (2012). Investment Decision Making Under Deep Uncertainty: Application to Climate Change. Policy Research Working Papers 6193. World Bank, Washington, D.C., 41 p. Retrieved August 2020, from <https://doi.org/10.1596/1813-9450-6193>

Halsnæs, K., Shukla, P., Ahuja,D., Akumu, G., Beale, R., Edmonds, J., Gollier, C., Grübler, A., Ha Duong, M., Markandya, A., McFarland, M., Nikitina, E., Sugiyama, T., Villavicencio A. and Zou, J. (2007). Framing issues, in Climate Change 2007: Mitigation (Contribution of Working Group III to the Fourth Assessment Report of the Intergovernmental Panel on Climate Change), (Eds.) B. Metz, O.R. Davidson, P.R. Bosch, R. Dave and L. A. Meyer. Cambridge University Press, Cambridge, United Kingdom and New York, New York, 118–167. Retrieved August 2020, from <https://www.ipcc.ch/site/assets/uploads/2018/02/ar4-wg3-chapter2-1.pdf>

Hamilton, J., Maddison, D. and Tol, R. (2005). Climate change and international tourism: a simulation study. Global Environmental Change, 15(3), 253–266. Retrieved August 2020, from <https://doi.org/10.1016/j.gloenvcha.2004.12.009>

Heal, G. and Millner, A. (2013). Uncertainty and decision in climate change economics. Grantham Research Institute on Climate Change and the Environment, Working Paper No. 108, London School of Economics, London, United Kingdom, 24 p. Retrieved August 2020, from <https://doi.org/10.1093/reep/ret023>

Heal, G. and Park, J. (2016). Temperature stress and the direct impact of climate change: a review of an emerging literature. Review of Environmental Economics and Policy, 10(2), 1–17. Retrieved August 2020, from <https://doi.org/10.1093/reep/rew007>

Her Majesty’s Government (2013). The national adaptation programme: making the country resilient to a changing climate. Her Majesty’s Government, The Stationery Office, London, United Kingdom, 182 p. Retrieved August 2020, from <https://assets.publishing.service.gov.uk/government/uploads/system/uploads/attachment_data/file/727259/pb13942-nap-20130701.pdf>

Hope, C. (2011). The PAGE09 integrated assessment model: A technical description. Working paper series 4/2011, Judge Business School, University of Cambridge, Cambridge, United Kingdom, 40 p. Retrieved August 2020, from <https://www.jbs.cam.ac.uk/fileadmin/user_upload/research/workingpapers/wp1104.pdf>

Hope, E., McKenney, D., Pedlar, J., Stocks, B. and Gauthier, S. (2015). Wildfire suppression costs for Canada under a changing climate. PLoS ONE, 11(8), e0157425. Retrieved August 2020, from <https://doi.org/10.1371/journal.pone.0157425>

Hotte, N. and Nelson, H. (2015). Economic instruments for adaptation to climate change in forestry. Report prepared for the Climate Change Impacts and Adaptation Program of Natural Resources Canada, University of British Columbia, Vancouver, British Columbia. Retrieved August 2020, from <http://harry-w-nelson-forestry.sites.olt.ubc.ca/files/2015/06/Final-Report-Economic-Instruments-for-Adaptation-to-Climate-Change-June-2-2015.pdf>

Howard, P. and Sylvan, D. (2015). Expert Consensus on the Economics of Climate Change. Institute of Policy Integrity, New York University School of Law, New York, New York, 31 p. Retrieved August 2020, from <https://www.edf.org/sites/default/files/expertconsensusreport.pdf>

Hunt, A. (2009). Economic aspects of climate change impacts and adaptation in the UK. PhD Thesis, University of Bath, Bath, United Kingdom.

IBI Group (2015a). Benefit-cost analysis of flood mitigation projects for the City of Calgary: Glenmore Reservoir diversion. Report prepared for the Government of Alberta by IBI Group, Calgary, Alberta, 9+ p. Retrieved August 2020, from <https://open.alberta.ca/publications/benefit-cost-analysis-of-flood-mitigation-projects-for-the-city-of-calgary-glenmore-reservoir>

IBI Group (2015b). Benefit-cost analysis of flood mitigation projects for the City of Calgary: Springbank off-stream flood storage. Report prepared for the Government of Alberta by IBI Group, Calgary, Alberta, 10+ p. Retrieved August 2020, from <https://open.alberta.ca/dataset/ca7f0d55-e9bc-4efa-8657-9f6014c85f45/resource/e80f53f7-7fd6-45f4-abd7-4ad85d7fd07e/download/springbank-benefit-cost.pdf>

IBI Group (2015c). Benefit-cost analysis of flood mitigation projects for the City of Calgary: McLean Creek flood storage. Report prepared for the Government of Alberta by IBI Group, Calgary, Alberta, 10+ p. Retrieved August 2020, from <https://open.alberta.ca/dataset/33e478fc-1c01-428c-90c7-365e898d969d/resource/58cde7b5-3795-4c25-ba9b-978ef4047ed7/download/mclean-creek-benefit-cost.pdf>

ILO [International Labour Organization] (2019). Working on a warmer planet: the impact of heat stress on labour productivity and decent work. International Labour Organization, Geneva, Switzerland, 103 pp. Retrieved December 2020, from <https://www.ilo.org/wcmsp5/groups/public/—dgreports/—dcomm/—publ/documents/publication/wcms_711919.pdf>

Insurance Bureau of Canada and Federation of Canadian Municipalities (2020). Investing in Canada’s future: the cost of climate adaptation at the local level. Toronto and Ottawa, Ontario, 59 p. Retrieved August 2020, from <https://data.fcm.ca/documents/reports/investing-in-canadas-future-the-cost-of-climate-adaptation.pdf>

Insurance Bureau of Canada (2015). The economic impacts of the weather effects of climate change on communities. Insurance Bureau of Canada, Toronto, Ontario, 201 p. Retrieved August 2020, from <http://assets.ibc.ca/Documents/Studies/IBC-The-Economic-Impacts.pdf>

Insurance Bureau of Canada (2018). 2018 facts of the property and casualty insurance industry in Canada. Insurance Bureau of Canada (IBC), Toronto, Ontario, 69 p. Retrieved August 2020, from <http://assets.ibc.ca/Documents/Facts%20Book/Facts_Book/2018/IBC-Fact-Book-2018.pdf>

Insurance Bureau of Canada (2019). Facts of the Property and Casualty Insurance Industry in Canada, 41st edition. Retrieved June 2020, from <http://assets.ibc.ca/Documents/Facts%20Book/Facts_Book/2019/IBC-2019-Facts.pdf>

IPCC [Intergovernmental Panel on Climate Change] (2001). Climate Change 2001: Impacts, Adaptation, and Vulnerability. Cambridge University Press, Cambridge, United Kingdom and New York, New York, USA, 1032 p. Retrieved August 2020, from <https://www.ipcc.ch/site/assets/uploads/2018/03/WGII_TAR_full_report-2.pdf>

IPCC [Intergovernmental Panel on Climate Change] (2012). Managing the risks of extreme events and disasters to advance climate change adaptation. A Special Report of Working Groups I and II of the Intergovernmental Panel on Climate Change. Cambridge University Press, Cambridge, United Kingdom, and New York, New York, USA, 582 p. Retrieved August 2020, from <https://www.ipcc.ch/site/assets/uploads/2018/03/SREX_Full_Report-1.pdf>

IPCC [Intergovernmental Panel on Climate Change] (2013). Summary for policymakers, in Climate Change 2013: The Physical Science Basis (Contribution of Working Group I to the Fifth Assessment Report of the Intergovernmental Panel on Climate Change), (Eds.) T. Stocker, T., D. Qin, G.-K. Plattner, M. Tignor, S.K. Allen, J. Boschung, A. Nauels, Y. Xia, V. Bex and P.M. Midgley. Cambridge University Press, Cambridge, United Kingdom and New York, New York, USA, 3–29. Retrieved August 2020, from <https://www.ipcc.ch/site/assets/uploads/2018/02/WG1AR5_SPM_FINAL.pdf>

Jenkins, G. and Kuo, C.-Y. (2007). The economic opportunity cost of capital for Canada—an empirical update. Queen’s Economics Department Working Paper Number 1133. Department of Economics, Queen’s University, Kingston, Canada, 25 p. Retrieved August 2020, from <https://www.econ.queensu.ca/sites/econ.queensu.ca/files/qed_wp_1133.pdf>

Jeuland, M. and Whittington, D. (2013). Water resources planning under climate change: assessing the robustness of real options for the Blue Nile. Water Resources Research, 50. Retrieved August 2020, from <https://doi.org/10.1002/2013WR013705>

Johansson-Stenman, O. (2005). Distributional weights in cost-benefit analysis—should we forget about them? Land Economics, 81(3), 337–352. Retrieved August 2020, from <https://www.jstor.org/stable/4129689>

Jones, C.I. and Klenow, P.J. (2016). Beyond GDP? Welfare across countries and time. American Economic Review, 106, 2426–2457. Retrieved August 2020, from <https://doi.org/10.1257/aer.20110236>

Jones, R.N., Patwardhan, A., Cohen, S.J., Dessai, S., Lammel, A., Lempert, R.J., Mirza, M.M.Q. and von Storch, H. (2014). Foundations for decision making, in Climate Change 2014: Impacts, Adaptation, and Vulnerability. Part A: Global and Sectoral Aspects (Contribution of Working Group II to the Fifth Assessment Report of the Intergovernmental Panel on Climate Change), (Eds.) C.B. Field. Cambridge University Press, Cambridge, United Kingdom and New York, New York, USA, 195–228. Retrieved December 2020, from <https://www.ipcc.ch/site/assets/uploads/2018/02/WGIIAR5-Chap2_FINAL.pdf>

Kahn, M.E. (2016). The Climate Change Adaptation Literature. Review of Environmental Economics and Policy, 10(1), 166–178. Retrieved August 2020, from <https://doi.org/10.1093/reep/rev023>

Kahn, M.E., Mohaddes, K., Ng, R.N.C., Hashem Pesaran, M., Raissi, M. and Yang, J.-C. (2019). Long-term macroeconomic effects of climate change: a cross-country analysis. IMF working Paper (WP/19/215), International Monetary Fund (IMF), Washington, D.C., 58 p. Retrieved August 2020, from <https://www.imf.org/-/media/Files/Publications/WP/2019/wpiea2019215-print-pdf.ashx>

Kim, B. and Zauberman, G. (2009). Perception of anticipatory time in temporal discounting. Journal of Neuroscience, Psychology, and Economics, 2, 91–101. Retrieved August 2020, from <https://doi.org/10.1037/a0017686>

Kjellstrom, T., Holmer, I. and Lemke, B. (2009). Workplace heat stress, health and productivity – an increasing challenge for low and middle-income countries during climate change. Global Health Action, 2. Retrieved August 2020, from <https://doi.org/10.3402/gha.v2i0.2047>

Kjellstrom, T., Lemke, B. and Otto, M. (2013). Mapping occupational heat exposure and effects in South-East Asia: Ongoing time trends 1980–2011 and future estimates to 2050. Industrial Health, 51(1), 56–67. Retrieved August 2020, from <https://doi.org/10.2486/indhealth.2012-0174>

Kjellstrom, T., Lemke, B., Matthias Otto, P., Hyatt, O.M., Briggs, D.J. and Freyberg, C.A. (2015). Heat impacts on work, human performance and daily life, in Climate Change and Public Health, (Eds.) B. Levy and J. Patz. Oxford University Press, New York, 73–86. Retrieved August 2020, from <https://doi.org/10.1093/med/9780190202453.003.0004>

Klein, R.J.T., Midgley, G.F., Preston, B.L., Alam, M., Berkhout, F.G.H., Dow, K. and Shaw, M.R. (2014). Adaptation opportunities, constraints and limits, in Climate Change 2014: Impacts, Adaptation, and Vulnerability. Part A: Global and Sectoral Aspects (Contribution of Working Group II to the Fifth Assessment Report of the Intergovernmental Panel on Climate Change), (Eds.) C.B. Field, V.R. Barros, D.J. Dokken, K.J. Mach, M.D. Mastrandrea, T.E. Bilir, M. Chatterjee, K.L. Ebi, Y.O. Estrada, R.C. Genova, B. Girma, E.S. Kissel, A.N. Levy, S. MacCracken, P.R. Mastrandrea, and L.L.White. Cambridge University Press, Cambridge, United Kingdom and New York, New York, USA, 899–943. Retrieved August 2020, from <https://www.ipcc.ch/site/assets/uploads/2018/02/WGIIAR5-Chap16_FINAL.pdf>

Kompass, T., Pham, V. and Che, T. (2018). The effects of climate change on GDP by country and global economic gains from complying with the Paris Accord. Earth’s Future, 6, 1153–1173. Retrieved August 2020, from <https://doi.org/10.1029/2018EF000922>

Kousky, C. (2012). Informing climate adaptation: a review of the economic costs of natural disasters, their determinants, and risk reduction options. RFF DP 12-28. Resources for the Future, Washington, D.C., 62 p. Retrieved August 2020, from <http://dx.doi.org/10.2139/ssrn.2099769>

Kousky, C. (2014). Managing shoreline retreat: a US perspective. Climatic Change, 124, 9–20. Retrieved August 2020, from <https://doi.org/10.1007/s10584-014-1106-3>

Kovats, S., Lloyd, S., Hunt, A. and Watkiss, P. (2011). Technical Policy Briefing Note 5: The Impacts and Economic Costs on Health in Europe and the Costs and Benefits of Adaptation. Results of the EC RTD ClimateCost Project, in The ClimateCost Project, Final Report, Volume 1: Europe, (Ed.) P. Watkiss. Stockholm Environment Institute, Stockholm, Sweden. Retrieved August 2020, from <https://www.sei.org/mediamanager/documents/Publications/sei-climatecost-health.pdf>

Lafakis, C., Ratz, L., Fazio, E. and Cosma, M. (2019). The economic implications of climate change. Moody’s Analytics, London, United Kingdom. Retrieved August 2020, from <https://ma.moodys.com/rs/961-KCJ-308/images/2019-08-08-Climate-Change.pdf>

Lantz, V., Trenholm, R., Wilson, J. and Richards, W. (2012). Assessing market and non-market costs of freshwater flooding due to climate change in the community of Fredericton, Eastern Canada. Climatic Change, 110(1–2), 347–372. Retrieved August 2020, from <https://doi.org/10.1007/s10584-011-0063-3>

Larrivée, C., Desjarlais, C., Roy, R. and Audet, N. (2016). Regional economic study on the potential impacts of climate-change-induced low water levels on the Saint-Laurent River and adaptation options: Synthesis of the findings from six sector-specific studies. Report submitted to Natural Resources Canada’s Climate Change Impacts and Adaptation Division and the Government of Quebec, Ouranos, Montréal. Retrieved August 2020, from <https://www.ouranos.ca/publication-scientifique/ACA-GLSL_synthesis_english_final.pdf>

Larrivée, C., Sinclair-Désgagné, N., Da Silva, L., Revéret, J.P. and Desjarlais, C. (2015). Évaluation des impacts des changements climatiques et de leurs coûts pour le Québec et l’État québécois. Report by Ouranos, Montréal. Retrieved August 2020, from <https://www.ouranos.ca/publication-scientifique/2016/03/RapportLarrivee2015_FR-1.pdf>

Lecocq, F. and Shalizi, Z. (2007). Balancing expenditures on mitigation of adaptation to climate change: an exploration of issues relevant to developing countries. Policy Research Working Paper Series 4299. The World Bank, Washington, D.C. Retrieved August 2020, from <https://openknowledge.worldbank.org/bitstream/handle/10986/7487/wps4299.pdf?sequence=1&isAllowed=y>

Lempert, R.J. (2014). Embedding (some) benefit-cost concepts into decision support processes with deep uncertainty. Journal of Benefit-Cost Analysis, 5(3), 487–514. Retrieved August 2020, from <https://doi.org/10.1515/jbca-2014-9006>

Lempert, R.J., Kalra, N., Peyraud, S., Mao, Z. and Tan, S.B. (2013). Ensuring robust flood risk management in Ho Chi Minh City. Policy Research Working Paper 6465. The World Bank, Washington, D.C., 63 p. Retrieved August 2020, from <https://www.researchgate.net/profile/Dean_Cira/publication/255698092_Ensuring_Robust_Flood_Risk_Management_in_Ho_Chi_Minh_City/links/54e3223e0cf2d90c1d9bff24/Ensuring-Robust-Flood-Risk-Management-in-Ho-Chi-Minh-City.pdf>

Lempert, R., Arnold, J., Pulwarty, R., Gordon, K., Greig, K., Hawkins Hoffman, C., Sands, D. and Werrell, C. (2018). Reducing Risks Through Adaptation Actions, in Impacts, Risks, and Adaptation in the United States: Fourth National Climate Assessment, Volume II, (Eds.) D.R. Reidmiller, C.W. Avery, D.R. Easterling, K.E. Kunkel, K.L.M. Lewis, T.K. Maycock and B.C. Stewart. U.S. Global Change Research Program, Washington, D.C., USA, 1309–1345. Retrieved August 2020, from <https://nca2018.globalchange.gov/downloads/NCA4_Ch28_Adaptation_Full.pdf>

Li, J., Mullan, M. and Helgeson, J. (2014). Improving the practice of economic analysis of climate change adaptation. Journal of Benefit-Cost Analysis, 5(3), 445–467. Retrieved August 2020, from <https://doi.org/10.1515/jbca-2014-9004>

Markandya, A. (2019). Natural Capital and the Rate of Discount, in Mainstreaming Natural Capital and Ecosystem Services into Development Policy, (Ed.) P. Kumar. Routledge Taylor and Francis, London, United Kingdom.

Markandya, A., Galarraga, I. and Sainz de Murieta, S. (Eds.) (2014). Routledge Handbook of the Economics of Climate Change Adaptation. Routledge International Handbooks, Abingdon, United Kingdom, 464 p.

Martinich, J., DeAngelo, B.J., Diaz, D., Ekwurzel, B., Franco, G., Frisch, C., McFarland, J. and O’Neill, B. (2018). Reducing risks through emissions mitigation, in Impacts, Risks, and Adaptation in the United States: Fourth National Climate Assessment, Volume II, (Eds.) D.R. Reidmiller, C.W. Avery, D.R. Easterling, K.E. Kunkel, K.L.M. Lewis, T.K. Maycock and B.C. Stewart. U.S. Global Change Research Program, Washington, D.C., USA, 1346–1386. Retrieved August 2020, from <https://nca2018.globalchange.gov/downloads/NCA4_Ch29_Mitigation_Full.pdf>

Mendelsohn, R. (2012). The economics of adaptation to climate change in developing countries. Climate Change Economics, 3(2). Retrieved August 2020, from <https://doi.org/10.1142/S2010007812500066>

Metroeconomica (2004). Costing the impacts of climate change in the UK: Implementation report. Guidelines prepared for the United Kingdom Climate Impacts Program. Oxford, United Kingdom, 373 p. Retrieved August 2020, from <https://www.ukcip.org.uk/wp-content/PDFs/Costings_Implementation.pdf>

Meyer, V., Gebhardt, O. and Alves, F.A. (Eds.) (2015). Economic evaluation of adaptation options. Bottom-up Climate Adaptation Strategies Towards a Sustainable Europe (BASE Project). Ecologic Institute, Berlin, Germany, 547 p. Retrieved August 2020, from <https://base-adaptation.eu/sites/default/files/Deliverable_5_2_FINAL.pdf>

Miller, S., Muir-Wood, R. and Boissonade, A. (2008). An exploration of trends in normalized weather-related catastrophe losses, in Climate Extremes and Society, (Eds.) H.F. Diaz and R.J. Murnane. Cambridge University Press, New York, 383 p. Retrieved August 2020, from <https://doi.org/10.1017/CBO9780511535840.015>

Millerd, F. (2005). The economic impact of climate change on Canadian commercial navigation on the Great Lake. Canadian Water Resources Journal, 30(4), 269–280. Retrieved August 2020, from <https://doi.org/10.4296/cwrj3004269>

Moser, S.C. and Ekstrom, J.A. (2010). A framework to diagnose barriers to climate change adaptation. Proceedings of the National Academy of Sciences of the United States of America (PNAS), 107(51), 22026–22031. Retrieved August 2020, from <https://doi.org/10.1073/pnas.1007887107>

Moss, R., Scarlett, P.L., Kenney, M.A., Kunreuther, H., Lempert, R., Manning, J., Williams, B.K., Boyd, J.W., Cloyd, E.T., Kaatz, L. and Patton, L. (2014). Decision support: Connecting science, risk perception, and decisions, Chapter 26 in Climate Change Impacts in the United States: The Third National Climate Assessment, (Eds.) J.M. Melillo, T.C. Richmond and G.W. Yohe. U.S. Global Change Research Program, Washington, D.C., 620–647. Retrieved August 2020, from <https://data.globalchange.gov/file/3b8af927-bb15-4eac-8107-860e65e6fc6c>

Moudrak, N., Feltmate, B., Venema, H. and Osman, H. (2018). Combating Canada’s rising flood costs: natural infrastructure is an underutilized option. Report prepared for Insurance Bureau of Canada. Intact Centre on Climate Adaptation, University of Waterloo, Waterloo, Ontario, 66 p. Retrieved August 2020, from <http://assets.ibc.ca/Documents/Resources/IBC-Natural-Infrastructure-Report-2018.pdf>

Munich RE (2018). TOPICS Geo natural catastrophes 2017: a stormy year. Munich RE, Munich, Germany, 64 p. Retrieved August 2020, from <https://www.munichre.com/content/dam/munichre/global/content-pieces/documents/TOPICS_GEO_2017-en.pdf/_jcr_content/renditions/original.media_file.download_attachment.file/TOPICS_GEO_2017-en.pdf>

Munich RE (2020). NatCatSERVICE. Munich Re. Retrieved May 2020, from <https://www.munichre.com/en/solutions/for-industry-clients/natcatservice.html>

National Academies of Sciences, Engineering and Medicine (2016). Attribution of extreme weather events in the context of climate change. The National Academies Press, Washington, D.C., 186 p. Retrieved August 2020, from <https://doi.org/10.17226/21852>

National Centers for Environmental Information (2020). NOAA National Centers for Environmental Information, U.S. Billion-Dollar Weather and Climate Disasters. Retrieved May 2020, from <https://www.ncdc.noaa.gov/billions/>

Neumayer, E. and Barthel, F. (2011). Normalizing economic loss from natural disasters: a global analysis. Global Environmental Change, 21(1), 13–24. Retrieved August 2020, from <https://doi.org/10.1016/j.gloenvcha.2010.10.004>

Newell, R.G. and Pizer, W.A. (2003). Discounting the distant future: How much do uncertain rates increase valuations? Journal of Environmental Economics and Management, 46, 52–71. Retrieved August 2020, from <https://doi.org/10.1016/S0095-0696(02)00031-1>

Newell, R.G., Prest, B.C. and Sexton, S.E. (2018). The GDP-temperature relationship: implications for climate change damages. Resources for the Future Working Paper 18–17, Washington, D.C., 61 p. Retrieved August 2020, from <https://www.rff.org/documents/2655/RFF_WP-18-17_rev_10-20.pdf>

Nordhaus W.D. (2007). A review of the “Stern Review on the Economics of Climate Change.” Journal of Economic Literature, 45, 686–702. Retrieved August 2020, from <https://doi.org/10.1257/jel.45.3.686>

Nordhaus, W.D. and Boyer, J. (2000). Warming the world: economic modeling of global warming. Massachusetts Institute of Technology Press, Cambridge, Massachusetts, 258 p.

National Research Council (2009). Informing Decisions in a Changing Climate. Panel on Strategies and Methods for Climate-Related Decision Support, Committee on the Human Dimensions of Global Change. Division of Behavioral and Social Sciences and Education, The National Academies Press, Washington, D.C., 188 p. Retrieved August 2020, from <https://doi.org/10.17226/12626>

National Research Council (2010). Informing an Effective Response to Climate Change. The National Academies Press, Washington, D.C., 346 p. Retrieved August 2020, from <https://doi.org/10.17226/12784>

NRTEE [National Round Table on the Environment and the Economy] (2011). Paying the price: the economic impacts of climate change for Canada. Ottawa, Ontario, 162 p. Retrieved August 2020, from <http://nrt-trn.ca/wp-content/uploads/2011/09/paying-the-price.pdf>

Office of the Auditor General of Canada (2016). Mitigating the impacts of severe weather events. Spring 2016 Reports of the Commissioner of the Environment and Sustainable Development, Report 2, Ottawa, Ontario, 24 p. Retrieved August 2020, from <https://www.oag-bvg.gc.ca/internet/docs/parl_cesd_201605_02_e.pdf>

Ochuodho, T.O. and Lantz, V.A. (2015). Economic impact of climate change on agricultural crops in Canada by 2051: a global multi-regional CGE model analysis. Environmental Economics, 6(1), 113–125. Retrieved August 2020, from <https://www.businessperspectives.org/index.php/component/zoo/economic-impacts-of-climate-change-on-agricultural-crops-in-canada-by-2051-a-global-multi-regional-cge-model-analysis>

Ochuodho, T.O., Lantz, V.A., Lloyd-Smith, P. and Benitez, P. (2012). Regional economic impacts of climate change and adaptation in Canadian forests: a CGE modeling analysis. Forest Policy and Economics, 25, 100–112. Retrieved August 2020, from <https://doi.org/10.1016/j.forpol.2012.08.007>

Organisation for Economic Co-operation and Development (2015). The Economic Consequences of Climate Change. OECD Publishing, Paris, 140 p. Retrieved August 2020, from <https://dx.doi.org/10.1787/9789264235410-en>

Paci, D. (Ed.) (2014). Human Health Impacts of Climate Change in Europe. Report for the PESETA II Project, JRC Technical Reports, Seville, Spain, 28 p. Retrieved August 2020, from <https://doi.org/10.2791/64481>

Parliamentary Budget Officer (2016). Estimate of the average annual cost of Disaster Financial Assistance Arrangements due to extreme weather. Office of the Parliamentary Budget Officer, Ottawa, Ontario, 46 p. Retrieved August 2020, from <https://www.pbo-dpb.gc.ca/web/default/files/Documents/Reports/2016/DFAA/DFAA_EN.pdf>

Parnham, H., Arnold, S. and Fenech, A. (Eds.) (2016). Using cost–benefit analysis to evaluate climate change adaptation options in Atlantic Canada. Report submitted to Climate Change Impacts and Adaptation Division, Natural Resources Canada, Ottawa, 90 p. Retrieved August 2020, from <https://atlanticadaptation.ca/en/islandora/object/acasa%253A779>

Patt, A. G., van Vuuren, D. P., Berkhout, F., Aaheim, S., Hof, A. F., Isaac, M. and Mechler, R. (2010). Adaptation in integrated assessment modeling: where do we stand? Climatic Change, 99, 383–402. Retrieved August 2020, from <https://doi.org/10.1007/s10584-009-9687-y>

Penning-Rowsell, E.C., Haigh, N., Lavery., S. and McFadden. L. (2013). A threatened world city: the benefits of protecting London from the sea. Natural Hazards, 66, 1383–1404. Retrieved August 2020, from <https://doi.org/10.1007/s11069-011-0075-3>

Perrin, A., Dion, J., Eng, S., Sawyer, D., Nodelman, J. R., Comer, N., Auld, H., Sparling, E., Harris, M., Nodelman, J.Y.H. and Kinnear, L. (2015). Economic implications of climate change adaptations for mine access roads in Northern Canada. Northern Climate ExChange, Yukon Research Centre, Yukon College, 93 p. Retrieved August 2020, from <https://www.yukonu.ca/sites/default/files/inline-files/Economic_Implications_TCWR_FINAL_web3.pdf>

Pielke, R.A. Sr, Wilby, R., Niyogi, D., Hossain, F., Dairuku, K., Adegoke, J., Kallos, G., Seastedt, T. and Suding, K. (2012). Dealing with complexity and extreme events using a bottom-up, resource-based vulnerability perspective, in Extreme events and natural hazards: the complexity perspective. Geophysical Monograph Series 196, 345–359. Retrieved August 2020, from <https://pielkeclimatesci.files.wordpress.com/2012/10/r-3651.pdf>

Pielke, R.A., Jr. (2007). Mistreatment of the economic impacts of extreme events in the Stern Review Report on the Economics of Climate Change. Global Environmental Change, 17, 302–310. Retrieved August 2020, from <https://doi.org/10.1016/j.gloenvcha.2007.05.004>

Pielke, R.A., Jr., Gratz, J., Landsea, C.W., Collins, D., Saunders, M.A. and Musulin, R. (2008). Normalized hurricane damages in the United States: 1900–2005. Natural Hazards Review, 9(1), 29-42. Retrieved August 2020, from <https://doi.org/10.1061/(ASCE)1527-6988(2008)9:1(29)>

Pielke, R.A., Jr., Rubiera, J., Landsea, C., Fernández, M.L. and Klein, R. (2003). Hurricane vulnerability in Latin America and the Caribbean: normalized damages and loss potentials. Natural Hazards Review, 4(3), 101–114. Retrieved August 2020, from <https://doi.org/10.1061/(ASCE)1527-6988(2003)4:3(101)>

Porter, J., Dessai, S. and Tompkins, E. (2014). What do we know about UK household adaptation to climate change? A systematic review. Climatic Change, 127, 371–379. Retrieved August 2020, from <https://doi.org/10.1007/s10584-014-1252-7>

Productivity Commission (2012). Barriers to effective climate change adaptation, Report No. 59, Final Inquiry Report. Productivity Commission, Canberra, Australia, 385 p. Retrieved August 2020, from <https://www.pc.gov.au/inquiries/completed/climate-change-adaptation/report/climate-change-adaptation.pdf>

PROVIA (2013). PROVIA guidance on assessing vulnerability, impacts and adaptation to climate change. Consultation document. United Nations Environment Programme (UNEP), Nairobi, Kenya, 198 p. Retrieved August 2020, from <https://www.adaptation-undp.org/sites/default/files/downloads/provia-guidance-nov2013.pdf>

Public Safety Canada (2020). Canadian Disaster Database (CDD). Retrieved May 2020, from <https://www.publicsafety.gc.ca/cnt/rsrcs/cndn-dsstr-dtbs/index-en.aspx>

Randall, A., Capon, T., Sanderson, T., Merrett, D. and Hertzler, G. (2012). Choosing a decision-making framework to manage uncertainty in climate adaptation decision-making: A practitioner’s handbook. National Climate Change Adaptation Research Facility, Gold Coast, Australia, 25 p. Retrieved May 2020, from <https://www.nccarf.edu.au/sites/default/files/attached_files_publications/Randall_2012_Practitioner_handbook.pdf>

Ranger, N., Millner, A., Dietz, S., Fankhauser, S., Lopez, A. and Ruta, G. (2010). Adaptation in the UK: a decision-making process. Policy Brief. Grantham Research Institute on Climate Change and the Environment, London School of Economics and Political Science, London, United Kingdom, 61 p. Retrieved August 2020, from <https://www.lse.ac.uk/granthaminstitute/publication/adaptation-in-the-uk-a-decision-making-process/>

Ranger, N., Reeder, T. and Lowe, J. (2013). Addressing ‘deep’ uncertainty over long-term climate in major infrastructure projects: four innovations of the Thames Estuary 2100 Project. EURO Journal of Decision Process, 1, 233–262. Retrieved August 2020, from <https://doi.org/10.1007/s40070-013-0014-5>

Ratti, M. (2017). The economics of natural disasters: an overview of the current research issues and methods. CERE Working Paper 2017:3, Centre for Environmental and Resource Economics, Umeå University. Retrieved December 2020, from <http://dx.doi.org/10.2139/ssrn.2957459>

Reeder, T. and Ranger, N. (2011). How do you adapt in an uncertain world? Lessons from the Thames Estuary 2100 project. World Resources Report, Uncertainty Series. World Resources Institute, Washington, D.C., 16 p. Retrieved December 2020, from <https://wriorg.s3.amazonaws.com/s3fs-public/uploads/wrr_reeder_and_ranger_uncertainty.pdf>

Reinsborough, M.J. (2003). A Ricardian model of climate change in Canada. Canadian Journal of Economics, 36(1), 21–40. Retrieved August 2020, from <https://doi.org/10.1111/1540-5982.00002>

Revesz, R.L., Howard, P.H., Arrow, K., Goulder, L.H., Kopp, R.E., Livermore, M.A., Oppenheimer, M. and Sterner, T. (2014). Global warming: Improve economic models of climate change. Nature, 508, 173–175. Retrieved August 2020, from <https://www.nature.com/news/global-warming-improve-economic-models-of-climate-change-1.14991>

Rhodium Group (2014). American climate prospectus: economic risks in the United States. Rhodium Group, New York, New York, 201 p. Retrieved August 2020, from <https://rhg.com/research/american-climate-prospectus-economic-risks-in-the-united-states/>

Rodgers, C. and Douglas, A. (2015). Cost benefit analysis of climate change impacts and adaptation measures for Canadian mines: final report. Report submitted to the Climate Change Impacts and Adaptation Division, Natural Resources Canada, Ottawa, 36 p. Retrieved August 2020, from <http://www.climateontario.ca/doc/p_ECCC/1-AP261-FinalReport-FINAL.PDF>

Rose, A., Porter, K., Dash, N., Bouabid, J., Huyck, C., Whitehead, J., Shaw, D., Eguchi, R., Taylor, C., McLane, T., Thomas Tobin, L., Ganderton, P.T., Godschalk, D., Kiremidjian, A.S., Tierney, K. and West, C. (2007). Benefit-cost analysis of FEMA hazard mitigation grants. Natural Hazards Review, 8(4), 97–111. Retrieved August 2020, from <https://doi.org/10.1061/(ASCE)1527-6988(2007)8:4(97)>

Roson, R. and Sartori, M. (2016). Estimation of climate change damage functions for 140 regions in the GTAP9 database. Policy Research Working Paper 7728, World Bank Group, Washington, D.C., 40 p. Retrieved August 2020, from <https://openknowledge.worldbank.org/handle/10986/24643>

Rosenzweig, C. and Solecki, W. (2014). Hurricane Sandy and adaptation pathways in New York: lessons from a first-responder city. Global Environmental Change, 28, 395–408. Retrieved August 2020, from <https://doi.org/10.1016/j.gloenvcha.2014.05.003>

Rouillard, J., Tröltzsch, J., Tarpey, J., Lago, M., Watkiss, P., Hunt, A. Bosello, F., Ermolieva, T., Goodess, C., Mechler, R., Parrado, R., Sainz de Murieta, E. and Scussolini, P. (2016a). The economic analysis of climate adaptation: insights for policy-makers. ECONADAPT project, University of Bath, Bath, United Kingdom, 45 p. Retrieved August 2020, from <https://econadapt.eu/sites/default/files/docs/Deliverable%2010-3.pdf>

Rouillard, J., Tröltzsch, J., Lago, M., Markandya, A., Sainz de Murieta, E. and Galarraga, I. (2016b). Distributional objectives and monetary metrics. ECONADAPT project, University of Bath, Bath, United Kingdom, 60 p. Retrieved August 2020, from <https://www.ecologic.eu/14384>

Schipper, L. and Pelling, M. (2006). Disaster risk, climate change and international development: Scope for, and challenges to, integration. Disasters, 30, 19–38. Retrieved August 2020, from <https://doi.org/10.1111/j.1467-9523.2006.00304.x>

Schmidt, S., Kemfert, C. and Hoppe, P. (2009). Tropical cyclone losses in the USA and the impact of climate change—a trend analysis based on data from a new approach to adjusting storm losses. Environmental Impact Assessment Review, 29, 359–369. Retrieved August 2020, from <https://doi.org/10.1016/j.eiar.2009.03.003>

Scussolini, P., Kuik, O., Veldkamp, T., Hudson, P., Sainz de Murieta, E., Galarraga, I., Kaprová, K., Melichar, J., Lago, M., Rouillard, J., Troeltzsch, J., Hunt, A., Skourtos, M., Goodess, C. and Christensen, O. (2015). The economic appraisal of adaptation investments under uncertainties: policy recommendations, lessons learnt and guidance. ECONADAPT project, University of Bath, Bath, United Kingdom, 37 p. Retrieved August 2020, from <https://econadapt.eu/sites/default/files/docs/Deliverable%206-4%20approved%20for%20publishing.pdf>

Settle, C. and Shogren, J. (2004). Hyperbolic discounting and time inconsistency in a native exotic species conflict. Resource and Energy Economics, 26, 255–274. Retrieved August 2020, from <https://doi.org/10.1016/j.reseneeco.2003.11.010>

Smith, A.B. and Katz, R. (2013). U.S. billion-dollar weather and climate disasters: data sources, trends, accuracy and biases. Natural Hazards, 67, 387–410. Retrieved August 2020, from <https://doi.org/10.1007/s11069-013-0566-5>

Sozou, P. (1998). On hyperbolic discounting and uncertain hazard rates. Proceedings of the Royal Society, 265(1409), 2015-2020. Retrieved August 2020, from <https://doi.org/10.1098/rspb.1998.0534>

Squire, L. and van der Tak, H. (1975). Economic analysis of projects. Johns Hopkins Press, Baltimore, Maryland, USA, 153 p.

Stern N. (2008). The economics of climate change. The American Economic Review, 98, 1–37. Retrieved August 2020, from <https://doi.org/10.1257/aer.98.2.1>

Stern, N. (2006). The economics of climate change: Stern review. Cambridge University Press, Cambridge, United Kingdom, 662 p. Retrieved August 2020, from <https://webarchive.nationalarchives.gov.uk/20100407172811/http://www.hm-treasury.gov.uk/stern_review_report.htm>

Stern, N. (2013). The structure of economic modeling of the potential impacts of climate change: grafting gross underestimation of risk onto already narrow science models. Journal of Economic Literature, 51(3), 838–859. Retrieved August 2020, from <https://doi.org/10.1257/jel.51.3.838>

Sussman, F., Krishnan, N., Maher, K., Miller, R., Mack, C., Stewart, P., Shouse, K. and Perkins, B. (2014). Climate change adaptation cost in the US: What do we know? Climate Policy, 14(2), 242–282. Retrieved August 2020, from <https://doi.org/10.1080/14693062.2013.777604>

Swart, R.J. and Singh, T. (2013). Mediation and the adaptation challenge: identifying appropriate methods and tools to support climate change adaptation decision making. Alterra, Wageningen University and Research, Wageningen, the Netherlands, 32 p. Retrieved August 2020, from <http://www.rec.org/publication.php?id=392>

Swiss Re Institute (2018). Sigma, natural catastrophes and man-made disasters in 2017: a year of record-breaking losses. Sigma No. 1/2018. Swiss Re Institute, Zurich, Switzerland, 53 p. Retrieved August 2020, from <https://www.swissre.com/institute/research/sigma-research/sigma-2018-01.html#:~:text=sigma%20research-,sigma%201%2F2018%3A%20Natural%20catastrophes%20and%20man%2Dmade%20disasters,recorded%20in%20a%20single%20year>

Swiss Re Institute (2019a). Sigma, natural catastrophes and man-made disasters in 2018: secondary perils on the frontline. Sigma No. 2/2019. Swiss Re Institute, Zurich, Switzerland, 30 p. Retrieved August 2020, from <https://www.swissre.com/dam/jcr:c37eb0e4-c0b9-4a9f-9954-3d0bb4339bfd/sigma2_2019_en.pdf>

Swiss Re Institute (2019b). Sigma, world insurance: the great pivot east continues. Sigma No. 3/2019. Swiss Re Institute, Zurich, Switzerland, 45 p.

Swiss Re Institute (2020). Natural catastrophes in times of economic accumulation and climate change. Swiss Re Sigma No. 2/2020. Swiss Re Institute, Zurich, Switzerland, 31 p. Retrieved August 2020, from <https://www.swissre.com/institute/research/sigma-research/sigma-2020-02.html>

TBS [Treasury Board of Canada Secretariat] (2018). Policy on Cost-Benefit Analysis. Treasury Board of Canada Secretariat, Ottawa, ON. Retrieved April 2021, from <https://www.canada.ca/en/government/system/laws/developing-improving-federal-regulations/requirements-developing-managing-reviewing-regulations/guidelines-tools/policy-cost-benefit-analysis.html>

TBS [Treasury Board of Canada Secretariat] (2007). Canadian Cost-Benefit Analysis Guide. September 2018 revision. Treasury Board of Canada Secretariat, Ottawa, ON, 47 p. Retrieved August 2020, from <https://www.tbs-sct.gc.ca/rtrap-parfa/analys/analys-eng.pdf>

Thistlethwaite, J., Minano, A., Blake, J.A., Henstra, D. and Scott, D. (2018). Application of re/insurance models to estimate increases in flood risk due to climate change. Geoenvironmental Disasters, 8(8). Retrieved August 2020, from <https://doi.org/10.1186/s40677-018-0101-9>

Tröltzsch, J., Rouillard, J., Tarpey, J., Lago, M., Watkiss, P. and Hunt, A. (2016). The economics of climate change adaptation: insights into economic assessment methods. ECONADAPT project, University of Bath, Bath, United Kingdom, 42 p. Retrieved August 2020, from <https://econadapt.eu/sites/default/files/docs/Deliverable%2010-2.pdf>

United Nations Environment Programme (2011). A practical framework for developing pro-climate development policy. United Nations Environment Programme (UNEP), Nairobi, Kenya, 142 p. Retrieved December 2020, from <https://www.unenvironment.org/resources/report/practical-framework-planning-pro-development-climate-policy>

UNFCCC [United Nations Framework Convention on Climate Change] (2007). Investment and financial flows to address climate change. UNFCCC, Climate Change Secretariat, Bonn, Germany, 262 p. Retrieved August 2020, from <https://unfccc.int/resource/docs/publications/financial_flows.pdf>

Urge-Vorsatz, D., Tirado-Herrero, S. and Dubash, N. (2014). Measuring the co-benefits of climate change mitigation. Annual Review of Environment and Resources, 39(1), 549–582. Retrieved December 2020, from <https://doi.org/10.1146/annurev-environ-031312-125456>

USAID (2013). Methods for economic analysis of climate change adaptation interventions. Washington, D.C., 60 p. Retrieved December 2020, from <https://www.climatelinks.org/sites/default/files/asset/document/Methods%2520of%2520Economic%2520Analysis_CLEARED.pdf>

US Environmental Protection Agency (2007). Guide to resource planning with energy efficiency. A resource of the national action plan for energy efficiency, US Environmental Protection Agency, Washington, D.C., 81 p. Retrieved August 2020, from <https://www.epa.gov/sites/production/files/2015-08/documents/resource_planning.pdf>

US Environmental Protection Agency (2015). Climate change in the United States: benefits of global action. US Environmental Protection Agency, Office of Atmospheric Programs, EPA 430-R-15-001. Washington, D.C. Retrieved August 2020, from <https://www.epa.gov/cira/downloads-cira-report>

US Environmental Protection Agency (2017). Multi-model Framework for Quantitative Sectoral Impacts Analysis: A Technical Report for the Fourth National Climate Assessment. EPA 430-R-17-001. U.S. Environmental Protection Agency (EPA), Washington, D.C., 271 p. Retrieved August 2020, from <https://cfpub.epa.gov/si/si_public_file_download.cfm?p_download_id=537327&Lab=OAP>

U.S. Global Change Research Program (2018). Impacts, risks, and adaptation in the United States: Fourth National Climate Assessment, Volume II, (Eds.) D.R. Reidmiller, C.W. Avery, D.R. Easterling, K.E. Kunkel, K.L.M. Lewis, T.K. Maycock, and B.C. Stewart. U.S. Global Change Research Program, Washington, D.C., 1515 p. Retrieved August 2020, from <http://doi.org/10.7930/NCA4.2018>

Van der Geest, K. and Warner, K. (2015). Editorial: loss and damage from climate change: emerging perspectives. International Journal of Global Warming, 8(2), 133–140. Retrieved August 2020, from < https://www.researchgate.net/profile/Kees-Van-Der-Geest/publication/282322818_Editorial_Loss_and_damage_from_climate_change_Emerging_perspectives/links/560bac8108ae7fa7b886e9ea/Editorial-Loss-and-damage-from-climate-change-Emerging-perspectives.pdf>

van der Pol, T.D., van Ierland, E. and Weikard, H.-P. (2013). Optimal dike investments under uncertainty and learning about increasing water levels. Journal of Flood Risk Management, 7(4), 308–318. Retrieved August 2020, from <https://doi.org/10.1111/jfr3.12063>

Vanos, J., Vecellio, D.J. and Kjellstrom, T. (2019). Workplace heat exposure, health protection, and economic impacts: a case study in Canada. American Journal of Industrial Medicine, 62(12), 1024–1037. Retrieved August 2020, from <https://doi.org/10.1002/ajim.22966>

Vivid Economics (2013). The macroeconomics of climate change. Report prepared for the UK Department for Environment, Food and Rural Affairs, London, United Kingdom. 95 p. Retrieved August 2020, from <http://randd.defra.gov.uk/Document.aspx?Document=11138_TheMacroeconomicsofClimateChangeFinalReportMay2013.pdf>

Wallimann-Helmer, I., Meyer L., Mintz-Woo K., Schinko T. and Serdeczny O. (2019). The ethical challenges in the context of climate loss and damage, in Loss and damage from climate change, (Eds.) R. Mechler, L. Bouwer, T. Schinko, S. Surminski, J. Linnerooth-Bayer. Climate Risk Management, Policy and Governance, Springer Open, Cham, Switzerland, 39–62. Retrieved August 2020, from <https://doi.org/10.1007/978-3-319-72026-5_2>

Walker, W.E., Haasnoot, M. and Kwakkel, J. H. (2013). Adapt or perish: a review of planning approaches for adaptation under deep uncertainty. Sustainability, 5, 955–979. Retrieved August 2020, from <https://doi.org/10.3390/su5030955>

Wang, W. and McCarl, B. (2011). Temporal investment in climate change adaptation and mitigation. Climate Change Economics, 4(2). Retrieved August 2020, from <https://doi.org/10.1142/S2010007813500097>

Warren, R., Andrews, O., Brown, S., Forstenhaeusler, N., Gernaat, D., Goodwin, P., Harris, I., He, H., Hope, C., Gonzalex-Colon, F., Nicholls, R., Osborn, T., Price, J., Van Vuuren, D. and Wright, R. (2018). Risks associated with global warming of 1.5°C or 2°C. Briefing Note, Tyndall Centre for Climate Change Research, University of East Anglia. Retrieved December 2020, from <https://tyndall.ac.uk/sites/default/files/publications/briefing_note_risks_warren_r1-1.pdf>

Watkiss, P. (2015). A review of the economics of adaptation and climate-resilient development. Grantham Research Institute on Climate Change and the Environment Working Paper No. 205. Grantham Research Institute on Climate Change and the Environment, London School of Economics, London, United Kingdom, 41 p. Retrieved August 2020, from <https://www.lse.ac.uk/granthaminstitute/wp-content/uploads/2015/09/Working-Paper-205-Watkiss.pdf>

Watkiss, P., Hunt, A., Blyth, W. and Dyszynski, J. (2015a). The use of new economic decision support tools for adaptation assessment: a review of methods and applications, towards guidance on applicability. Climatic Change, 132(3), 401–416. Retrieved August 2020, from <https://doi.org/10.1007/s10584-014-1250-9>

Watkiss, P. and Hunt, A. (2013). Method overview: decision support methods for adaptation. Briefing Note 1. Summary of methods and case study examples from the MEDIATION Project. Alterra, Wageningen University and Research, Wageningen, the Netherlands. Retrieved August 2020, from <https://www.sei.org/mediamanager/documents/Publications/sei-mediation-briefing1-method-overview.pdf>

Watkiss, P., Hunt, A. and Savage, M. (2014). Early value for money adaptation toolkit: delivering value-for-money adaptation with iterative frameworks and low-regret options. UK Department for International Development (DFID), London, United Kingdom, 118 p. Retrieved August 2020, from <https://assets.publishing.service.gov.uk/media/57a089a9ed915d622c00033b/Early_VfM_Adaptation_Final_Report.pdf>

Weaver, C.P., Lempert, R.J., Brown, C., Hall, J.A., Revell, D. and Sarewitz, D. (2013). Improving the contribution of climate model information to decision making: The value and demands of robust decision frameworks. Wiley Interdisciplinary Reviews: Climate Change, 4(1), 39–60. Retrieved August 2020, from <https://doi.org/10.1002/wcc.202>

Weber, M. and Hauer, G. (2003) A regional analysis of climate change impacts on Canadian agriculture. Canadian Public Policy, 29(2), 163–180. Retrieved August 2020, from <https://doi.org/10.2307/3552453>

Weiland, S. and Tröltzsch, J. (Eds.) (2015). BASE evaluation criteria for climate adaptation. Bottom-up Climate Adaptation Strategies Towards a Sustainable Europe (BASE Project). Ecologic Institute, Berlin, Germany, 134 p. Retrieved August 2020, from <https://base-adaptation.eu/sites/default/files/BASE_Policy_3_June_2015_0.pdf>

Weitzman M.L. (2007). A review of the Stern Review on the Economics of Climate Change. Journal of Economic Literature, 45, 703–724. Retrieved August 2020, from <https://www.aeaweb.org/articles?id=10.1257/jel.45.3.703>

Weitzman, M.L. (2001). Gamma discounting. American Economic Review, 91(1), 261–271. Retrieved August 2020, from <https://doi.org/10.1257/aer.91.1.260>

Wilby, R. and Dessai, S. (2010). Robust adaptation to climate change. Weather, 65, 180–185. Retrieved December 2020, from <https://doi.org/10.1002/wea.543>

Wilby, R. (2012). Frameworks for delivering regular assessments of the risks and opportunities from climate change. An independent review of the first UK Climate Change Risk Assessment. Final report to the Committee on Climate Change, London, United Kingdom.

Wilson, J., Trenholm, R., Bornemann, J. and Lieske, D. (2012). Forecasting economic damages from storm surge flooding: a case study in the Tantramar Region of New Brunswick. Report prepared for the Atlantic Climate Solutions Association (ACASA) by Green Analytics and the Department of Geography and Environment. Mount Allison University, Sackville, New Brunswick, 59 p. Retrieved August 2020, from <https://atlanticadaptation.ca/en/islandora/object/acasa%253A722>

Wise, R.M., Fazey, I., Stafford Smith, M., Park, S.E., Eakin, H.C., Archer Van Garderen, E.R.M. and Campbell, B. (2014). Reconceptualising adaptation to climate change as part of pathways of change and response. Global Environmental Change, 28, 325–336. Retrieved August 2020, from <https://doi.org/10.1016/j.gloenvcha.2013.12.002>

Withey, P., Lantz, V. and Ochuodho, T. (2016). Economic costs and impacts of climate-induced sea-level rise and storm surge in Canadian coastal provinces: a CGE approach. Applied Economics, 48(1), 59–71. Retrieved August 2020, from <https://doi.org/10.1080/00036846.2015.1073843>

Withey, P., Ochuodho, T. and Lantz, V. (2015). The economic impact of the mountain pine beetle infestation in British Columbia: Provincial estimates from a CGE analysis. Forestry, 89(1), 100–105. Retrieved August 2020, from <https://doi.org/10.1093/forestry/cpv042>

Woodward, M., Gouldby, B., Kapelan, Z., Khu, S-T. and Townend, I. (2011). Incorporating real options into flood risk management decision-making. HR Wallingford, Wallingford, United Kingdom. Retrieved August 2020, from <https://www.researchgate.net/profile/Ian_Townend/publication/279476752_Incorporating_real_options_into_flood_risk_management_decision_making/links/55cb0f9508aeb975674a62f9/Incorporating-real-options-into-flood-risk-management-decision-making.pdf>

Zhai, F., Lin, T. and Byambadorj, E. (2009). A general equilibrium analysis of the impact of climate change on agriculture in the People’s Republic of China. Asian Development Review, 26(1), 206–225. Retrieved August 2020, from <https://www.researchgate.net/profile/Fan_Zhai3/publication/227488886_A_General_Equilibrium_Analysis_of_the_Impact_of_Climate_Change_on_Agriculture_in_the_People’s_Republic_of_China/links/547706780cf2778985b0a0a1/A-General-Equilibrium-Analysis-of-the-Impact-of-Climate-Change-on-Agriculture-in-the-Peoples-Republic-of-China.pdf>

Zhang, X., Flato, G., Kirchmeier-Young, M., Vincent, L., Wan, H., Wang, X., Rong, R., Fyfe, J., Li, G. and Kharin, V.V. (2019). Temperature and Precipitation Across Canada, Chapter 4 in Canada’s Changing Climate Report, (Eds.) E. Bush and D.S. Lemmen. Government of Canada, Ottawa, Ontario, 112–193. Retrieved August 2020, from <https://www.nrcan.gc.ca/sites/www.nrcan.gc.ca/files/energy/Climate-change/pdf/CCCR_Chapter4-Temperature%20and%20Precipitation%20Across%20Canada.pdf>

Zivin, J. and Neidell, M. (2014). Temperature and the allocation of time: Implications for climate change. Journal of Labor Economics, 32(1), 1–26. Retrieved August 2020, from <https://doi.org/10.1086/671766>
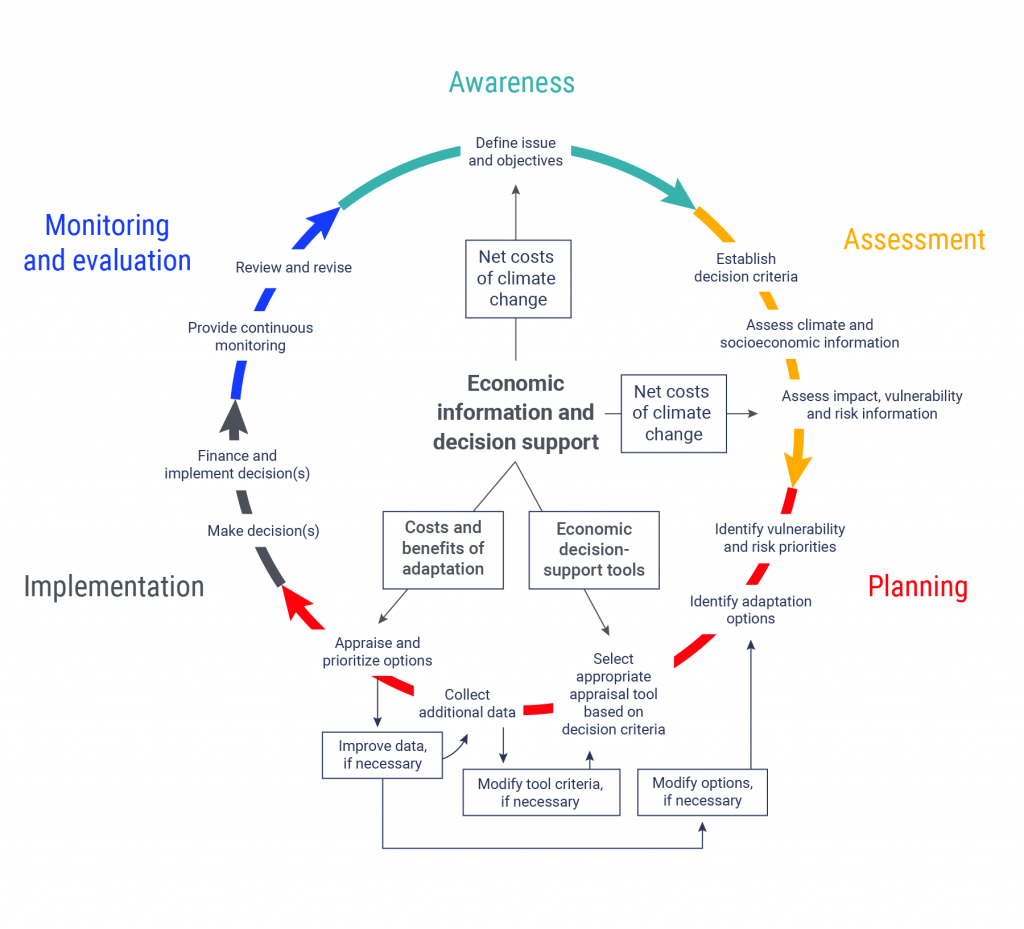
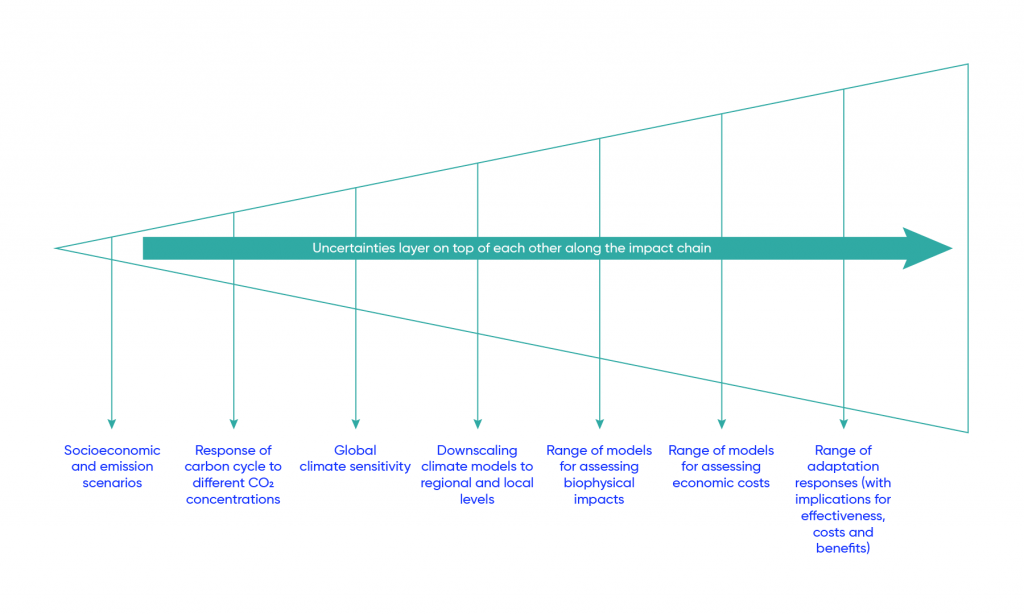
Appendix 6.1

Summary of select national and regional studies of the economic consequences of climate change for specific climate-sensitive sectors in Canada

Sector and study Climate and socioeconomic scenarios Physical and economic impacts Economic consequences
National Regional
Forestry
NRTEE (2011)

(national and provincial / territorial)

Mean annual temperature change for Canada by 2050 under low (IPCC SRES B1; +3.4°C) and high (IPCC SRES A2; +3.6°C) climate change scenarios

GDP growth for Canada by 2050 under slow-growth (+1.3% per annum) and rapid-growth (+3.0% pa) scenarios

Impacts on timber supply from forest fires, pests and diseases, and changes in forest productivity

Changes in projected GDP relative to “no climate change” baseline (using the CGE model)

Range of annual GDP losses in undiscounted 2008 $ (and % change in GDP) by 2050 for Canada under a low climate change–slow growth scenario, and a high climate change–rapid growth scenario:

$2.4‒17.4 billion (-0.12% to -0.33%)

Present-value total GDP losses1 over 2010‒2080 at a 3% discount rate: $25‒176 billion

Range of annual GDP losses in undiscounted 2008 $ (and % change in GDP) by 2050 for specific provinces and territories under a low climate change–slow growth scenario, and a high climate change–rapid growth scenario:

  • AB: $0.2‒1 billion (-0.06% to -0.14%)
  • Atlantic Canada: $0.1‒0.5 billion (-0.07% to -0.21%)
  • BC: $0.5‒3.1 billion

(-0.18% to -0.44%)

  • MB, SK, NU, NWT and YT: $0.5‒$3.3 billion

(-0.33% to -0.85%)

  • ON: $1.0‒7.4 billion (-0.11% to -0.31%)
  • QC: $0.3‒2.1 billion (-0.08% to -0.23%)
Ochuodho et al. (2012)

(national and provincial / territorial)

Low (IPCC SRES B1; +3.4°C) and high (IPCC SRES A2; +3.6°C) climate change scenarios (NRTEE, 2011)

GDP growth for Canada as per NRTEE (2011) through 2080: slow-growth = +1.3% per annum and rapid-growth = +3.0% per annum

Pessimistic (worst-case) and optimistic (best-case) impacts on timber supply from forest fires, pests and diseases, and changes in forest productivity

Changes (relative to “no climate change” baseline) in projected sector output values, GDP and welfare (compensating variation) using the CGE model

Range in present-value total losses for Canada for the period 2010‒2080 under the optimistic low climate change–slow growth scenario, and the pessimistic high climate change–rapid growth scenario (in 2008 $ at a 3% discount rate):

  • Sector output: $6‒707 billion
  • GDP: $4‒459 billion
  • Welfare: $3‒296 billion
Range in present-value total losses for specific provinces and territories for the period 2010‒2080 under the optimistic low climate change–slow growth scenario, and the pessimistic high climate change–rapid growth scenario (in 2008 $ at a 3% discount rate):

  • AB: $1‒21 billion
  • Atlantic Canada: >$1‒15 billion
  • BC: $3‒66 billion
  • ON: -$1‒+$209 billion
  • QC: -$3 billion‒+$76 billion
  • Rest of Canada: $4‒72 billion

In some of the above cases, productivity gains offset losses from fires and pests.

Hope et al. (2015)1

(national and provincial / territorial, excluding the Atlantic Provinces, Nunavut and national parks)

Change in the 4-month sum (May‒August) of the Climate Moisture Index (CMI) projected by four general circulation models (GCMs) under RCP2.6 and RCP8.5, relative to the 1961‒1990 climate normal

Static socioeconomic scenario (i.e., suppression costs are constant in real terms)

Changes in the area burned as a function of projected changes in the CMI

Changes in fixed and variable fire suppression costs (relative to costs incurred in 1980‒2009) as a function of projected changes in the area burned

Total average annual fire suppression costs2 (in 2009 $) by the 2080s, relative to the period 1980‒2009:

  • Under RCP2.6: $625 million (or +60%)
  • Under RCP8.5: $640 million (+119%)
The two most affected provinces in terms of % change in fire suppression costs by the 2080s, relative to the period 1980‒2009:

  • Under RCP2.6: AB (+141%) and SK (+218%)
  • Under RCP8.5: AB (+195%) and SK (+265%)
Corbett et al. (2015)

(British Columbia)

No emissions scenario per se, but a projection of Annual Allowable Cut in BC with mountain pine beetle infestations (32% decline over 50 years)

Projected economic growth of 33% for BC over the period 2009‒2054

Impact of mountain pine beetle infestations on timber supply in BC

Changes relative to baseline in projected welfare (compensating variation) and provincial macroeconomic indicators, using the CGE model

Not applicable Present-value total losses for BC for the period 2009‒2054 (in current $ at a 4% discount rate):

  • GDP: $57 billion (decline of 1.3% per annum)
  • Welfare: $90 billion
Agriculture
Weber and Hauer (2003)

(national and provincial)

Single model run of the CGCMII model (Canadian Centre for Climate Modelling and Analysis) covering the period 1950‒2070 (note: specific changes in temperature and precipitation were not provided)

Ricardian model of agricultural land values estimated for the period 1995‒1996 (baseline is static)

Impacts of monthly and quarterly projected temperature and precipitation anomalies (30-year average over 2021‒2051) on static 1995‒1996 agricultural land values and farmland returns using a Ricardian model, with fixed prices Projected climate-induced gains in agricultural land values for Canada (average over entire country) in 1995 $ per hectare: $1,485

Equivalent to 16% increase in 1995 national agricultural GDP of $32 billion (assuming returns are annualized at a +4.7% discount rate)

Projected climate-induced gains in agricultural land values by province in 1995 $ per hectare (and % change in provincial agricultural GDP):

  • AB: $1,675 (+23%)
  • BC: $1,145 (+7%)
  • MB: $1,425 (+17%)
  • ON: $2,215 (+5%)
  • QC: $1,460 (+4%)
  • NB: $1,225 (+6%)
  • NL: $570 (+1%)
  • NS: $775 (+5%)
  • PEI: $800 (>0%)
  • SK: $1,555 (+38%)
Reinsborough (2003)

(national)

Assumed a mean annual temperature increase of 2.8°C uniformly across Canada and mean annual precipitation increases of 8% (relative to the 1961‒1990 norm)

Ricardian model of farmland values estimated for the period 1995‒1996 (baseline is static)

Impacts of uniform increase in temperature and precipitation (relative to the 1961‒1990 norm) on static 1995‒1996 farmland values, using a Ricardian model with fixed prices Projected climate-induced gains in farmland values for Canada (total for entire country) in 1995 $: +$0.9‒1.5 million

Negligible compared with the 1995 national agricultural GDP of $32 billion

Not considered
Ochuodho and Lantz (2015)

(national and provincial / territorial)

Emissions scenario based on changes in crop yields and agricultural land values for the period 2006‒2051, derived from Weber and Hauer (2007) and Cline (2007)

Baseline scenario of projected economic growth (without climate change) over the period 2006‒2051

Impacts of climate change on crop yields

Changes (under emissions scenario relative to baseline scenario) in projected welfare (compensating variation) and provincial/territorial macroeconomic indicators estimated using multi-regional CGE model, including the USA and rest of the world

% change between the present value of total GDP for Canada over the period 2006‒2051 and the baseline scenario, at a 4% discount rate: +1.7% % change in present value of total provincial/territorial GDP and welfare, respectively, over the period 2006‒2051:

  • AB: +2.5%, +1.9%
  • BC: +6.3%, +5.6%
  • MB: +1.3%, -0.1%
  • NL: +2.5%, -0.1%
  • NS: +1.4%, +1.2%
  • NB: +1.5%, -0.4%
  • ON: +1.0%, -0.65
  • QC: +0.5%, +0.2%
  • PEI: +0.8%, -1.1%
  • SK: +0.5%, -0.5%
  • NWT, NU and YT: +0.4%, -0.1%
Zhai et al. (2009)

(national)

Emissions scenario based on changes in crop yields, with and without carbon fertilization effects, derived from Cline (2007) for the period 2010‒2080

Baseline scenario of global average projected GDP growth of +3.1% (2010‒2050) and +2.5% (2050‒2080)

Impacts of climate change on paddy rice, wheat, other grain and other crop yields

Changes (under emissions scenario relative to baseline scenario) in projected GDP, welfare (equivalent variation) and agricultural sector output, estimated using CGE model of global economy

Impact of climate change on welfare and select macroeconomic indicators for Canada, in terms of % change between projected scenario in 2080 and baseline:

  • Welfare: +0.2%
  • GDP: -0.2%
  • Terms of trade: +0.8%
  • Sector output (crops): +22.1%
  • Sector output (livestock): -15.3%
  • Sector output (processed foods): -1.6%
Not applicable
Amiraslany (2010)

(Prairie provinces)

Assumed mean annual temperature increases (relative to 1961‒1990 norm) over the Prairies of +1.05°C (2020), +2.19°C (2050) and +3.26°C (2080), and precipitation changes (in mm per day) of +0.016 (2020), +0.116 (2050) and +0.186 (2080)

Ricardian model of farmland values estimated from 1991, 1996 and 2001 data (baseline is static)

Impacts of uniform increase in temperature and precipitation (relative to 1961‒1990 norm) on static farmland values, using a Ricardian model

The model also included impacts of projected changes in wheat and canola prices with climate change of +5% by 2020, +15% by 2050 and +25% by 2080

Not applicable Average projected climate-induced change in farmland values across AB, MB and SK, including price and planted area change in 1996 $ per hectare (and % change):

  • 2020: +$145 (+15%)
  • 2050: +$385 (+40%)
  • 2080: +$505 (+50%)

Decreases in land values are projected for areas of southeast Alberta in all future time periods

Ayouqi and Vercammen (2014)

(Prairie provinces)

Projected temperature and precipitation changes based on the IPCC SRES A2 emissions scenario (from CGCM model only):

  • Mean annual temperature: +1.3°C (2020s), +2.6°C (2050s) and +4.1°C (2080s)
  • Mean annual precipitation: +5% (2020s), +12% (2050s) and +17% (2080s)

Ricardian model of farmland values estimated from 1991, 1996, 2001, 2006 and 2011 data (baseline is static)

Impacts of uniform increase in temperature and precipitation (relative to 1971‒2000 norm) on static farmland values (using a Ricardian model)

The model also included impacts of projected changes in wheat, canola, alfalfa, barley and cattle prices with climate change: +5% by 2020, +15% by 2050 and +25% by 2080

Not applicable Average projected climate-induced change in farmland values, including price and planted area change, across AB, MB and SK (in 2002 $), depending on Ricardian model specification used:

  • 2020s: +$1.1–1.7 billion per annum
  • 2050s: +$1.9–2.7 billion per annum
  • 2080s: +$1.9–4.1 billion per annum

$4.1 billion is equivalent to 35% of the Prairie’s agricultural GDP in 2011 ($11.7 billion in 2002 $)

Coastal areas
National Round Table on the Environment and the Economy (NRTEE) (2011)

(national and provincial / territorial)

Sea-level rise by 2050 under low (IPCC SRES B1; +28cm) and high (IPCC SRES A2; +29cm) climate change scenarios

GDP growth for Canada by 2050 under slow-growth (+1.3% per annum) and rapid-growth (+3.0% per annum) scenarios

Impacts of permanent flooding from sea-level rise and temporary flooding from storm surges relative to “no climate change” baseline

Market value of lost dwellings and direct repair-replacement costs of damaged property

Annual coastal flooding costs for Canada attributable to climate change by 2050 (in 2008 $):

  • Low climate change–slow growth scenario: $0.9 billion
  • High climate change–rapid growth scenario: $8.1 billion

Present-value total flooding costs over the period 2011‒2100 (at a 3% discount rate): $109–379 billion

Range of annual coastal flooding costs attributable to climate change by 2050 (in 2008 $) for specific provinces and territories, based on the two climate change scenarios:

  • BC: $840–7,645 million
  • MB: $0–2 million
  • QC: $5–55 million
  • NB: $10–225 million
  • NL: $7–80 million
  • NS: -$10 to -$110 million
  • NU: $20–165 million
  • PEI: $4–55 million

In NS, homes are abandoned and not rebuilt (as in the baseline case), hence the cost savings

Withey et al. (2016)

(national and provincial / territorial)

Impacts in terms of direct damages from sea-level rise and storm surge for the 2050s, under the IPCC SRES B1 and A2 climate change scenarios (NRTEE, 2011)

Projected economic growth in seven coastal regions over the period of 2009‒2054

Impacts in terms of direct damage of flooding on dwellings, and to agriculture and forest lands from sea-level rise and storm surge relative to baseline scenario, with damages under current climate conditions

Changes (relative to baseline) in projected welfare (compensating variation) and provincial/territorial macroeconomic indicators, using a CGE model

Present-value total losses for 2009‒2054 for Canada under the IPCC SRES B1 and A2 scenarios, relative to cumulative losses under current climate conditions (in 2008 $ and at a 4% discount rate):

  • GDP: $10–70 billion
  • Welfare: >$1–25 billion
Present value total losses to provincial/territorial GDP under the same scenarios (in 2008 $, at a 4% discount rate):

  • BC: $8–60 billion
  • NB: >$1–2 billion
  • NL: -$1–2 billion
  • NS: $0–1 billion
  • PEI: $0‒ >$1 billion
  • QC: >$1–8 billion
  • NU, NWT and YT: >$1–3 billion
Boyer-Villemaire et al., (2016); Circé et al., (2016a); Parnham et al., (2016)

(Atlantic Canada and Quebec)

Sea-level rise scenario for 2015‒2064 based on RCP8.5; the erosion scenario is based on linear extrapolation of historical erosion rates; and the flooding scenario is based on projected return periods for floods

Static socioeconomic scenario (i.e., no growth) and no new adaptation actions

Direct impacts of sea-level rise, storm surge and coastal flooding, plus coastal erosion

Direct costs from damage to infrastructure, buildings and land; direct losses from business interruption and traffic disruption; costs of response and recovery; and range of non-market impacts (e.g., loss of natural habitats, loss of cultural heritage, decline in recreational use, etc.)

Not applicable Present-value total direct costs for 11 case study sites, encompassing 46 coastal segments in Quebec and Atlantic Canada (in 2012 $, at a 4% discount rate): $1.2 billion

Range of present-value direct costs per coastal segment (across all 46 segments): $0‒$705 million

Median present-value direct costs across all 46 segments: $1 million

Wilson et al. (2012)

(Tantramar region of southeast New Brunswick)

Storm surge flooding scenario with climate change from Daigle (2012)

Static socioeconomic scenario (i.e., no growth) and no new adaptation actions

Impact of climate change on storm surge flooding

Direct damage to residential, commercial, industrial and public buildings and contents; direct damage to vehicles; and direct losses in terms of agricultural output

Not applicable Expected annual costs4 (in 2000 $):

  • 2000: $1.5 million
  • 2025: $1.7 million
  • 2055: $2.2 million
  • 2085: $3.1 million

Present-value total annual costs over the period 2000‒2100 (in 2000 $, at a 4% discount rate): $60 million

Health
Larrivée et al. (2015)

(Quebec)

For heat stress: median temp extremes and frequencies from ensemble of CMIP5 simulations for RCP4.5 and RCP8.5

For other health outcomes considered: biophysical impacts informed by literature

Static socioeconomic scenario (i.e., no growth), and no new adaptation actions

Morbidity and mortality health outcomes associated with heat stress, vector-borne disease (Lyme disease) and West Nile virus) and aeroallergens (pollen)

Government health-related expenditures, payments for days lost due to illness, private medical costs

Premature mortality valued using Value of Statistical Life (VSL) = $3.6 million

Not applicable Total present-value costs for Quebec government over 2015‒2064 (in 2012 $, discounted at 4%) (mean, 10th and 90th percentile):

  • Heat stress ($370 million, $245‒515 million)
  • Lyme disease ($60 million, $40‒95 million)
  • West Nile virus ($35 million, none)
  • Pollen ($360 million, $290‒430 million)

For society, the mean total present-value costs are (including cost of premature mortality):

  • Heat stress ($33 billion)
  • Lyme disease ($745 million)
  • West Nile virus ($835 million)
  • Pollen ($475 million)
Water levels (low flow)
Larrivée et al. (2016)

(St. Lawrence River, Quebec)

Two hydrological scenarios for the St. Lawrence River between the Quebec-Ontario border and Trois-Rivières, QC for the period 2015–2064: 1) critical annual flows gradually reached by 2040s, recovering partially thereafter; 2) lower flows than reference in summer and autumn by 2020

Static socioeconomic scenario based on historical data (i.e., no growth) and no new adaptation actions

Impact of low water levels in the St. Lawrence River on maritime transport; municipal water treatment; ecological services and fishing; recreational boating and tourism; hydroelectric generation; and waterfront property values Not applicable Total present-value direct costs over the period 2015‒2064 (in 2012 $, at a 4% discount rate):

  • Foregone transport capacity: $40–210 million
  • Foregone water sales:  >$0.1 million
  • Foregone use value and earnings from fishing: $3,220 million
  • Foregone value of boating days: $65–75 million
  • Foregone hydroelectricity sales: $50–90 million
  • Reduction in value of waterfront properties: $70 million
Dorling and Hanniman (2016)

(Lake Michigan-Huron)

Projected average water level for the period 2041–2060 from the scenario for 2050 projected by the Canadian Centre for Climate Modelling and Analysis (CCCma 2050); values for other years over the period 2015‒2064 based on linear interpolation

Static socioeconomic scenario based on historical data (i.e., no growth) and no new adaptation actions

Impact of low water levels in Lake Michigan-Huron (projected levels relative to the annual average for the period 1918‒2014) on commercial shipping and harbours; tourism and recreational water activities; hydroelectric generation; and waterfront property values Not applicable Total present-value direct costs over the period 2015–2064 (in 2012 $, at a 4% discount rate):

  • Additional harbour maintenance costs: $90 million
  • Lost shipping capacity: $1,840 million
  • Additional dredging costs and lost rental income: $7 million
  • Cost of replacing lost hydroelectric generation: $6,200 million
  • Reduction in value of waterfront properties: $535 million
Millerd (2005)

(Great Lakes‒St. Lawrence River system)

Simulation of water depths in Great Lakes‒St. Lawrence River system from three 2 x CO2 scenarios (from the Canadian Centre for Climate Modelling and Analysis); projected water levels compared with normal average monthly water levels over the period 1900‒1989

Static baseline: freight shipping data for 2001

Impact of low water levels in Great Lakes‒St. Lawrence River system (projected levels relative to annual average for the period 1918‒2014) on commercial shipping (bulk commodities, loose goods, petroleum products)

Total cost of origin-destination voyage (loading, unloading and operating costs)

Not applicable Increase in annual shipping costs (in 2001 $) with climate change (relative to 1900‒1989 annual average): $20–75 million (or +8–29%), depending on how quickly the CO2 concentrations double
Mining
Perrin et al. (2015)

(Tibbitt to Contwoyto Winter Road, Northwest Territories)

Projections for specific climate variables of interest (i.e., freezing degree days and melting degree days) under RCP8.5 for the 2020s and 2050s (compared with the 1981‒2010 norm)

Static baseline: average road use (demand) for 2002‒2012

Impact of climate-induced change on length of operating season (e.g., late opening, early closure, no opening) for the Tibbitt to Contwoyto Winter Road (TCWR), a mine access road built mainly over frozen lakes in NWT

Direct cost of alternative transportation modes and direct production losses at applicable mines

Not applicable Average annual total direct costs (price basis not specified): $215 million (of which $150 million are production losses and $65 million are  costs related to modal shift), with 60% probability that costs could exceed the average
Winter recreation – resort skiing
DaSilva et al. (2019)

(Mont Orford, Mont Sutton and Bromont Montagne in Quebec)

Mean value (and 10–90th percentiles) of relevant climate variables from 10 emissions scenarios covering all four RCPs for the period 2020‒2050

Projected visitation at each resort (Mont Orford, Mont Sutton, Bromont Montagne) over the period 2020‒2021 to 2049‒2050, spanning 30 seasons (demand equations were estimated, including variables for weather and snow conditions)

Impact of climate change on beginning and length of ski season, skiable area and snow conditions for the three ski resorts in 2050, relative to 2020

Direct operating costs (e.g., power, maintenance, salaries, etc.) and direct changes in revenue from change in skier visitation (day and season passes, catering, etc.)

Not applicable Change in aggregate direct revenues for all three resorts for the period 2045‒2049 relative to 2020‒2024 (in 2015 $): -$2.1 million (-6.4%)

Change in aggregate direct operating costs: -$1 million

(-3.4%)

Change in aggregate direct net income: -$1.1 million (-29.2%)

Butsic et al. (2011)

(Whistler and Fernie, British Columbia)

Projections of snowfall equivalent to total precipitation (or “snowfall intensity”) were constructed from (ensemble average) temperature and precipitation projections for the 2050s using the IPCC SRES A2 scenario (vs. the 1971‒2000 norm)

Static baseline: Hedonic property price model estimated using housing transaction data from the period 1980‒2006

Impact of climate-induced change in “snowfall intensity”

(5-year moving average) by the 2050s on house prices in Whistler, BC and Fernie, BC

Not applicable Reduction in house prices near ski resorts in BC (% change relative to the 1980‒2006 average):

  • Whistler: -3.2% for every 1% projected decrease in snowfall intensity
  • Fernie: -1.1% for every 1% projected decrease in snowfall intensity

Snowfall intensity projections and total $ reductions in house values were not provided for BC resorts, only for USA resorts

1 The projected increases to wildfire suppression costs estimated by this study could be interpreted as reactive adaptation expenditures. There is a real opportunity cost associated with such additional expenditures, which would not be incurred in the absence of climate change. Hence, this study is included in the table.

2 “Present-value total losses” is the discounted sum of the costs incurred each year between, in this instance, 2010 and 2080. See Section 6.6.3.2 and Appendix 6.3 on the rationale for discounting costs and for the choice of discount rate.

3 Average annual costs or losses are the average change per year over a defined period (e.g., 2071–2100).

4 Use of the term “expected” means that the estimated average annual costs are probability-weighted.

Note: The estimated economic consequences of climate change in this table assume no new planned adaptation, relative to the baseline.

Appendix 6.2

Summary of select studies of the economic consequences of climate change for Canadian municipalities

Study Municipality Climate and socioeconomic scenarios Physical and economic impacts Economic consequences
National Round Table on the Environment and the Economy (NRTEE) (2011) Toronto, ON; Vancouver, BC; Calgary, AB; and Montreal, QC Mean annual temperature change for Canada by 2075 under low (IPCC SRES B1; +4.3°C) and high (IPCC SRES A2; +5.3°C) climate change scenarios

GDP growth for Canada under two scenarios: slow-growth (+1.3% per annum) and rapid-growth (+3.0% per annum)

Health outcomes associated with warmer summers (heat-related premature death) and poorer air quality (illness and premature death)

Healthcare expenditures, welfare losses

Premature mortality valued using Value of a Statistical Life:  $6.1 million per death

Present-value total cost1 of premature mortality attributable to heat and air quality impacts over the period 2010‒2100 under the low climate change– slow growth scenario, and the high climate change–rapid growth scenario (in 2008 $, at a 3% discount rate):

  • Calgary: $11–17 billion
  • Montreal: $52–77 billion
  • Toronto: $65–96 billion
  • Vancouver: $36–48 billion

Present-value total healthcare expenditures under the same scenarios described above (in 2008 $, at a 3% discount rate):

  • Calgary: $16–54 billion
  • Montreal: $54–213 billion
  • Toronto: $72–285 billion
  • Vancouver:$46–140 billion
Thistlethwaite et al. (2018) Halifax Regional Municipality, NS Projected 24-hour precipitation intensity under RCP2.6 and RCP8.5 for the periods 2015‒2045, 2035-2065 and 2065‒2095, relative to 1955‒2009 (historical conditions)

Static baseline: 54,000 residential single dwellings in Halifax Regional Municipality

Impacts of rainfall-driven riverine flooding of residential property

Insured losses (direct repair-replacement costs of damaged property and contents)

Average annual insured losses2 under current climate conditions: $543,000

Average annual insured losses with climate change under RCP8.5:

  • By 2050: $1.3 million (+137%)
  • By 2100: $2.2 million (+300%)
Boyd (2018) Edmonton, AB Baseline scenario for 2018: annual probability of 17 extreme events (at a given intensity level) and degree days based on 1981‒2010 data

Projections of changes in extreme event probabilities (constant intensity) and degree days for 2050s and 2080s under RCP8.5

Baseline socioeconomic conditions defined by 2018 data

Projected socioeconomic scenario for 2050s and 2080s; driven by population and housing forecasts, city growth studies, price forecasts, and relationships estimated from historic data

Market and non-market impacts of changes in the probability of climate-related extreme events and changes in heating and cooling degree days under a high-emissions scenario relative to the baseline scenario for 2018

Direct damages (repair-replacement costs) to residential, commercial and industrial buildings, home contents, business inventories, range of infrastructure and the natural environment; direct impacts to health & safety; direct losses from business interruption; and indirect and induced losses resulting from direct market impacts (estimated using city-level input-output multipliers)

Expected annual average net social costs3 (in 2016 $, undiscounted) attributable to the impact of climate change on extreme events and heating and cooling demand in:

  • 2055: +$4.7 billion
  • 2085: +$10.3 billion

Expected annual average net GDP costs in:

  • 2055: +$1.6 billion (1.6% of projected GDP)
  • 2085: +$3.5 billion (1.9% of projected GDP)
Insurance Bureau of Canada (2015) Halifax, NS; Mississauga, ON Baseline scenario for 2015: intensity and return period of storm surge flooding and extreme wind events (Halifax Regional Municipality), and flooding from storm water and freezing rain events (Mississauga) based on historic data for the last 20‒50 years

Projections of extreme events for 2020 and 2040 under “moderate” (RCP4.5 or IPCC SRES B1 or B2) and “high” (RCP8.5 or IPCC SRES A2) climate change scenarios (from various sources)

Baseline socioeconomic conditions defined by 2015 data

Projected socioeconomic scenario for 2020 and 2040; driven by population forecasts and land-use plans, and by historic GDP growth trends

Market-based impacts of climate-related extreme events under moderate and high-emissions scenarios relative to baseline scenario

Direct damages (repair-replacement costs) to residential, commercial and industrial buildings, home contents, power lines, plus direct losses from business interruption; and indirect and induced losses resulting from direct impacts (estimated using city-level input-output multipliers)

Cumulative expected GDP costs4 attributable to climate change over the period 2015‒2040 for moderate and high-emissions scenarios (in 2013 $, undiscounted) for Halifax Regional Municipality:

  • Storm surge flooding: $25–35 million
  • Extreme winds: $65–140 million

Cumulative expected GDP costs attributable to climate change over the period 2015‒2040 for the same scenarios as described above (in 2013 $, undiscounted) for Mississauga:

  • Storm water flooding: $30–70 million
  • Freezing rain: $28–31 million
Lantz et al. (2012) Fredericton, NB Best-case and worst-case flooding return frequency scenarios constructed from downscaled General Circulation Models results (for 2020s, 2050s and 2080s) and projections of sea-level rise, which affects peak flood heights

Projected population growth scenario over the next 50 years (low: -0.6%; high: +23%)

Impacts of freshwater flooding along the Saint John River in Fredericton

Direct market costs to government (e.g., emergency services, clean-up and restoration, temporary lodging); business (e.g., property and inventory damage, additional operating costs); and households (e.g., property and content damage, temporary displacement costs, lost work time)

Non-market costs for households (e.g., transport disruption, mental health, lost leisure time) collected via a survey using the contingent valuation method (minimum “willingness-to-accept” compensation)

Expected annual average direct costs due to climate change (price basis unknown):

  • Worst-case flooding return frequency and high population scenario: $13.2 million (of which $7.9 million are market costs and $5.3 million are non-market costs)
  • Worst-case flooding return frequency and low population scenario: $5.3 million (of which $4 million are market costs and $1.3 million are non-market costs)
  • Best climate and low population scenario: -$0.12 million (of  which -$0.09 million are market costs and -$0.03 million are non-market costs
  • Best climate and high population scenario: -$0.32 million (of which -$0.18 million are market costs and -$0.14 million are non-market costs
1 Present-value total cost is the discounted sum of costs incurred each year between 2010 and 2100. See Section 6.6.3.2 and Appendix 6.3 on the rationale for discounting costs and for the choice of discount rate.

2 Average annual loss (or cost) is the average loss (or cost) per year over a defined period (e.g., 2050–2100).

3 Use of the term “expected” means that the estimated average annual costs are probability weighted.

4 Cumulative cost in this case means the undiscounted sum of costs incurred each year between 2015 and 2040.

Appendix 6.3: What is discounting?

The value attached today to receiving one dollar a year from now is expressed as:

1/(1 + d)

Where d is the discount rate. If d were 0.05 (5%), the value of a dollar in one year’s time would be 95 cents today. If the discount rate is constant, and one wants to know the value of one dollar two years from now, the 95 cents would decline by another 5% in the second year and be worth 91 cents today. The mathematical expression for that could be written as:

1/(1 + 0.05)= 0.91 x $1 = $0.91

Extending this over several years would result in a value that declines geometrically.

Hence, if an individual were to invest one dollar today, they would need to obtain a benefit of at least $1.05 in one year’s time to consider the investment worthwhile. Likewise, the benefit required in two years would be $1.052 = $1.05 x $1.05 = $1.103. In T years the amount required to make the investment worthwhile would need to be (1 +d)T.

In practice, the benefits of an adaptation investment likely accrue over several years, in which case the comparison must be made between the investment now and the sum of these benefits over future years, each discounted from the year in which it occurs. This sum is referred to as the present value (PV) and is written as:

Where Bt is the adaptation benefit in year t in monetary terms.

Appendix 6.4

Summary of select economic appraisals of adaptation actions in Canada using a cost-benefit analysis tool

Study, location Climate change impacts Adaptation options Time frame, discount rate and prices Economic performance of adaptations
Forestry
National Round Table on the Environment and the Economy (NRTEE) (2011)


(national and by province)

Impacts on timber supply from forest fires, pests and diseases; changes in forest productivity 1) Enhance forest fire prevention, control and suppression

2) Enhance pest control

3) Plant tree species suitable for the future climate

Aggregate adaptation costs for all three actions (present value for the period 2010–2080, in 2008 $):

  • Low climate change scenario: $2.3 billion
  • High climate change scenario: $3.6 billion
Present-value for 70 years (2010‒2080)

Constant discount rate: 3% per annum

In 2008 $ (benefits of adaptation measured a change in welfare—compensating variation)

Combined benefit-cost ratio for all three adaptation actions:

  • Low climate change–slow growth scenario: 9.1
  • High climate change–rapid growth scenario: 38.1

Present value of total residual damages post-adaptation (in 2008 $):

  • Low climate change–slow growth scenario: $4.6 billion
  • High climate change–rapid growth scenario: $37.1 billion
Ochuodho et al. (2012)


(national and by province)

Pessimistic (worst-case) and optimistic (best-case) impacts on timber supply from forest fires, pests and diseases; changes in forest productivity 1) Increasing pest prevention and control

2) Increasing forest fire prevention, control and suppression

3) Planting alternative species that are more suitable for future conditions

Aggregate adaptation costs for all three actions (present value for the period 2010–2080, in 2008 $, range reflects best-case and worst-case scenarios):

·       Low climate change–slow growth scenario: $1.3–3.4 billion

·       High climate change–rapid growth scenario: $2–5.3 billion

Net present value for 70 years (2010–2080)

Constant discount rate: 3% per annum

In 2008 $

Combined net present value for all three adaptation actions (in 2008 $; range reflects best-case and worst-case scenarios):

  • Low climate change–slow growth scenario: $16.619.6 billion
  • High climate change–rapid growth scenarios: $171.2243.1 billion
Health
NRTEE (2011)


(Toronto)

Premature deaths associated with warmer summers and poorer air quality 1) Green roofs: reduce the urban heat-island effect by 1°C through widespread adoption of green roofs

2) Improve air quality: install pollution control technologies to eliminate ozone-forming emissions attributable to climate change

Present value of adaptation costs (in 2008 $):

1) $7.3 billion (installations over the period 2035–2050, maintained through 2059)

2) $0.7 to $3.1 billion (installations over the period 2050–2059 under low and high climate change scenarios)

Present value for 10 years (2050‒2059)

Constant discount rate: 3% per annum

In 2008 $

Benefit-cost ratio for option 1):

  • Low climate change–slow growth scenario: <0.3
  • High climate change–rapid growth scenarios: >0.3

Benefit-cost ratio for option 2):

  • Low climate change–slow growth scenario: 4.0
  • High climate change–rapid growth scenario: 1.6

Present value of residual damages post-adaptation (in 2008 $) for option 1):

  • Low climate change–slow growth scenario: $2.0 billion
  • High climate change–rapid growth scenarios: $4.2 billion

Present value of residual damages post-adaptation for option 2):

  • No residual damages since it is assumed that the actions fully offset the health impacts of climate change
Mining
Rodgers and Douglas (2015)


(Glencore’s Sudbury Integrated Nickel Operation, Ontario)

Extreme rainfall and flooding; high and low water levels Unknown options to manage five environmental triggers: 1) high water levels; 2) low water levels; 3) intense rainfall event; 4) low flood risk; 5) high flood risk

Adaptation costs not specified

Payback over 39-year period

Constant discount rate: 2% per annum

Payback threshold achieved by adaptation actions to manage environmental triggers 2), 3) and 5)
Perrin et al. (2015)


(Tibbitt to Contwoyto Winter Road, Northwest Territories)

Impact of changes to length of operating season (late opening, early closure, no opening) for Tibbitt to Contwoyto Winter Road, a mine access road built mainly over frozen lakes in NWT 1) flexible scheduling (shorter season)

2) increased ice road construction and maintenance

3) increased portage construction and maintenance

4) increased ramp construction and maintenance

Present value of adaptation costs (in $ million) (mean, 10th and 90th percentiles) for each option:

1) $44, $28 to $59

2) $5.8, $5.2 to $6.4

3) $5.3, $4.7 to $5.8

4) $0.3, $0.2 to $0.4

Present value over 35 years

Constant discount rate: 4% per annum

Price basis not specified

Net present value for the package of actions ($ million) (mean, 10th and 90th percentiles): $160, -$30 to $305

The above net present values reflect the difference in present-value costs between a “critical conditions scenario” (including the costs of modal shift and production losses at mines) and an “adaptive scenario” (with the four adaptation actions)

Water levels
Larrivée et al. (2016)


(St Lawrence River, Quebec)

Impact of low water levels in the St Lawrence River on maritime transport; municipal water treatment; ecological services and fishing; recreational boating and tourism; hydroelectric generation; and waterfront property values Options related to marine transport:

1) dredging

2) minimizing under-keel clearance

3) a combination of both

Present value of adaptation costs (in 2012 $) for each option:

1) $8.8 million

2) $3.2 million

3) $12 million

Net present value for 50 years (2015‒2064)

Constant discount rate: 4% per annum

In 2012 $

Net present value (in 2012 $) and benefit-cost ratio in brackets for each option, with the range defined by two “what if” hydrological scenarios: (a) critical annual flows gradually reached by 2040s, recovering partially thereafter, and (b) flows in summer and autumn lower than reference by 2020:

1) $3726.1 million (1.51.4)

2) $24.320 million (1.91.7)

3) $46.426.2 million (1.51.3)

Options related to municipal water treatment:

  • Modifying or replacing existing pumps with those capable of functioning at lower levels
  • Increasing or reconfiguring intake systems to reduce the risks of head loss and hydraulic constraints

Present value of adaptation costs for two case study municipal water treatment plants (2012 $ million):

  • Plant 1: $0.1 million
  • Plant 2: $2.3 million
Net present value (in 2012 $) and the benefit-cost ratio in brackets:

  • Plant 1: -$0.1 million (<0.1)
  • Plant 2: -$2.3 million (<0.01)

The above results are only for the hydrological “what if” scenario (a).

Benefits only include market value of lost water production; they do not include the value of disrupted water supply to consumers

Options related to ecological services and fishing:

  • Restoration of riparian zones
  • Restoration of the floodplain
  • Change in agricultural practices
  • More efficient wastewater treatment
  • Protection and restoration of habitat
  • Education and awareness

Present value of adaptation costs for package of actions (in 2012 $): $560 million (optimistic cost: $345 million, pessimistic cost: $1,005 million)

Net present value (in 2012 $) and benefit-cost ratio in brackets for the package of actions:

  • For hydrological scenario (a) and based on pessimistic adaptation costs: $225 million (1.2)
  • For hydrological scenario (b) and based on pessimistic adaptation costs: $2,265 million (3.3)
Dorling and Hanniman (2016)


(Lake Michigan-Huron)

Impacts of low water levels (worst-case scenario) 1) submerged sills (+21 cm water level)

2) fixed rock-filled dikes (+16 cm)

3) parallel dykes and weirs (+16 cm)

4) inflatable flap gates (+16 cm)

5) hydrokinetic turbines (+19 cm)

Present value adaptation costs (in 2012 $ US):

1) $40.6 million (no delay, staged construction) to $64.3 million (20-year delayed, non-stage construction)

2) $55.4 million to $47.4 million

3) $102.6 million to $78.0 million

4) $145.6 million to $83.1 million

5) $215.8 million to $140.4 million

Net present value for two construction scenarios: construction now (2015‒2064) and construction delayed (2015–2084)

Constant discount rate: 4% per annum

In 2012 $ US

Range in net present value for each option (in 2012 $ US) across the two construction scenarios:

1) $235 million to $50 million

2) $55 million to $45 million

3) $100 million to $80 million

4) $135 million to $5 million

5) $125 million to -$25 million


Agriculture
Berry et al. (2017)


(Pelly’s Lake, Manitoba)


Impact of water stress (water availability) on agricultural crop yields (canola, wheat, alfalfa, barley) Water storage retention ponds at Pelly’s Lake and irrigation system

Costs of retention pond and irrigation infrastructure (in 2015 $): $160.00 per hectare

Gross income and gross margin per hectare (undiscounted)

In 2015 $

Average difference in crop gross margins without irrigation and with ponds and irrigation (and associated costs) for the period 2050–2059 (in 2015 $ per hectare):

  • RCP2.6: -148
  • RCP4.5: -146
  • RCP8.5: -147

Average difference in crop gross margins without irrigation and with ponds and irrigation (and associated costs) for the period 2090–2099 (in 2015 $ per hectare):

  • RCP2.6: -146
  • RCP4.5: -147
  • RCP8.5: -148

The availability of irrigation water increased crop production, but the resultant increase in gross income was insufficient to offset the costs of the ponds and irrigation system.

Winter recreation – resort skiing
DaSilva et al. (2019)


(Mont Orford, Mont Sutton and Bromont Montagne, Québec)

Impact on the start of the ski season, the length of ski season, the skiable area and snow conditions for three ski resorts in Quebec Options for Bromont Montagne:

B1) Increase snow-making capacity

B2) Synthetic ski slope

B3) Diversify activities for corporate clients

Options for Mont Sutton:

S1) Increase snow-making capacity

S2) Upgrade infrastructure to enhance quality of experience

S3) Develop hosting capacity

S4) Develop mountain biking capacity

Options for Mont Orford:

O1) Optimize existing snow-making capacity

O2) Increase snow-making capacity

O3) Extend opening hours on portions of hill

O4) Increase beginner and intermediate slope capacity

O5) Invest in summer activities

O6) Regional coordination of activities offered

Net present value over the period 2020‒2024 to 2045‒2049

Constant discount rate: 4%

In 2015 $

$ values for estimated net present values were not provided; the study only indicated whether adaptation actions had a positive or negative net present value.

Only snow-making optimization measures at Mont Orford (O1) had a positive net present value (i.e., passed a cost-benefit test). This result holds across all 10 emissions scenarios considered in the analysis.

Coastal areas
NRTEE (2011)


(national and by province)

Impacts of permanent flooding from sea-level rise and temporary flooding from storm surges 1) “Wise development planning”: prevent new development in areas that will be at risk of flooding

2) Strategic retreat: rebuild homes in areas that are not prone to flooding

Adaptation costs assumed to be zero for options 1) and 2)

Net present value for 90 years (2010–2100)

Constant discount rate: 3% per annum

In 2008 $

Net present value for option 1) (in 2008 $):

  • Low climate change–slow growth scenario: $4.3 billion
  • High climate change–rapid growth scenario: $55.1 billion

Net present value for option 2) (in 2008 $):

  • Low climate change–slow growth scenario: $16.7 billion
  • High climate change–rapid growth scenario: $173 billion

Present value of residual damages post-adaptation (2008 $) for option 1):

  • Low climate change–slow growth scenario: $13.2 billion
  • High climate change–rapid growth scenario: $127 billion

Present value of residual damages post-adaptation (2008 $ billion) for option 2):

  • Low climate change–slow growth scenario: $0.9 billion
  • High climate change–rapid growth scenario: $9.1 billion
Wilson et al. (2012)


(Tantramar region of Southeast New Brunswick)

Impact of storm surge flooding 1)     Dyke top-up

2)     Relocation of infrastructure

3)     Dyke top-up and relocation

Present value adaptation costs (in 2000 $) for the above options:

1) $1.3 million

2) $10.3 million (relocation occurs over 20 years)

3) $11.5 million

Net present value for 100 years (2000‒2100)

Constant discount rate: 4% per annum

In 2000 $

Net present value (in 2000 $) and benefit-cost ratio in brackets for each option:

1) $40 million (31.0)

2) $20 million (2.9)

3) $35 million (4.0)

Present value of residual damages post-adaptation for each option (in 2000 $):

1) $19 million

2) $29.3 million

3) $12.7 million

Parnham et al. (2016)


(Chignecto Isthmus, Nova Scotia and New Brunswick)

Impact of sea-level rise, storm surge and coastal flooding 1) Raising existing agricultural dykes to 10 m

2) Combination of raising dykes to 10 m, shortening sections and raising infrastructure

3) Build new engineered dykes on top of existing dykes

4) Build new engineered dykes (shortened sections, protect public infrastructure only)

5) Build new engineered dykes (shortened sections, protect all infrastructure)

6) Relocate road

Net present value for 50 years (2015‒2064)

Constant discount rate: 4% per annum

In 2012 $

Benefit-cost ratio (no trade impacts case) for each option:

1) 0.5

2) 0.6

3) 1.1

4) 0.9

5) 1.5

6) 0.3

Benefit-cost ratio (trade impacts case) for each option:

1) 1.8

2) 1.9

3) 3.9

4) 3.2

5) 5.0

6) 1.0

Parnham et al. (2016)


(Halifax Harbour, Nova Scotia)

Impact of sea-level rise, storm surge and coastal flooding 1) Build seawall

2) Raise structures


Net present value for 50 years (2015‒2064)

Constant discount rate: 4% per annum

In 2012 $

Benefit-cost ratio (road and no trade impacts case) for each option:

1) 0.010.08

2) 0.010.50

Benefit-cost ratio (rail and  trade impacts case) for each option:

1) 1.82.6

2) 0.54.3

Parnham et al. (2016)


(North Cape Coastal Drive, Kildare, Prince Edward Island)

Impact of sea-level rise, storm surge and coastal flooding, plus coastal erosion 1) reactive, business as usual

2) planned (minimum level of adaptation: shoreline stabilization)

3) planned (medium level of adaptation: install a dyke to protect park)

4) planned (maximum level of adaptation: use of most appropriate adaptation option to maintain current activities)

5) relocate park, seasonal residents stay

6) abandon park, seasonal residents leave

Net present value for 50 years (2015‒2064)

Constant discount rate: 4% per annum

In 2012 $

Benefit-cost ratio for each option:

1) 0.9

2) 1.0

3) 0.8

4) 0.5

5) 0.6

6) 1.2

Parnham et al. (2016)


(Tracadie Harbour, Prince Edward Island)

Impact of sea-level rise, storm surge and coastal flooding, plus coastal erosion 1) reactive, business as usual

2) planned (medium level of adaptation: install a dyke)

3) planned (maximum level of adaptation: install a dyke and raise buildings and roads)

4) close wharf, protect private property

5) abandon all

Net present value for 50 years (2015‒2064)

Constant discount rate: 4% per annum

In 2012 $

Benefit-cost ratio for each option:

1) 0.8

2) 0.4

3) 0.6

4) 0.3

5) 0.3

Parnham et al. (2016)


(Bay Bulls – Witless Bay, Newfoundland)

Impact of sea-level rise, storm surge and coastal flooding Engineered solutions across six sites, mainly involving raising or relocating infrastructure Net present value for 50 years (2015‒2064)

Constant discount rate: 4% per annum

In 2012 $

Benefit-cost ratio:

0.01 to 20.6 (depending on site and adaptation)

Parnham et al. (2016)


(Marystown, Newfoundland)

Impact of sea-level rise, storm surge and coastal flooding Engineered solutions across six sites, mainly involving raising roads, land and buildings, and building seawalls Net present value for 50 years (2015‒2064)

Constant discount rate: 4% per annum

In 2012 $

Benefit-cost ratio:

0.01 to 20.5 (depending on site and adaptation)

Aubé et al. (2016)


(Le Goulet, New Brunswick)

Impact of sea-level rise, storm surge and coastal flooding, as well as erosion 1) Dyke

2) Beach nourishment

3) Beach nourishment with breach

Net present value for 100 years (2016‒2116)

Constant

Unknown price basis

Benefit-cost ratio for each option:

1) 0.6

2) 1.9

3) 1.6

Aubé et al. (2016)


(Sainte-Marie-Saint-Raphaël, Cap-Bateau, Pigeon Hill, New Brunswick)

Impact of sea-level rise, storm surge and coastal flooding, as well as erosion 1) Relocation of homes at risk

2) Build erosion controls

Net present value for 100 years (2016‒2116)

Constant discount rate: 3% per annum

Unknown price basis

Benefit-cost ratio for each option:

1) 0.3

2) 0.4

Aubé et al. (2016)


(Shippagan and Pointe-Brûlée, New Brunswick)

Impact of sea-level rise, storm surge and coastal flooding, as well as erosion 1) Change in zoning to establish retreat and accommodation zone

2) Change in zoning, assuming no impact on property values

Net present value for 100 years (2016‒2116)

Constant discount rate: 3% per annum

Unknown price basis

Benefit-cost ratio for each option:

1) 1.6

2) 2.2

Circé et al. (2016a)


(Percé, Quebec)

Impact of sea-level rise, storm surge and coastal flooding, plus coastal erosion 1) Beach nourishment

2) Planned retreat

Net present value for 50 years (2015‒2064)

onstant discount rate: 4% per annum

In 2012 $

Range of benefit-cost ratios for each option across coastal segments:

1) 1.6268.4

2) 1.01.4

Circé et al. (2016a)


(Maria, Quebec)

Impact of sea-level rise, storm surge and coastal flooding, plus coastal erosion 1) Beach nourishment and groynes

2) Planned retreat and raising infrastructure

Net present value for 50 years (2015‒2064)

Constant discount rate: 4% per annum

In 2012 $

Range of benefit-cost ratios for each option across coastal segments:

1) 1.1*

2) 1.13.6

Circé et al. (2016a)


(Carleton-sur-Mer, Quebec)

Impact of sea-level rise, storm surge and coastal flooding, plus coastal erosion 1) Beach nourishment

2) Planned retreat

3) Beach nourishment and groynes

4) Raising infrastructure

5) Planned retreat and raising infrastructure

Net present value for 50 years (2015‒2064)

Constant discount rate: 4% per annum

In 2012 $

Range of benefit-cost ratios for each option across coastal segments:

1) 2.1*

2) 1.3*

3) 1.6*

4) 1.7*

5) 0.31.8

Circé et al. (2016a)


(Îles-de-la-Madeleine, Quebec)

Impact of sea-level rise, storm surge and coastal flooding, plus coastal erosion 1) Beach nourishment

2) Riprap

3) Planned retreat

Net present value for 50 years (2015‒2064)

Constant discount rate: 4% per annum

In 2012 $

Range of benefit-cost ratios for each option across coastal segments:

1) 25.8*

2) 1.14.6

3) 1.01.7

Circé et al. (2016a)


(Kamouraska, Quebec)

Impact of sea-level rise, storm surge and coastal flooding, plus coastal erosion Planned retreat and raising of infrastructure Net present value for 50 years (2015‒2064)

Constant discount rate: 4% per annum

In 2012 $

Benefit-cost ratio: 1.4
Note: In the final column, for each identification, numbers in green font indicate that adaptation actions under consideration passed an economic efficiency test (i.e., the estimated net present value (NPV) > 0 or the BCR > 1); numbers in red font indicate that adaptation actions under consideration failed an economic efficiency test (i.e., the estimated NPV < 0 or the BCR < 1).

*Where only the value is listed, the adaptation option in question was only used in one coastal segment.

Appendix 6.5: Using equity weights to account for the distribution of costs and benefits

If people receiving benefits from an adaptation action or bearing the costs of the action belong to different income classes, it is possible to explicitly account for this by applying distributional weights according to their relative income levels. The weight attached to a person in group  with annual income Yi is given as wi, where:

And Y is the average income of the chosen reference group (e.g., the third income quintile) and ε is referred to as the inequality aversion parameter. Estimates of  have been made in the literature indicating a central estimate in the range of 1.5 [1.0-2.0] (Groom and Maddison, 2018).

The following example shows how the weights would work. Assume the population of interest has an average income of $20,000 per annum. The weights to be attached to benefits accruing to individuals at different income levels are shown in the table below:

Income ($) Weight
ε = 1 ε = 2
5,000 4 16
10,000 2 4
20,000 1 1
50,000 0.4 0.16
100,000 0.2 0.04


A reduction in climate-related damages of $1 to a person with an income of $5,000 would be given a value of $4 in the economic analysis if ε is assumed to be one and $16 if  is assumed to be two, and so on for other income levels.

Footnotes

  1. Unless specified otherwise, all values presented in this chapter are in Canadian dollars (CAD).
  2. The low climate change scenario (IPCC SRES B1) assumes an annual average temperature change for Canada of +3.4°C by 2050, with a +28 cm rise in sea level. The assumed changes in temperature and sea level under the high-climate-change scenario (IPCC SRES A2) by 2050 are +3.6°C and +29 cm, respectively (NRTEE, 2011). Annual average growth in GDP under the slow-growth scenario and the rapid-growth scenario is assumed to be 1.3% and 3.0%, respectively (NRTEE, 2011).
  3. A “fat-tail” catastrophic event is one where the costs of climate catastrophes are more probable, characterized by a probability distribution that does not have a typical bell shape, but rather has a long, fat tail that extends out to the right.
  4. Interested readers can access several guidelines that focus on the economic appraisal of adaptation actions—e.g., Asian Development Bank (2015); Meyer et al. (2015); Boyd et al. (2013); PROVIA (2013); USAID (2013); Economics of Climate Adaptation (2009) and Metroeconomica (2004). Other resources are available that provide specific guidance to help with selecting economic appraisal methods (e.g., Tröltzsch et al., 2016; Watkiss et al., 2015a; Swart and Singh, 2013; and Watkiss and Hunt, 2013).
  5. Strictly speaking, there are two main rationales for giving less weight to future economic effects. One is based on consumption and the other on investment (Arrow et al., 2012). Regarding the former, individuals and society give less weight to the future because of the expectation that future generations will be wealthier and the welfare that they receive from additional consumption will decline as their level of consumption increases. In other words, society exhibits a time preference for current consumption over future consumption. The investment rationale takes the view that so long as society can earn a positive rate of return on investment, it can invest less than one dollar today to obtain a dollar of benefits in the future. In this case, the discount rate would be equated to the rate of return on investment. Each rationale leads to different discount rates.
  6. Some of the assumptions used by Jenkins and Kuo (2007) to arrive at the rate of 8% have been questioned by Boardman et al. (2008), who suggest that it should be in the range of 2.5% to 4.7%.
  7. Flow adaptation actions are typically low-cost, short-lived responses to climate change impacts, where the costs and benefits are borne in the same time period. They are generally flexible and can be readily scaled up or down, or modified. For instance, a farmer who chooses to plant new heat-resistant crops in response to the climate getting warmer exemplifies a “flow” adaptation. The farmer will incur the costs of the new seeds, and accrue the benefits in the same period (Felgenhauer and Webster, 2014; de Bruin, 2011).
  8. There may be some overlap with the cost estimate by the Insurance Bureau of Canada and Federation of Canadian Municipalities (2020) of $5.3 billion annually, which included four municipalities from Quebec.
  9. Market failures can also occur in financial systems (e.g., if a potential borrower has better information about their ability to repay a loan than the lender) and can limit how much, if anything, an individual or business can borrow, or can lead to unfavourable financing terms and interest rates.
Next

Sector Impacts and Adaptation