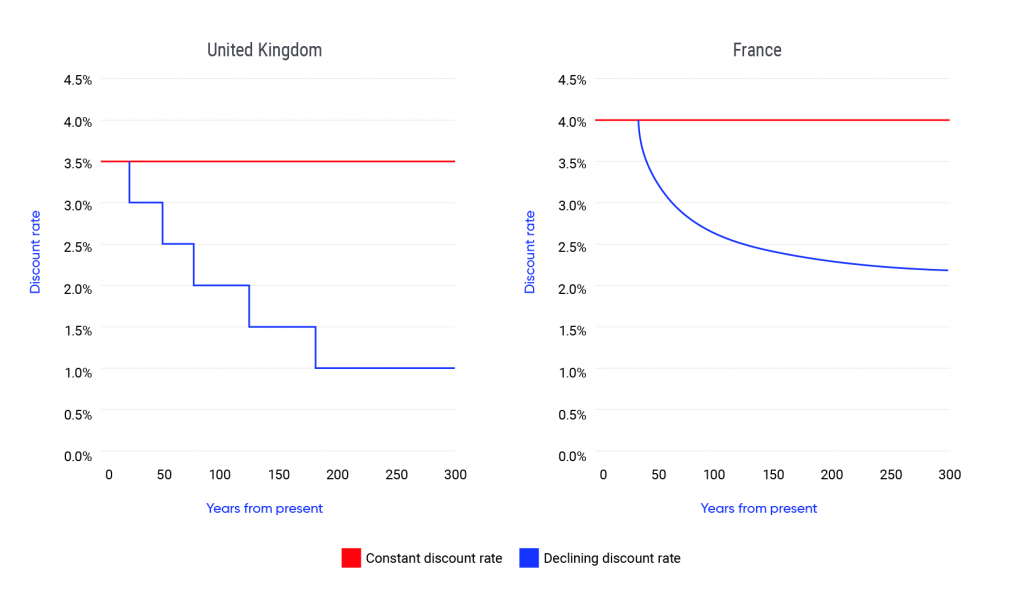
Declining social discount rate schedules in practice in the UK and France. The solid red line shows the social discount rate if it were assumed to be constant over time, whereas the solid blue line shows the schedule of declining discount rates used to appraise public policies, programs and projects in each country. The social discount rate schedule for the United Kingdom declines in discrete steps from 3.5% per annum to 1% per annum. In France, the official rate begins to decline after 30 years, following a hyperbolic path. In both countries, the discount rate to be applied to benefits in year 200 is lower than the rate for year 100. As a result, more weight is being assigned to the future rather than applying a constant discount rate to benefits in all years.
Source
Adapted from Damon et al., 2013.