Figure 6.16: -
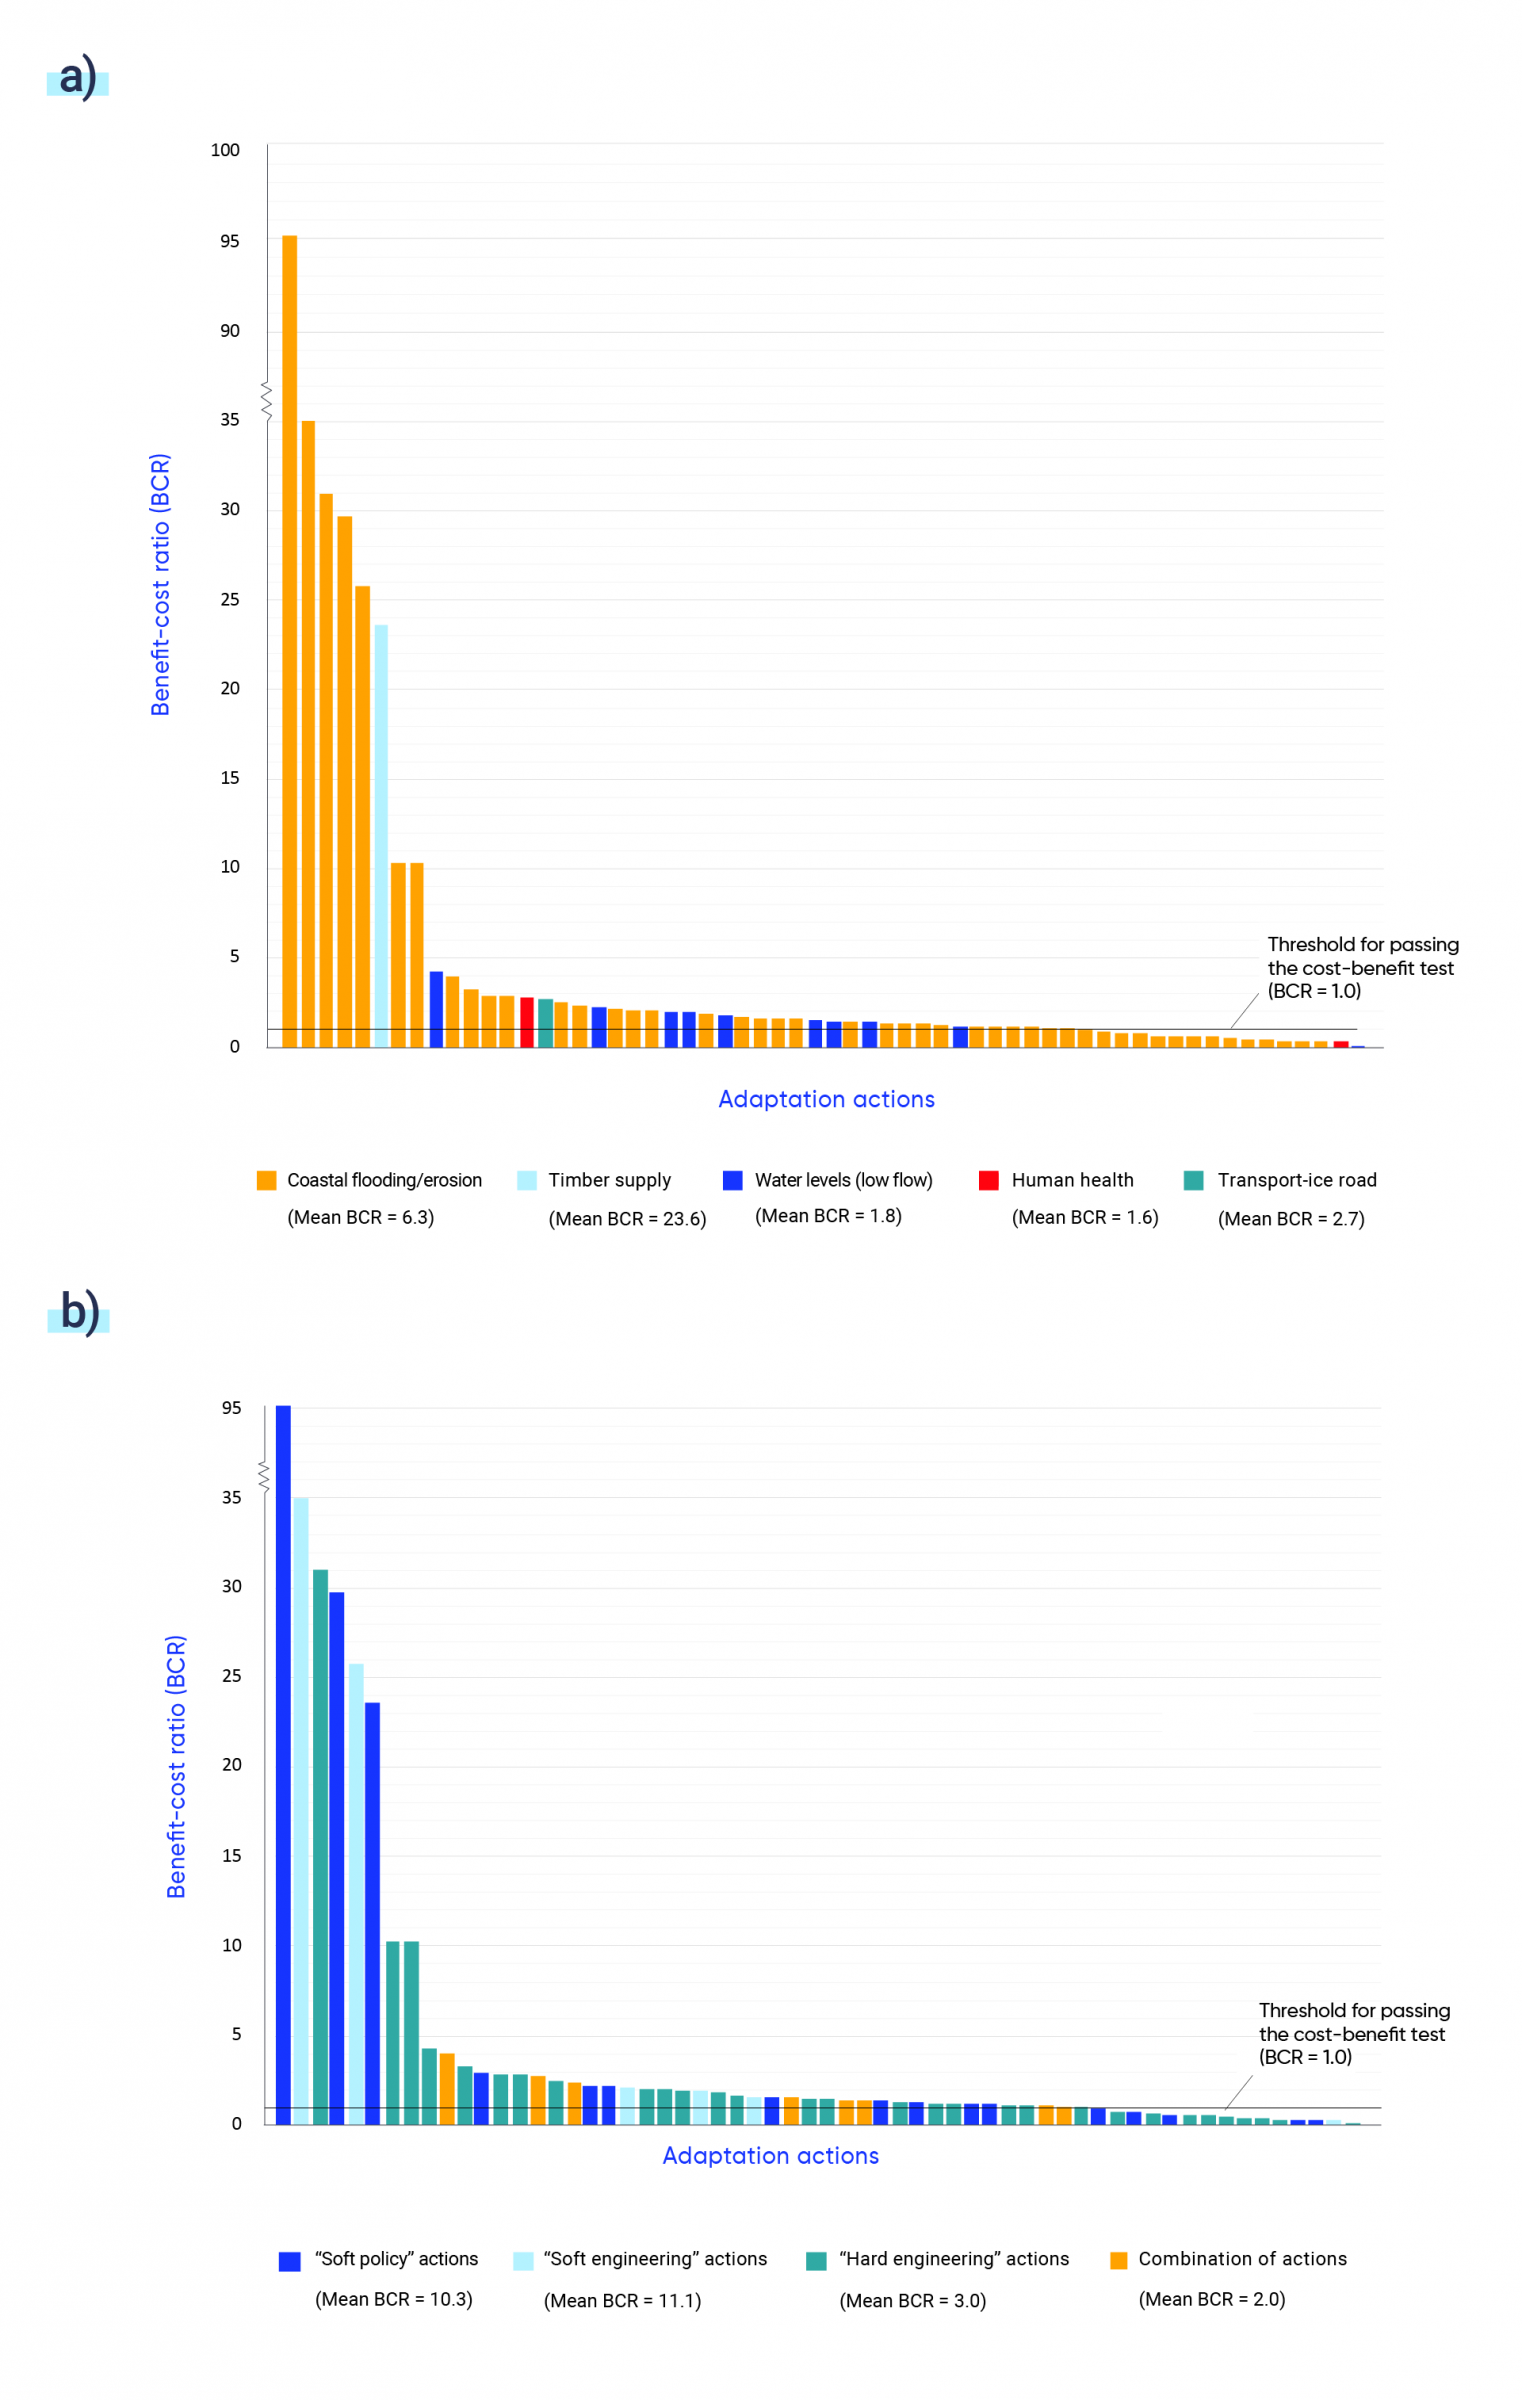
The figure shows estimated benefit-cost ratios (BCR)—present-value benefits divided by present-value costs—for 60 adaptation actions in Canada (see Appendix 6.4). Of the actions considered, 75% have a BCR greater than one, indicating that the benefits exceed the costs incurred to generate those benefits (i.e., these would typically be considered as justifiable investments on economic efficiency grounds). The unweighted average BCR across the 60 actions is 5.6, although the unweighted median BCR is 1.5. a) shows the benefit-cost ratios of different types of adaptation actions from the sample, differentiated by climate-sensitive sector, and b) shows the benefit-cost ratios of these actions, differentiated by category of adaptation action: “soft policy” actions (e.g., planned retreat, enhanced pest control, flexible scheduling); “soft engineering” actions (e.g., beach nourishment, green roofs); “hard engineering” actions (e.g., dykes, weirs, sea walls); and “combination” actions.
Source
Data source: see Appendix 6.4