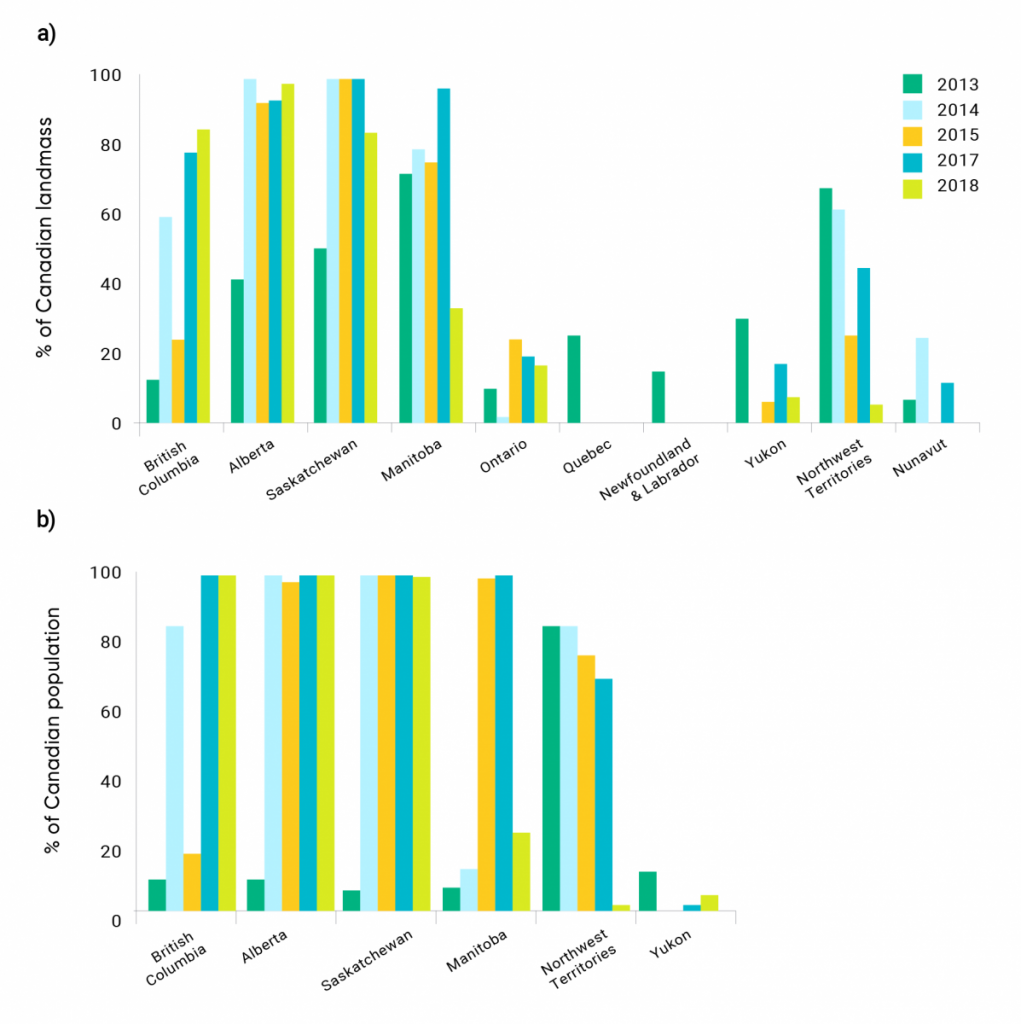
Figure 5.4: Percent of landmass and percent of population by province and territory with average (May to September) wildfire-PM2.5 concentrations ≥1 µg/m3 for 2013-2018.


Panel A shows the percent of landmass with average wildfire-PM2.5 concentrations of 1 µg/m3 or more for 2013 to 2018 (May to September). Panel B shows the percent of the population exposed to average wildfire-PM2.5 concentrations of 1 µg/m3 or more for 2013 to 2018 (May to September). Only provinces and territories affected at more than 5% (of landmass or population) are included in the panels.
Matz et al., 2020.