Gosselin, P., Campagna, C., Demers-Bouffard, D., Qutob, S., & Flannigan, M. (2022). Natural Hazards. In P. Berry & R. Schnitter (Eds.), Health of Canadians in a Changing Climate: Advancing our Knowledge for Action. Ottawa, ON: Government of Canada.
Lead Authors
Pierre Gosselin (Institut national de santé publique du Québec et Centre Terre, Eau, Environnement de l’Institut national de la recherche scientifique)
Céline Campagna (Institut national de santé publique du Québec et Centre Terre, Eau, Environnement de l’Institut national de la recherche scientifique)
Contributing Authors
David Demers-Bouffard (Institut national de santé publique du Québec)
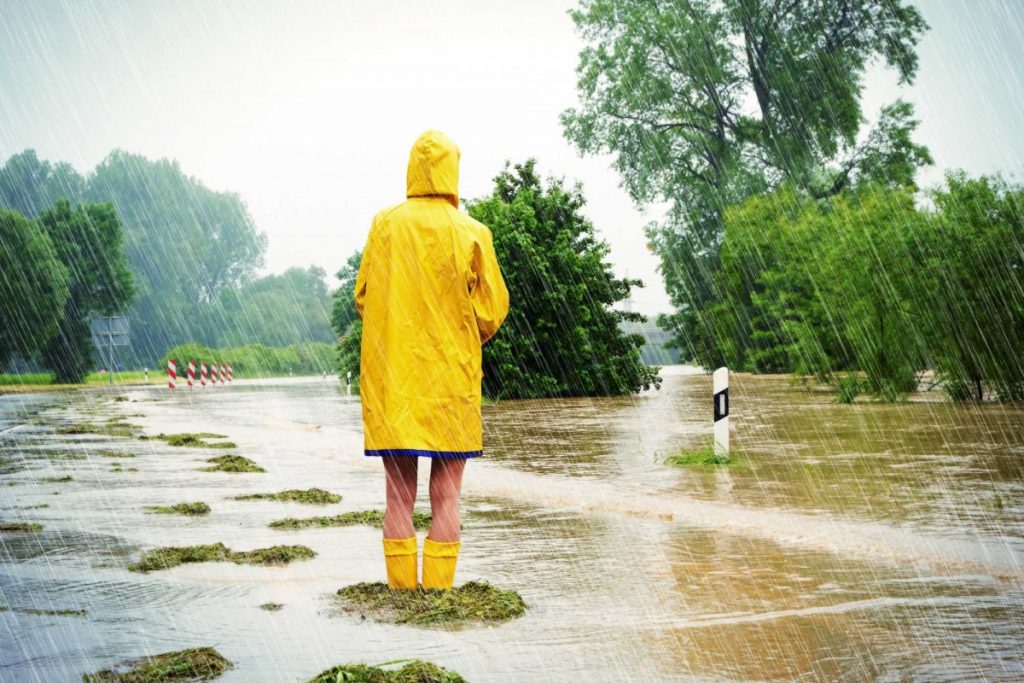
Heatwaves, major floods, wildfires, coastal erosion, and droughts are examples of natural hazards whose frequency and intensity are influenced by climate change. These hazards can cause loss of life, injury and various health problems, damage to property, social and economic disruption, or environmental degradation. The impacts of natural hazards on human health are of particular concern. From heat stroke to cardiovascular and respiratory diseases, including psychological and social impacts, the health impacts of natural hazards can be serious and depend on complex processes involving individual, social, economic, and environmental factors. Canada has seen many examples of severe impacts from these hazards on the health and safety of the population in the last few years (e.g., heatwave and drought in British Columbia, Fort McMurray fires in Alberta, heatwaves and floods of 2018 in Ontario and Quebec, storms in the Maritime provinces). As climate change accelerates, these impacts on populations will increase unless effective adaptation measures are implemented to reduce them and to protect populations most at risk of being affected. Examples of these adaptation measures specific to each hazard already exist, and should be vigorously implemented by civil society, municipalities, health authorities, provinces, and the federal government.
Key Messages
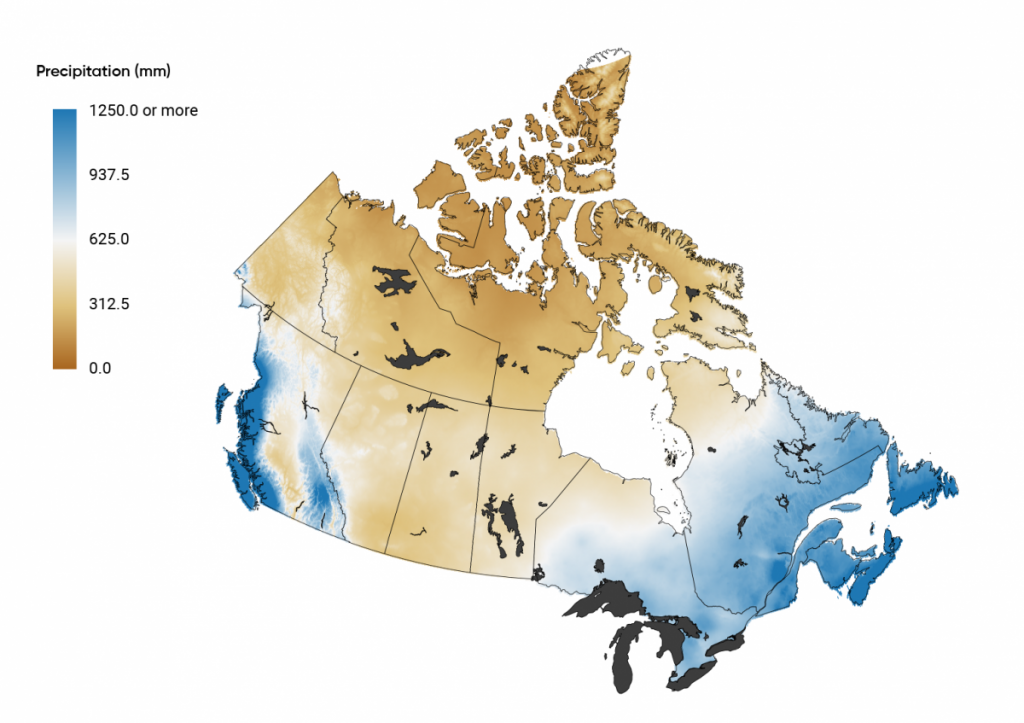
Many extreme weather events, and their health impacts on Canadians, are expected to increase in the coming decades, driven by the widespread warming. For example, extreme heat will become more frequent and more intense. This will increase the severity of heatwaves, and contribute to increased drought and wildfire risks. For most of Canada, precipitation is projected to increase, on average, although summer rainfall may decrease in some areas. Urban flood risks will increase due to more intense rainfalls (Canada’s Changing Climate Report, 2019).
Deaths in Canada are projected to increase significantly by the end of the century due to the effects of rising temperatures (and extreme heat) if greenhouse gas (GHG) emissions continue to rise at the same rate seen over the past 30 years. Added to this are potential health effects of the changing pattern of some extreme weather events (e. g., wildfires, droughts, heatwaves, extreme precipitation) such as an increase in accidental injuries, anxiety and depression, water-borne diseases, cardiovascular problems, and respiratory illnesses. Workers directly exposed to those extreme events are already experiencing an increased burden of illness and injuries.
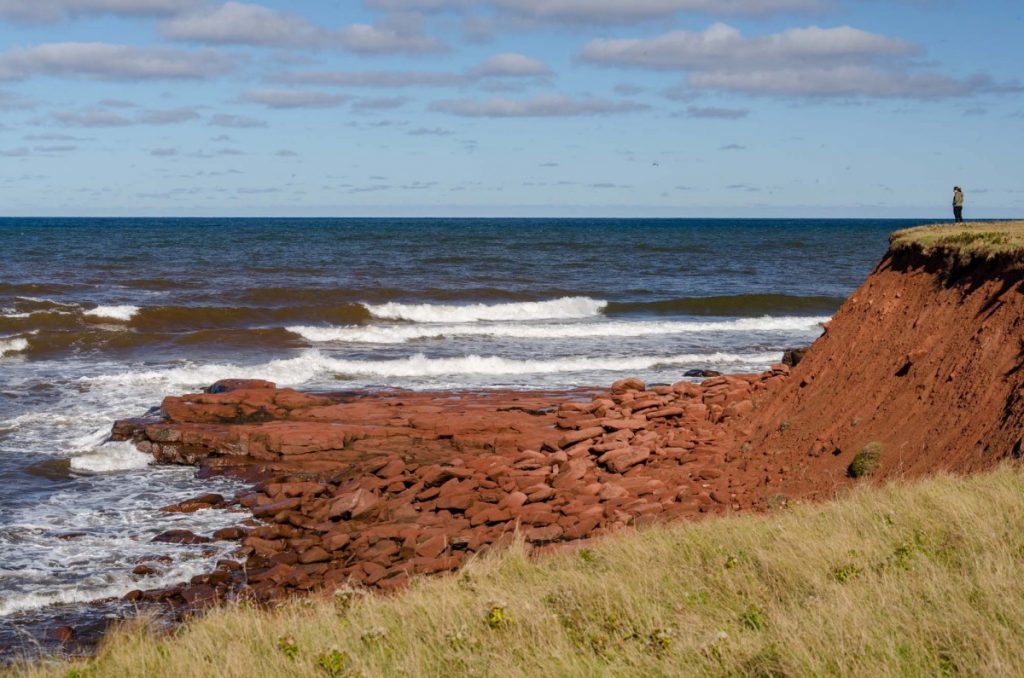
Coastal regions face a multitude of increased risks to communities. Coastal flooding is expected to increase in many areas of Canada due to local sea level rise. The loss of sea ice in the Arctic, Eastern Quebec, and Atlantic Canada further increases the risk of damage to coastal infrastructure and ecosystems as a result of larger storm surges and waves (Canada’s Changing Climate Report, 2019).
Some populations in urban and rural areas have limited access to the financial, social, health, and human resources needed to adapt to natural hazards influenced by climate change. Many First Nations, Inuit, and Métis communities experience a greater existing burden of health inequities and related determinants of poor health. This, combined with their close reliance on the environment for their sustenance, livelihoods, and cultural practices means they are uniquely sensitive to the impacts of climate change, including from natural hazards.
Seniors are particularly at risk of suffering from the health impacts of climate change related events, such as heatwaves, cold snaps, drought, wildfire smoke, and floods. Age and chronic diseases are the main factors of vulnerability, and the fact that our society is aging rapidly will increase this risk in the next few decades. Seniors’ vulnerability can be compounded by loss of community cohesion, socio-economic inequality, and unhealthy behaviours.
Provinces, municipalities, civil society, health authorities, and the federal government all have a key role to play in adapting to climate change. Despite progress on many efforts, adaptation measures are still lacking, especially for droughts, storms, and heavy precipitation. Moreover, populations at increased risk, and the preventable conditions that increase those risks, are often neglected by stakeholders when implementing adaptation measures.
Many solutions that can reduce human exposure and vulnerability to natural hazards influenced by climate change are already known and should be better promoted. Those solutions include greening living environments, identifying at-risk areas, using early warning systems, improving access to resources, practicing integrated land-use planning, updating infrastructure, and raising public awareness.
The pace, nature, and extent of adaptation measures must increase rapidly and substantially to reduce the current and future health impacts in Canada, including climate-related evacuations and forced displacement.
Increase in direct heat-related illnesses (e.g., heat edema, heat rash, heat exhaustion, heat stroke) and deaths, especially for workers
Increase in respiratory disorders
Increase in cardiovascular disorders, especially for seniors and people with chronic diseases
Perinatal care complications (such as miscarriage, premature birth, congenital complications)
Increase emergency visits for mental health problems
Psychosocial impacts
Possible changed patterns of illness and death due to gradually warming temperatures (e.g., due to increased outdoor activity levels)
Impacts on health infrastructure
Impacts on health and social services
Potential decrease in cold-related morbidity and mortality
Increased risk of zoonotic infectious diseases directly transmitted from animals and arthropod vectors; and acquired by inhalation from environmental sources
Extreme weather events and natural hazards
More frequent, longer, and more violent thunderstorms, more severe hurricanes and other types of severe weather
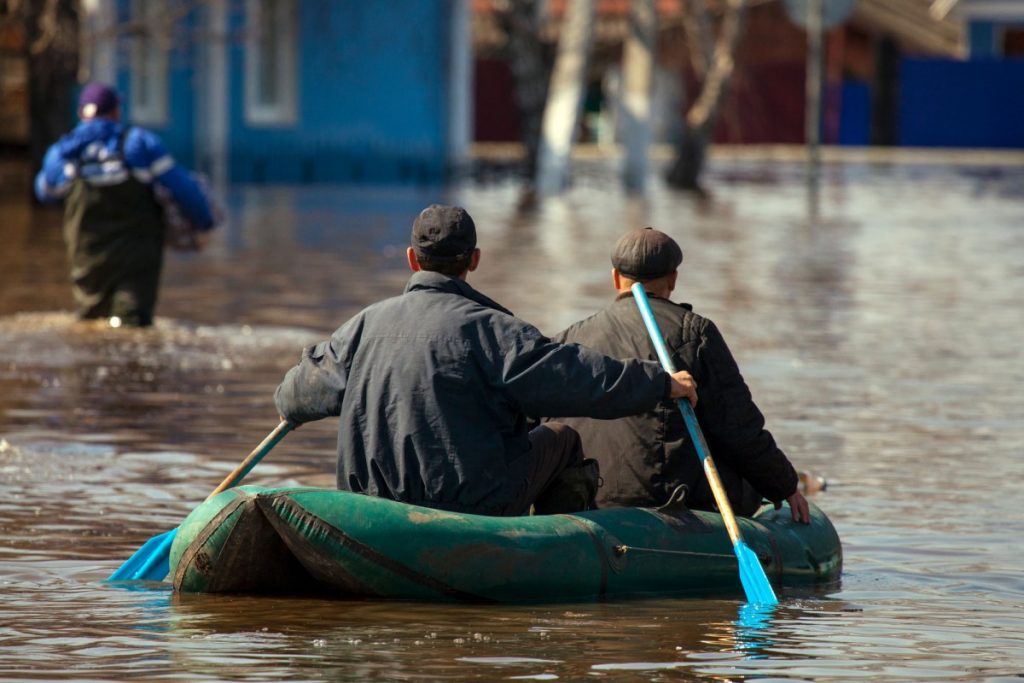
Increased extreme precipitations and related flooding events, except for spring flooding events which will decrease
Landslides and avalanches
Increased coastal flooding, coastal erosion, and storm surge episodes
Increased drought especially in the Prairies, Quebec, and Interior British Columbia
Increased damage to the natural and built environments
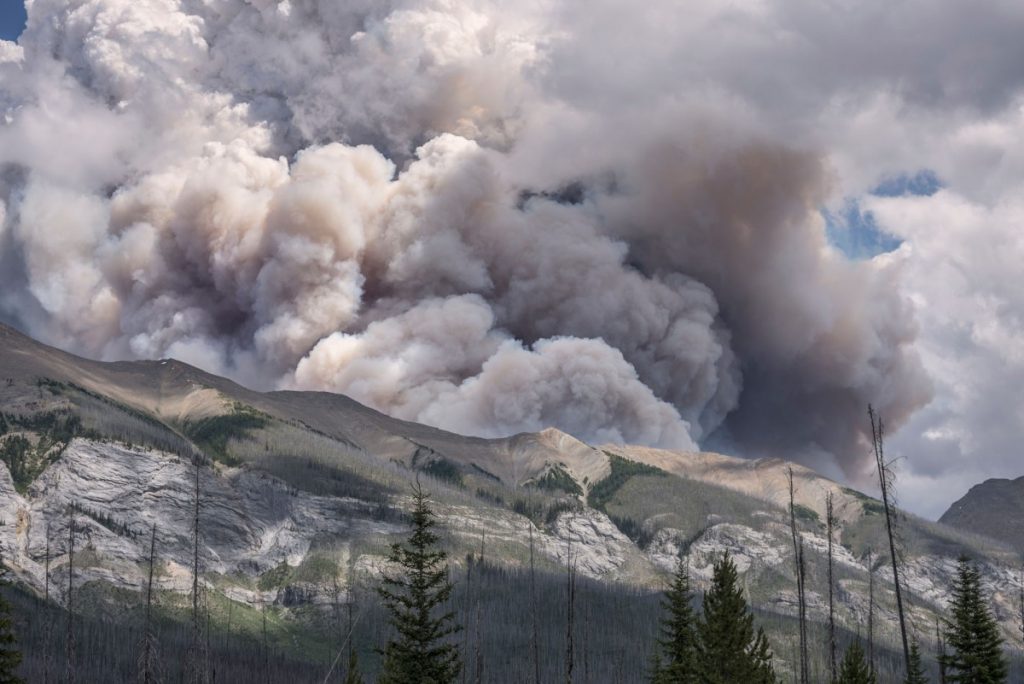
Increased frequency, severity, and area burned of wildfires
Combined or cascading climate-related hazards (such as heat, wildfires, drought, flooding)
Deaths, injuries and illnesses from violent storms, floods, and other hazards
Increase mortality and respiratory illnesses related to wildfire smoke
Psychological health effects, including mental health effects and stress-related illnesses due to extreme events (such as flood, wildfire, drought)
Physical and mental health impacts of food insecurity and/or water shortages
Illnesses related to drinking and recreational water contamination (mostly infectious)
Deaths, illnesses, and injuries due to evacuation or displacement of populations, and related pressures on civil protection, emergency shelters, and health infrastructure
Indirect health impacts from ecological changes, infrastructure damage, and interruptions in health services from extreme events
Exacerbation of chronic and infectious diseases and injuries due to infrastructure damage (such as to housing, water, sanitation, health facilities)
Poorer health outcomes due to restrictions on travel for health and emergency services, delayed supply of essential pharmaceuticals and medical supplies, and compromised patient safety
Epidemics of mosquito-borne diseases
3.1
Introduction
Share
Climate change is projected to increase the frequency, intensity, and overall consequences of many extreme weather conditions in Canada, even under a low emissions scenario (Bush & Lemmen, 2019). In this chapter, these conditions are referred to as natural hazards, although they are not entirely natural since they are influenced by several human factors, including greenhouse gas (GHG) emissions. A natural hazard is a phenomenon — often an extreme meteorological or hydrometeorological condition (e.g., heavy precipitation or extreme temperatures) — that is likely to cause loss of life, injury, property damage, social and economic disruption, or environmental degradation (Morin, 2008). Thus, natural hazards involve impacts on humans or on infrastructure communities rely on.
The impacts of natural hazards on human health are of particular concern. From heat strokes to cardiovascular and respiratory diseases, and psychological and social impacts, the health impacts of natural hazards are numerous and depend on complex processes involving individual, social, economic, and environmental factors. With growing recognition of these impacts, a significant number of research studies on such impacts have been carried out in Canada and abroad.
This chapter describes the state of knowledge on past and projected climate change on natural hazards, the links between those hazards and population health in Canada or similar countries (by demography, gross domestic product [GDP], climate), and key health vulnerabilities or risks. It also examines possible adaptation measures to these hazards to reduce their impact on the health of the population, based on published scientific studies. This chapter is therefore neither a descriptive nor exhaustive picture of the impacts experienced by communities in Canada, of the programs available to adapt, or of the measures put in place by decision makers. Only natural hazards influenced by climate change have been considered in this analysis.
3.2
Methods and Approach
Share
A review of scientific literature, published between 2008 and 2019, was conducted on knowledge related to natural hazards, health, and adaptation in developed countries with a temperate or polar climate, such as in Canada. To be included, a study had to demonstrate the relationships between health and a natural hazard influenced by climate change, for example, address vulnerability to a natural hazard or the effect of adaptation measures on these hazards and their potential to directly or indirectly minimize impacts on health.
The information in this chapter provides an update to previous Health Canada assessments from 2008 and 2014. Information on Canada’s changing climate and its changes in average conditions as well as changes in extremes (referred here as natural hazards) were obtained from the relevant chapters of Canada’s Changing Climate Report published by the Government of Canada (Bush & Lemmen, 2019). Other relevant studies were identified after the literature search phase and were included in the literature review. Grey literature was used to supplement existing scientific literature or to highlight relevant case studies. Studies conducted in Canada have been given priority, and studies from other similar countries (e.g., the Organisation for Economic Co-operation and Development [OECD]) were used when information specific to the Canadian context was lacking. Some were used for comparison with the Canadian context. Uncertainty in current data (e.g., unknown or little-known data) is taken into consideration by highlighting gaps in the scientific literature, limitations of some studies, or conflicting results. Research gaps and uncertainty in scientific evidence were also highlighted.
3.3
General Trends in the Intensity and Frequency of Natural Hazards Influenced by Climate Change, and Links to Health
Share
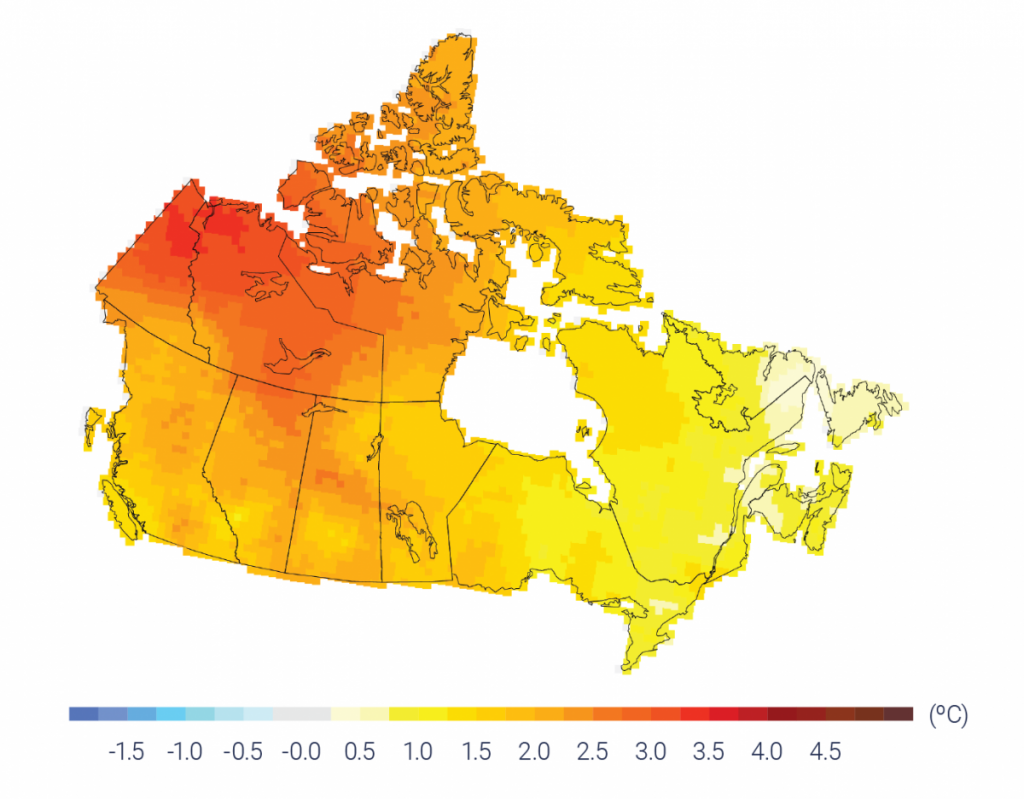
As concluded in Canada’s Changing Climate Report (Bush & Lemmen, 2019), warming of the Earth during the Industrial Era is unequivocal, and it is extremely likely that human activities, especially emissions of greenhouse gases (GHGs), have been the main cause of this warming since the middle of the 20th century. This global-scale warming has also been accompanied by increases in extreme heat and decreases in cold extremes, increases in atmospheric water vapour, warming of the ocean, and decreases in snow and ice cover. Global mean sea level has risen due to the expansion of ocean water caused by warming and by the addition of meltwater previously stored in glaciers and ice sheets on land. These global changes driven by warming of the climate system affect Canada (Figure 3.1).
Observed changes (°C) in annual temperature across Canada between 1948 and 2016, based on linear trends.
Source
Zhang et al., 2019.
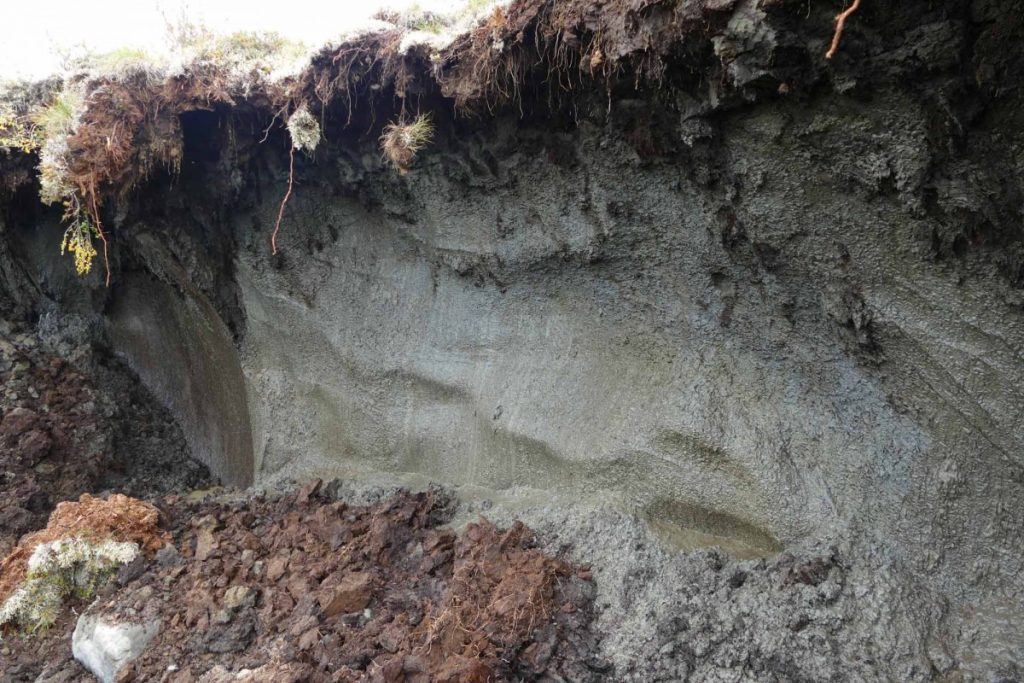
This widespread warming drives changes to, including increases in, many natural hazards: extreme heat, extreme precipitation and storms, drought, wildfires, flood risk, landslides, avalanches, and permafrost melt. These changes alter many ecosystems that then affect different populations. The climate and climatic events are determinants of health in many ways. They can affect the health of individuals directly (for example, through extreme heat or cold) or indirectly (by altering ecosystems which, in turn, lead to the emergence of new diseases), or by influencing other determinants including social determinants of health (e.g., loss of income during an extreme event) (Bélanger et al., 2019).
However, individuals and social groups do not have the same ability to adapt to climate change (Bélanger et al., 2019) and some populations are at greater risk of the direct, indirect or social effects. This risk is a concept built around three variables: the occurrence of a natural hazard, the actual exposure of populations, and pre-existing vulnerability, which includes sensitivity to impacts and the adaptive capacity of individuals, populations and communities. To address public health challenges related to climate change, research and response must focus on these three parameters: understanding and delineating future hazards, identifying at-risk groups, and understanding their adaptive capacity. The following sections provide information on the impact of these past and projected changes on the health and safety. Public health officials can use this information to develop or update needed policies and programs with partners to protect Canadians.
3.4
Average Warming and Extreme Heat Events
Share
3.4.1
Impacts of Climate Change on Heat — Trends and Projections
Share
3.4.1.1 Annual Average Temperatures
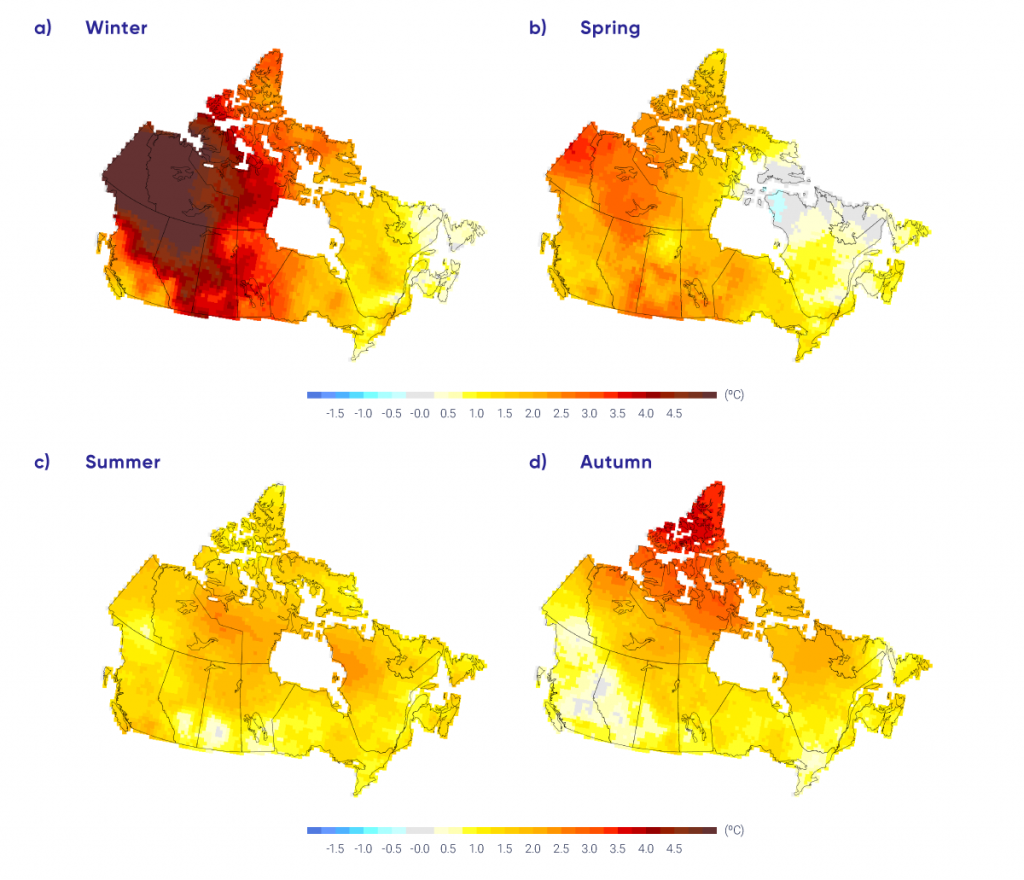
The consequences of climate change are essentially the result of an increase in global average temperatures. Canada is no exception, having experienced an increase in average temperatures of 1.7°C between 1948 and 2016 (Figure 3.1), about twice the average warming observed globally (Zhang et al., 2019). Canada’s Northern regions (Northern Canada) are particularly affected, with an average increase of 2.3°C — about three times the global rate of warming (Zhang et al., 2019). Average temperatures for Canada as a whole are projected to rise by 1.8°C, under a low emissions scenario, and by 6.3°C, under a high emissions scenario, for the end of century (2081–2100) compared to 1986–2005. As a result, average summer temperatures will rise across Canada, albeit with large variations depending on region and climate scenario (Jeong et al., 2016). Under a high emissions scenario (RCP 8.5), southern cities such as Fredericton, Quebec City, Calgary, and Victoria could see their average summer temperatures rise by 4°C to 5°C for the 2051–2080 period, compared to observed temperatures between 1976 and 2005 (Prairie Climate Centre, 2019). In all cases, Northern Canada will continue to warm faster than Southern Canada, particularly in winter (Figure 3.2).
Observed changes (°C) in seasonal mean temperatures from 1948 to 2016 for four seasons.
Source
Zhang et al., 2019.
3.4.1.2 Extreme Heat Events
There is no universal definition for extreme heat events (also sometimes referred to as heatwaves), and there is no consensus on terminology to describe hot weather (Gachon et al., 2016). The average increase in temperature also increases the frequency and duration of extreme heat events. Hot days with a maximum temperature above 30°C are rarely observed in regions north of 60° north latitude (Zhang et al., 2019). In Southern Canada, the number of hot days above 30°C increased annually by about one to three days over the period 1948–2016 at some stations, and is expected to increase there by up to 50 days annually by the late century under RCP8.5 (Zhang et al., 2019). Under this scenario, the annual median number of hot days is expected to vary from about 3 to 38 across Canada for the 2081–2100 period, with the Prairies and Ontario regions being more affected. As extreme hot temperatures will become more frequent and intense, it will increase the severity of extreme heat events (Zhang et al., 2019). The number of extreme heat events of at least three days above 32°C1 is likely to increase in regions of Southern Canada, where most Canadians live (Jeong et al., 2016). Some regions, such as the St. Lawrence Lowlands (in Quebec) and the Prairies, may experience two to three additional events per summer for the 2049–2070 period, compared to the 1970–1999 period (Jeong et al., 2016). The intensity and duration of these extreme heat events are also projected to increase (Sillmann et al., 2013).
3.4.2
Effects of Heat on Health
Share
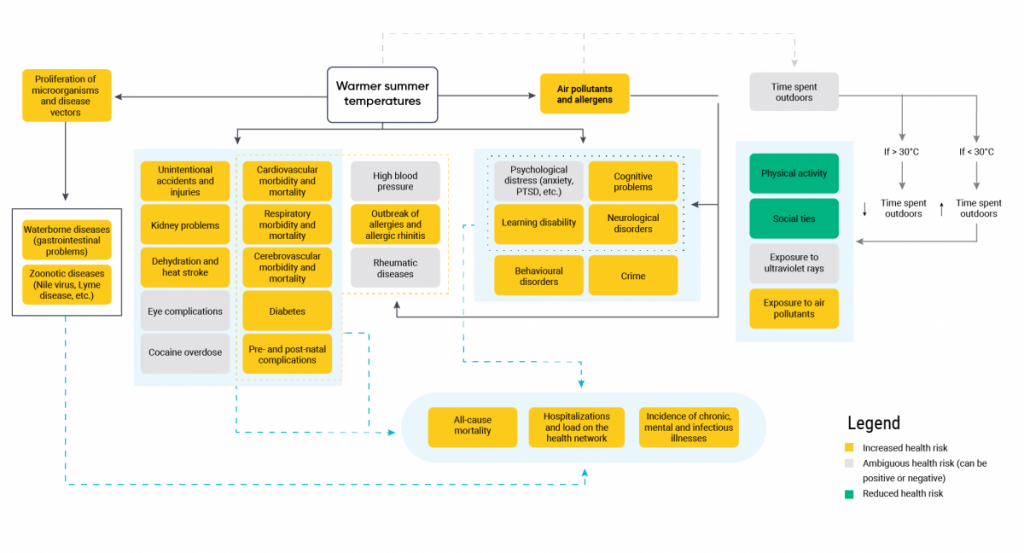
In Canada, the natural hazards with the best-documented health consequences are extreme heat events. Around the world, extreme heat is associated with increased all-cause mortality (Gasparrini et al., 2015; Xu et al., 2016) and an increased risk of hospitalization for cardiovascular and pulmonary disease (Basu et al., 2012; Turner et al., 2012b; Lavigne et al., 2014; Moghadamnia et al., 2017; Sun et al., 2018). The following subsections describe the observed or projected health impacts of extreme heat (Figure 3.3).
Conceptual framework showing the direct and indirect effects of extreme heat and increased temperatures on population health in Canada.
Figure 3.3
The orange boxes indicate that the health risk is increased, the green boxes indicate that the risk is reduced, while the grey boxes indicate that the direction of health effects based on current knowledge cannot be determined. Solid and dashed lines distinguish among clusters of impacts.
Source
David Demers-Bouffard, INSPQ.
3.4.2.1 All–Cause Mortality During Extreme Heat Events
Between 1986 and 2010, the average percentage of all-cause mortality attributed to extreme heat events in Canada was 0.53% (varying between 0.18% and 0.72% depending on the region) (Gasparrini et al., 2015). In 26 Canadian cities for which risk has been assessed, an extreme heat event appears to increase the risk of mortality by an average ranging from 2% to 13% (Guo et al., 2018). Another meta-analysis also found that the risk of mortality related to extreme heat events increases between 3% and 16%, depending on the definition of extreme heat event or heatwave used (Xu et al., 2016).
In British Columbia, 815 deaths could be attributed to extreme heat between 1986 and 2010. These deaths represent a 4% to 19% increase in the mortality rate the day after the event and a 2% to 19% increase within a week of the event (Henderson et al., 2013), depending on the city. An extreme heat event of nearly five days in Quebec in 2010 increased daily mortality by 33% in Greater Montréal and the rate of emergency department visits by 4% compared to similar periods (Bustinza et al., 2013). A very similar event at the end of the same summer had no measurable impact, which seems to indicate a physical and behavioural acclimatization to heat. Such impacts were also not detected during subsequent extreme heat events in Quebec from 2011 to 2015, except in the Montréal region (Lebel et al., 2017). It is essential to take into account night temperatures and the local environment to understand the impacts of heat on health. In British Columbia, a 5% increase in mortality was associated with forecast daytime temperatures of 29°C to 35°C and overnight temperatures of 14°C to 18°C, depending on the region (McLean et al., 2018). Humidity may have a significant effect on the relationship between heat and mortality, but the evidence is inconsistent in the literature (Barnett et al., 2010; Barreca, 2012; Xu et al., 2012; Parsons, 2014; Ho et al., 2016; Zeng et al., 2017).
3.4.2.2 Characterization of the Relationship Between Mortality and Heat
In general, mortality associated with an extreme heat event increases as intensity and duration increases, with intensity having a greater effect (Xu et al., 2016). For example, an extreme heat event in Quebec in the summer of 2018 caused 86 deaths, while 291 excess deaths were recorded during the 2010 extreme heat event (Lebel et al., 2019). Although the two events were similar in scope, duration, and timing, the 2010 extreme heat event was more intense. Worldwide, heat-related mortality tends to decrease with warming global temperatures independently of the level of air conditioning use, indicating that people can become less susceptible to heat as a result of physical acclimatization, behavioural changes, and the implementation of structural adaptation measures (Arbuthnott et al., 2016) (see Chapter 10: Adaptation and Health System Resilience).
3.4.2.3 Mortality Related to Climate Projections
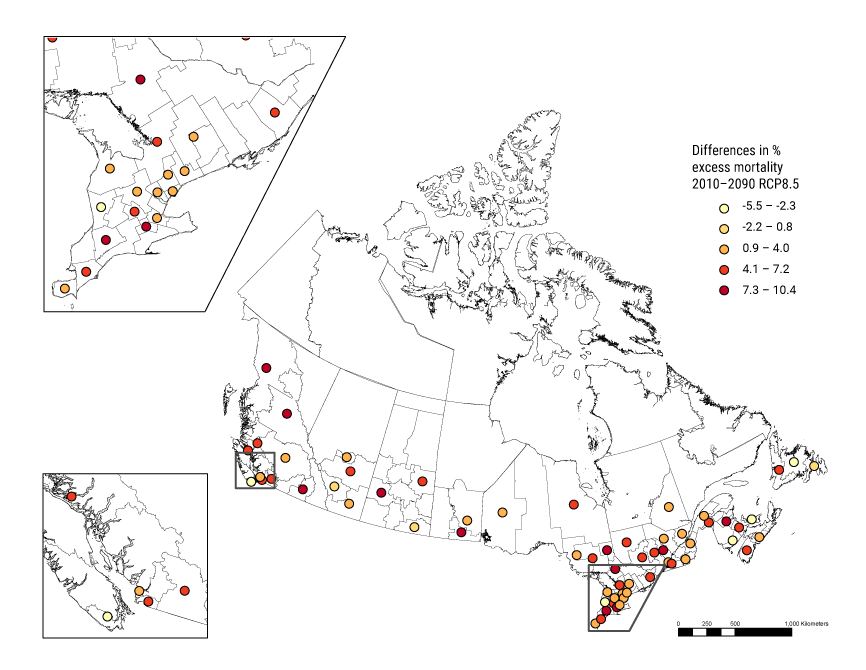
As noted above, as climate warming continues, in addition to increases in average annual and seasonal temperatures, the intensity and frequency of extreme heat events will increase, as well as their impact on mortality in the absence of further adaptations. Compared to 1971–2020, mean excess mortality2 in 2031–2080 related to extreme heat events across Canada is expected to increase from 155% to 390%, depending on the GHG emission scenario (RCP2.6 for the lowest estimate and RCP8.5 for the highest). With high population growth in the future, these percentages range from 188% to 455% (Guo et al., 2018).
3.4.2.4 All-Cause and Cardiovascular Disease Hospitalizations
In Ontario, the hottest days (99th percentile) between 1986 and 2013 showed a 6% increase in hospitalizations for cardiovascular disease compared to optimal temperatures, which showed the lowest mortality rate (Bai et al., 2017). For this period, an estimated 1.2% of overall hospitalizations for cardiovascular disease can be attributed to heat, with the majority of these admissions being related to moderate rather than extreme heat. In Toronto specifically, the number of heat-related ambulance calls was 12.3% higher during extreme heat events in 2005, 2006, and 2010 than during the week before and after (Graham et al., 2016). Increases in potentially heat-related hospitalizations and emergency department visits were also observed during regional heatwaves in some Quebec regions between 2010 and 2015 (Lebel et al., 2017). The 2018 extreme heat event in Quebec increased the number of ambulance trips in all affected regions by 11% to 23%, with some also seeing an increase in emergency department visits and hospitalizations (Lebel et al., 2019). Physiological acclimatization to heat appears to play a role: between 1989 and 2006, Quebec hospitalizations for ischemic heart disease were higher among seniors in early summer and decreased as the season progressed (Bayentin et al., 2010).
3.4.2.5 Cardiovascular and Other Diseases
As described above, extreme heat events increase the risk of cardiovascular-related hospitalizations and excess deaths. In Ontario, for example, each 5°C increase in temperature during the summer from 1996 to 2010 was associated with a 2.5% increase in deaths, especially those related to cardiovascular disease (Chen et al., 2016). On the other hand, the duration of an extreme heat event also seems to play a role in the impact on cardiovascular disease. The association between cardiovascular disease and point days (one day) of extreme heat is more ambiguous than that associated with extreme heat events (Phung et al., 2016). In addition, various cardiovascular diseases do not appear to be similarly affected by heat (Phung et al., 2016). The effects of individual extreme-heat point days (one or two days) on cardiovascular mortality can generally persist to a week after the event, but not all studies agree (Huang et al., 2011; Martin et al., 2012; Ye et al., 2012; Huynen & Martens, 2015). In addition to these effects, extreme heat aggravates diabetes- and kidney-related complications (Hajat et al., 2017; Lim et al., 2018) as well as increases the risk of unintentional injury (accidents) (Kampe et al., 2016), renal colic (Ordon et al., 2016), retinal detachment (Auger et al., 2017f), and cocaine overdose (Auger et al., 2017a). In an Ontario study, however, heat did not appear to affect hospitalizations for high blood pressure or heart arrhythmia (Bai et al., 2016).
3.4.2.6 Perinatal Effects
Several perinatal complications are also associated with heat, such as premature birth and early delivery during exposure in the third trimester (Auger et al., 2014), miscarriage (Auger et al., 2017d), and congenital complications, such as heart or neural tube defects, from exposure in the first trimester (Auger et al., 2017b; Auger et al., 2017c).
3.4.2.7 Indirect Impacts from Lower Water and Air Quality
Heat also has indirect impacts on water and air quality (see Chapter 5: Air Quality and Chapter 7: Water Quality, Quantity, and Security). Among these impacts, it increases the risk of water-borne diseases in the population by promoting the proliferation of bacteria and cyanobacteria in freshwater sources (Funari et al., 2012; Sterk et al., 2013; Herrador et al., 2015; Chapra et al., 2017; Mayer-Jouanjean & Bleau, 2018). Increased temperatures also increase recreational water activities (e.g., swimming, kayaking, sailing, surfing), increasing the risk of skin (e.g., dermatitis) or gastrointestinal symptoms (Lévesque et al., 2014; Boyer et al., 2017; Askew & Bowker, 2018). A full review of health impacts related to the degradation of water quality or quantity in Canada is provided in Chapter 7: Water Quality, Quantity, and Security.
In terms of air quality, heat promotes the formation of air pollutants such as ozone, which are known to increase lung and cardiovascular disease morbidity and mortality (World Health Organization, 2013a; Beelen et al., 2014). A comprehensive review of health impacts related to the degradation of air quality due to climate change in Canada is available in Chapter 5: Air Quality.
3.4.2.8 Psychosocial Health
Hot temperatures also affect psychological and social health. Among their effects, high temperatures increase stress and people’s propensity for aggressive behaviour, as reflected in increased crime and violent crime rates observed in certain U.S. cities, particularly in deprived neighbourhoods; in 20% of these neighbourhoods, half of the increase in crime during specific periods has been attributed to high temperatures (Mares, 2013; Ranson, 2014). Extreme heat can also lead to isolation at home by discouraging outdoor activities such as sports and recreation (Zivin & Neidell, 2014), which can in turn reduce social interaction and physical activity. Isolation can also endanger the health of individuals who depend on their social network to cope with hazards, particularly seniors, minority groups, or low-income individuals (Bolitho & Miller, 2017; Williams et al., 2017).
Extreme heat also contributes to the development of psychological and behavioural problems. In Toronto, for example, the highest temperatures (99th percentile) between 2002 and 2010 corresponded with a 29% increase in emergency department visits for schizophrenia, mood disorders, and neurotic disorders over a seven-day period compared to visits during average temperatures (Wang et al., 2014). A similar trend was seen in the southern region of Quebec (Vida et al., 2012), where in addition to heat, high humidity was associated with emergency department visits for mental health problems among those under 65 years of age.
In about 15 studies, high ambient temperatures were positively correlated with an increase in the suicide rate, with relative risk increasing by 1% to 37% on average for every 1°C increase in annual average temperature (Thompson et al., 2018). A meta-analysis covering 341 cities in 12 countries estimated that the highest risk of suicide was observed at an average temperature of 27°C (93rd percentile), but that each country was unique (Kim et al., 2019). In Canada, this maximum risk was observed at an average temperature 24°C, the 99th annual temperature percentile (Kim et al., 2019). The authors note that these analyses have limitations, and that further studies are needed. The exact cause of the increase in suicides on hot days is unknown.
The increased demand for social services and care in health care facilities due to the effects of heat increases the burden on these institutions, which may be challenged to meet these demands (Curtis et al., 2017). Increases in the health care demand related to heat also result in additional stress on social service and health care workers by increasing their workload (more clients); this stress can also increase the risk of reduced quality of care (Curtis et al., 2017). See also Chapter 4: Mental Health and Well-Being for an assessment of the impacts of climate change on mental health in Canada.
3.4.2.9 Beneficial Impacts
The increase in temperatures, apart from extreme events, may have some positive impacts. Extending the summer season and increasing the number of days conducive to outdoor activity could encourage people to be more physically active or participate in more social events (Baert et al., 2011; Witham et al., 2014; Remmers et al., 2017). However, this effect will be partially or fully offset by the deterrent effect of extreme heat; time spent on outdoor activities plateaus and decreases when temperatures exceed 30°C (Zivin & Neidell, 2014).
3.4.3
Populations at Increased Risk to Heat
Share
3.4.3.1 Seniors
Seniors (generally 65 years and over) are at higher risk of the health effects of heat compared to younger adults because of their diminished ability to adapt physically, the fact that they adopt fewer preventive behaviours, and their higher level of social isolation and dependence (Bélanger et al., 2015; Laverdière et al., 2015; Laverdière et al., 2016; Valois et al., 2017b). Pre-existing chronic diseases such as cardiovascular disease, high blood pressure, and diabetes, which are more prevalent in seniors, are also risk factors for heat-related impacts on seniors (Laverdière et al., 2015; Laverdière et al., 2016; Hajat et al., 2017). In addition, people aged 70 and older do not always see themselves as vulnerable, which may make them less predisposed to engage in preventive behaviours (Boeckmann & Rohn, 2014; Valois, et al., 2020b). As the population ages in Canada, it is expected that the extent of heat-related health impacts will increase, in the absence of further adaptations.
Risk factors, such as low socio-economic status, pre-existing conditions, use of medications, living in an urban heat island, social isolation, and loss of autonomy, can increase impacts from extreme heat. For example, seniors in southern Quebec (south of 49 degrees north latitude) with six or more of the above risk factors are eight times more likely to be admitted to emergency and seven times more likely to die or be hospitalized during extreme heat compared to those with no risk factors or only one (Laverdière et al., 2016).
The health risks for seniors also seem to be modulated by increasing temperatures or temperature variations between night and day. From 2006 to 2010, Quebec seniors were admitted to emergency departments and hospitalized 1.7 and 2.7 times more often on hot days, respectively, compared to normal summer days (Laverdière et al., 2016). According to meta-analyses, every one-degree increase in temperature increases all-cause mortality rates by 2% to 5%, cardiovascular illness rates by 3.4%, respiratory illness rates by 3.6%, and stroke rates by 1.4% on average among seniors, in addition to increasing the risk of diabetic, genito-urinary and infectious complications (Yu et al., 2012; Bunker et al., 2016). Variations in daytime temperatures also affect senior mortality, in part because of their decreased ability to adapt physically. A study examining impacts of heat on health in Montréal between 1984 and 2007 showed that a temperature change of 6°C to 11°C over 30 days increased daily mortality by 5% among seniors, and this increase reached 11% for a change of 11°C to 17.5°C (Vutcovici et al., 2014).
The majority of available studies do not compare seniors with other age groups; as a result, it is difficult to state with certainty that seniors are more affected. According to a meta-analysis comparing seniors to younger groups (15 to 64 years), the risk of heat-related death is only 2% higher for seniors (Benmarhnia et al., 2015). Other research indicates that people under 65 years of age are sometimes the most affected, as they spend more time outdoors (Alberini et al., 2011; Song et al., 2017). As a result, although older adults’ sensitivity to heat tends to increase with age, exposure may decrease. In Vancouver, for example, persons aged 65 to 74 had a higher risk of death than those aged 85 and over during the hottest week of 2009; the risk was highest for persons not living in institutions (senior residences, hospitals, clinics, etc.) (Kosatsky et al., 2012). Other vulnerability co-factors (e.g., chronic diseases) sometimes associated with seniors are discussed in the following sections.
3.4.3.2 Children
Children are at an increased risk of extreme heat impacts due to their limited ability to acclimatize physically and to respond appropriately to stress. For example, the rate of temperature-related physical trauma visits and fractures is higher in children than in adults (Ali & Willett, 2015). Also, the incidence of kidney problems, fever, electrolyte imbalance, and respiratory diseases (e.g., asthma) in children increases significantly during extreme heat events (Xu et al., 2014b).
In regard to mortality, a systematic review of extreme heat events found that the existing literature is inconclusive about the relationships between child mortality and extreme heat events (Xu et al., 2014b). Although infant mortality associated with extreme heat events is low overall, it increases as age decreases, with children under the age of one being the most vulnerable, compared to children aged up to four years and aged five to 14 years (Xu et al., 2012). In Quebec, temperatures above 29°C were associated with almost three times the risk of sudden infant death (Auger et al., 2015). Finally, children living in urban areas are at increased risk of extreme heat event impacts, owing to increased exposure in urban heat islands and higher concentrations of air pollutants in cities (Vanos, 2015).
3.4.3.3 Sex and Gender
Men appear to be more at risk from the impacts of heat, but the causes are not well characterized. Quebec men aged 45 to 64 had a higher risk of hospitalization due to ischemic heart disease during extreme heat events from 1989 to 2006 (Bayentin et al., 2010). In addition, men between the ages of 40 and 69 also appear to be at greater risk of developing renal colic in extreme heat (Ordon et al., 2016). The current proposed hypothesis is that men are more likely to be employed in occupations with higher risks of exposure. In heat, there is an increased risk of placental abruption in full-term pregnancies, which can be fatal to both the mother and fetus (He et al., 2018).
3.4.3.4 Chronic Diseases
People with certain pre-existing diseases or reduced mobility are another population group vulnerable to the effects of heat. For example, in Fredericton, Winnipeg, Windsor, Regina, and Sarnia, people with cardiovascular or lung disease reported feeling ill more often during the previous extreme heat event (Alberini et al., 2011). In a study in Toronto, diabetes increased the likelihood of going to the emergency department or being admitted for a cardiovascular problem during heat events: other factors (high blood pressure, kidney problems, cancers, etc.) were also correlated, but were not significant (Lavigne et al., 2014). Respiratory diseases, and pre-existing cancer, have also been identified as comorbidity factors associated with going to or being admitted to emergency for a cardiovascular problem during heat events (Lavigne et al., 2014). Age can also influence the relationship between heat and comorbidity. In Quebec, people aged 65 and under in the most deprived neighbourhoods with at least two chronic diseases reported 4.2 times more heat-related health problems (Bélanger et al., 2014). Reporting of health problems was 5.6 times higher for people aged 65 and over. Between 2006 and 2010, seniors in Southern Quebec with significant disabilities (who require assistance to carry out daily activities) were 2.5 times more likely to be admitted to emergency and 2.7 times more likely to be physically affected by heat (Laverdière et al., 2016).
3.4.3.5 Medication Use or Substance Misuse
Medication can increase an individual’s risk of extreme heat impacts by accelerating dehydration and body heat production. Certain medications affecting the central nervous system (anticonvulsants, antidepressants, anticholinergics, and psychotropic drugs in general), diuretics, immunosuppressants, interferons, and some anticoagulants may increase the risk of hyperthermia (Health Canada, 2011; Bélanger et al., 2015).
Excessive drug or alcohol use can also make individuals more sensitive to the effects of heat. In England, people with substance misuse problems were at higher risk of dying at temperatures above the 93rd percentile of annual temperature distribution (Page et al., 2012). Similarly, increased risk of mortality was associated with cocaine use during extreme heat events in Montréal (Auger et al., 2017a).
3.4.3.6 Occupational Exposure
Outdoor workers in construction, agriculture, forestry, and similar work environments have higher exposure to heat and its health risks, although some indoor workplaces, such as industrial settings and restaurants, may also be conducive to hyperthermia. The risk of injury and illness or disease at work increases during extreme heat, while worker productivity decreases (Adam-Poupart et al., 2014; Acharya et al., 2018; Levi et al., 2018; Adam-Poupart et al., 2021). In Ontario, from 2004 to 2010, every degree above 22°C increased the median number of hospitalizations for heat-related occupational illnesses and diseases by 75% (Fortune et al., 2014). In the provinces of Quebec, Ontario, Manitoba, Saskatchewan, and Alberta from 2001 to 2016, each 1°C increase in the maximum daily summer temperature increased the number of daily heat-related illness claims (e.g. edema, syncope, exhaustion, sunstroke/heatstroke) from occupational health and safety compensation agencies by 28% to 51%, depending on the province and the meteorological heat indicator (Adam-Poupart et al., 2021). The claims for traumatic injuries (e.g., fractures, cuts, burns) also increase by 0.2% to 0.6% for each 1°C increase in summer temperature – where a 0.2% increase represents 64 additional traumatic injury claims by summer in Quebec, for example (Adam-Poupart et al., 2021). This risk of injuries is not influenced by the type of task (manual vs. non-manual tasks) (Adam-Poupart et al., 2015), but heat-related injuries are more frequent for men and younger workers (Adam-Poupart et al., 2021). Jobs requiring work outdoors, or in environments conducive to heat accumulation, place workers at higher risk of heat-related injuries (Adam-Poupart et al., 2015; Acharya et al., 2018; Varghese et al., 2018; Adam-Poupart et al., 2021).
3.4.3.7 Urban Heat Islands
Urban heat islands represent the observed temperature difference between urban and surrounding rural areas, as well as between areas of a given city — for example, between a park and an adjacent parking lot (intra-urban islands). These intra-urban heat islands are formed as a result of impervious surfaces and low albedo (solar reflectivity level) of urban spaces, combined with a low level of vegetation (Beaudoin & Gosselin, 2016). Albedo in cities like Toronto and Montreal hover around 0.2 on a scale of 1, indicating that the materials and colours used, such as dark roofs and asphalt, absorb a lot of heat during the day and release it at night (Touchaei & Akbari, 2015; Graham et al., 2016). These characteristics, combined with heat produced by motor vehicles, industry, appliances and air conditioning, raise the ambient temperature.
This results in higher rates of heat-related mortality in urban areas than in rural areas (Tan et al., 2010; Gabriel & Endlicher, 2011; Wouters et al., 2017). Although heat exposure is higher in urban centres, heat sensitivity in rural and remote communities may be higher (Liang & Kosatsky, 2020). Health consequences of heat exposure are therefore closely associated with the intensity gradient of intra-urban heat islands. In Montréal, for example, the mortality rate for respiratory diseases from 1990 to 2003 was higher in high-intensity heat islands than in cooler locations (difference of 6°C to 8°C), with rates being 1.4 to 14 times higher, depending on the intensity of the island as well as on ground-level ozone concentrations (Smargiassi et al., 2009). In addition, home property value was negatively associated with mortality: a higher value was generally representative of higher housing quality and better insulation, greater ventilation and air conditioning and possibly better health and, therefore, lower vulnerability. Urban heat islands also exacerbate health inequities. Individuals with low socio-economic status tend to live in neighbourhoods with high-intensity heat islands where the prevalence of greenspace is low, increasing their risk of heat exposure (Bélanger et al., 2014; Ngom et al., 2016).
3.4.3.8 Indigenous Populations
First Nations, Inuit, and Métis are particularly sensitive to the impacts of climate change, including the indirect impacts of rising temperatures on the environment and the direct and indirect impacts of extreme heat (see Chapter 2: Climate Change and Indigenous Peoples’ Health in Canada). Indigenous Peoples have close ties to the land, sea, animals, and natural resources that are being disrupted by climate change, particularly in Northern regions where many communities are located.
Despite the lack of extreme heat in Northern Canada, Arctic and sub-Arctic Indigenous Peoples are being affected by warming temperatures. Reduced and weakened sea ice, permafrost, and ground snow cover, for example, have a wide range of impacts such as increased risk of injury and an increase in the number of search-and-rescue operations, and impacts on transportation, hunting, the ability to access traditional/country foods, and loss of Indigenous knowledge (Durkalec et al., 2014; Clark et al., 2016a; Clark et al., 2016b) (see Chapter 2: Climate Change and Indigenous Peoples’ Health in Canada). Warmer temperatures could also increase the incidence of food-borne illnesses by promoting bacterial growth and toxin formation in food storage sites (Hedlund et al., 2014; Bruce et al., 2016) (see Chapter 8: Food Safety and Security). Inuit populations, who use natural conservation methods and consume raw meats, are primarily at risk. These consequences could lead to a decrease in traditional food consumption among Inuit, Métis, and First Nations peoples. Traditional food is generally more nutritious and utilized more for spiritual traditions, compared to store-bought or processed foods. Inuit are already experiencing impacts of warming on traditional foods which is affecting food security in many communities. Nearly half of the First Nations populations in Canada experience severe or moderate food insecurity (First Nations Information Governance Centre, 2018). As a result of warming temperatures, First Nations peoples may reduce the quantity or quality of consumed food.
3.4.3.9 Maternal and Social Deprivation
In addition to having more pre-existing illnesses, low-income individuals more often live in housing that is poorly insulated, poorly ventilated, and lacking air conditioning (Kosatsky et al., 2009; Bélanger et al., 2014; Bélanger et al., 2016). In Vancouver, the mortality rate in neighbourhoods with over 20% of residents living below the poverty line was 23% higher than other neighbourhoods during the 2009 extreme heat event (Kosatsky et al., 2012). However, a meta-analysis has indicated that the risk of heat-related death is not different between people living in areas considered deprived and those living in areas considered privileged (Benmarhnia et al., 2015). This finding was also observed in Quebec when comparing deprived to very deprived distribution areas and other distribution areas for the 2010 and 2011 extreme heat events (Lebel et al., 2015). While the impact of socio-economic status on deaths during hot periods is less established, the impact on medical or hospital visits is more obvious. In Quebec, people in the lowest income quintile were 20% more likely to see a doctor during extreme heat events because they were more affected by the health consequences of such events (Bélanger et al., 2014). From 2006 to 2010, seniors in southern Quebec with a household income under $20,000 were almost three times more likely to go to the emergency department, be hospitalized, or die from heat when temperatures exceeded 30°C (Laverdière et al., 2016).
3.4.3.10 People Experiencing Homelessness
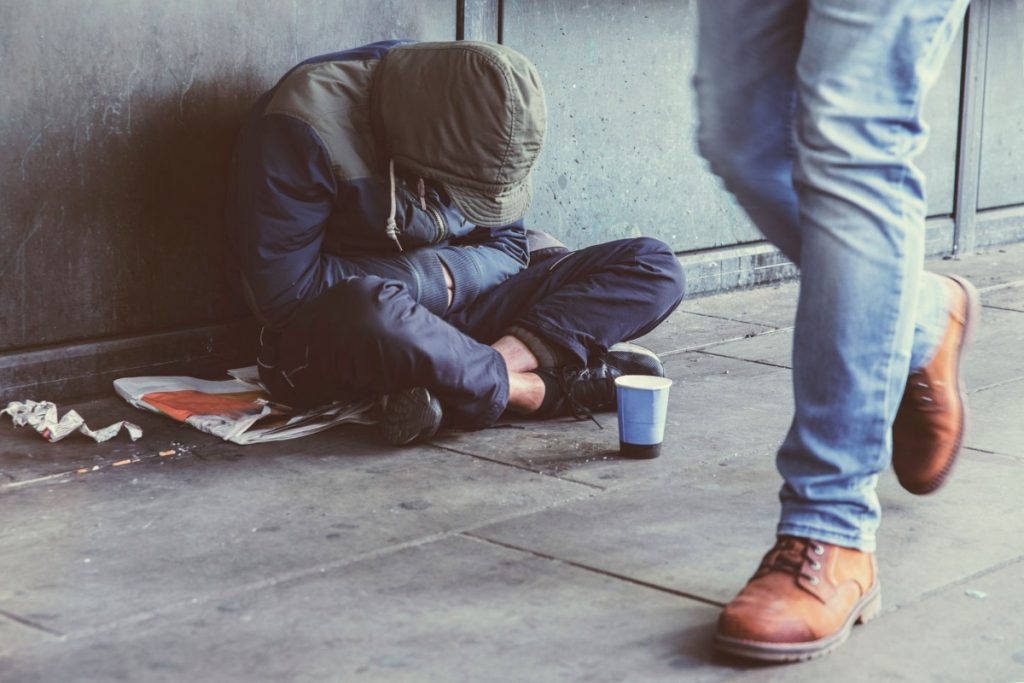
People experiencing homelessness are more affected by extreme heat, which exacerbates existing health problems or causes new ones (Ramin & Svoboda, 2009; Cusack et al., 2013; Pendrey et al., 2014). A large proportion of the people experiencing homelessness experience mental health and substance misuse issues, ranging from 23% to 67% by city (CICH, 2007). They also have a higher prevalence of chronic diseases. However, this population’s health conditions remain poorly documented in Canada (Mental Health Commission of Canada, 2014). Between 136,000 and 156,000 Canadians use emergency shelters each year (Advisory Committee on Homelessness, 2018).
3.4.3.11 Ethnicity and Race
The effects of heat on the health of racialized populations have not been studied in depth in Canada; relevant studies have mainly been conducted in the United States. For example, Black people were at a higher risk of being hospitalized during extreme heat events between 2001 and 2010 in the United States (Schmeltz et al., 2015). In most of 175 largest U.S. cities, racialized people have an average urban heat island exposure greater than non-Hispanic White people and people below the poverty line (in half of the cities), suggesting widespread inequalities in heat exposure by racialized people may not be well explained by differences in income alone (Hsu et al., 2021). However, the relationship between heat and mortality among racialized populations is rather complex, according to current literature, which indicates decreased, increased, or no effects across different groups (Gronlund, 2014).
For Indigenous Peoples, heat may cause significant health problems because of a number of compounding factors. Existing health inequality and inequities related to determinants of health among First Nations, Inuit, and Métis peoples increase their sensitivity to the health impacts of extreme heat. Indigenous populations generally have a higher prevalence of certain diseases, such as cardiovascular disease and diabetes (Chu et al., 2019; Hu et al., 2019), low income, and substandard housing, and all of these factors are associated with exacerbated effects of significant heat (Chief Public Health Officer of Canada, 2016). A disproportionate share of people experiencing homelessness in Canadian cities are Indigenous (Patrick, 2014) and, as highlighted above, homelessness is associated with higher risk of heat impacts on health.
3.4.4
Heat Adaptation Measures
Share
3.4.4.1 Individual Adaptation Measures
Air Conditioning
Air conditioning is often cited as a heat adaptation measure that should be prioritized. In buildings without air conditioning, indoor temperatures can reach 1.5 times the outside temperature (Lundgren Kownacki et al., 2019). In the United States, the risk of heat-related death is affected by temperature and the use of air conditioning (Nordio et al., 2015). The risk of heat stroke hospitalizations is also lower in counties with a higher prevalence of central air conditioning during an extreme heat event (Wang et al., 2016b). In the most deprived neighbourhoods of the largest Quebec cities, fewer people with indoor air conditioning reported experiencing adverse effects during extreme heat (Bélanger et al., 2015). Nevertheless, current literature in Canada and the United States also appears to indicate insignificant effects or no correlation between air conditioning and self-reported impacts of heat on health (Alberini et al., 2011; Bobb et al., 2014; Bélanger et al., 2015; Arbuthnott et al., 2016).
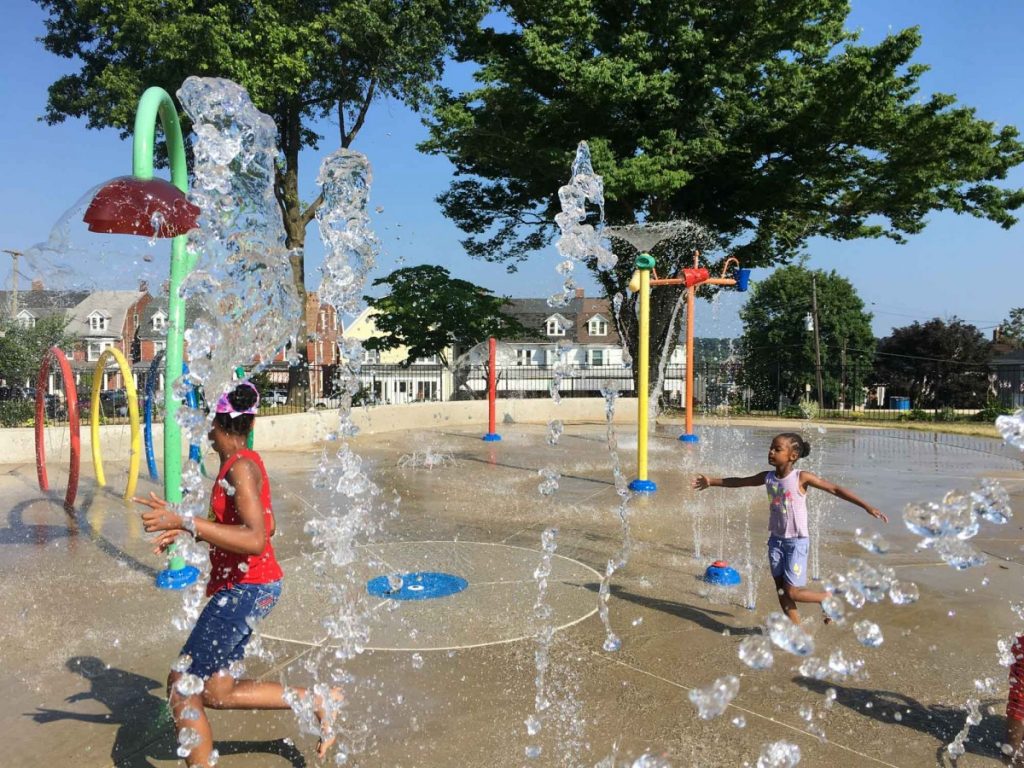
Widespread use of air conditioning can also increase outdoor temperature due to increased electricity demand and the release of hot air outside the home. Simulations in Paris and Houston showed that widespread air conditioning could lead to a 2°C increase in outdoor temperatures in dense urban environments (de Munck et al., 2013; Salamanca et al., 2014). For low-income individuals, prolonged use of air conditioning in the home can significantly increase their electricity bills, meaning they have to choose between paying electricity or other expenses like rent (Ng et al., 2015). Thus, access to or the use of air-conditioned or cooling-off areas (public swimming pools, water play areas, parks) may be preferable for this type of population. Last, moderate use of air conditioning combined with other measures (structural modifications to roofs and windows, use of reflective materials, greening of the home or neighbourhood) may limit the negative effects of air conditioning (Mavrogianni et al., 2012; Fisk, 2015; Raji et al., 2015). The effect on GHG emissions, based on the electricity source used, must also be considered, given the effects on climate change and air pollution, which could significantly increase in Canada (Berardi & Jafarpur, 2020).
Fans
Some studies report that fans are ineffective in reducing heat health impacts when temperatures are too high or when humidity is high. In Canada, however, using fans may be beneficial for individuals who are well hydrated given that observed temperature levels are often lower during extreme heat events than elsewhere in the world (around 31°C to 33°C) (Gupta et al., 2012; Jay et al., 2015; Ravanelli et al., 2015; Gagnon et al., 2016).
Behaviours and Lifestyle
Several other preventive measures can be adopted by individuals to reduce risks related to extreme heat, such as decreasing the use of certain electrical appliances (computer, dryer, oven, etc.), taking additional showers or baths, drinking more water, going out to cool places, and decreasing physical activity (Valois et al., 2017b). In Quebec, a heat adaptation index was developed with 18 adaptation measures associated with various variables, such as income, age, sex, and perception, to monitor these behaviours over time (Valois et al., 2017b). Perceptions of risk, control and personal vulnerability also influence individuals’ predisposition to adopt heat-prevention measures (Valois et al., 2020b). Whether people adopt preventive behaviours could explain the complex relationship between the risk of cardiovascular disease and occasional short-term exposure to extreme heat (Phung et al., 2016).
3.4.4.2 Public Health Adaptation Measures
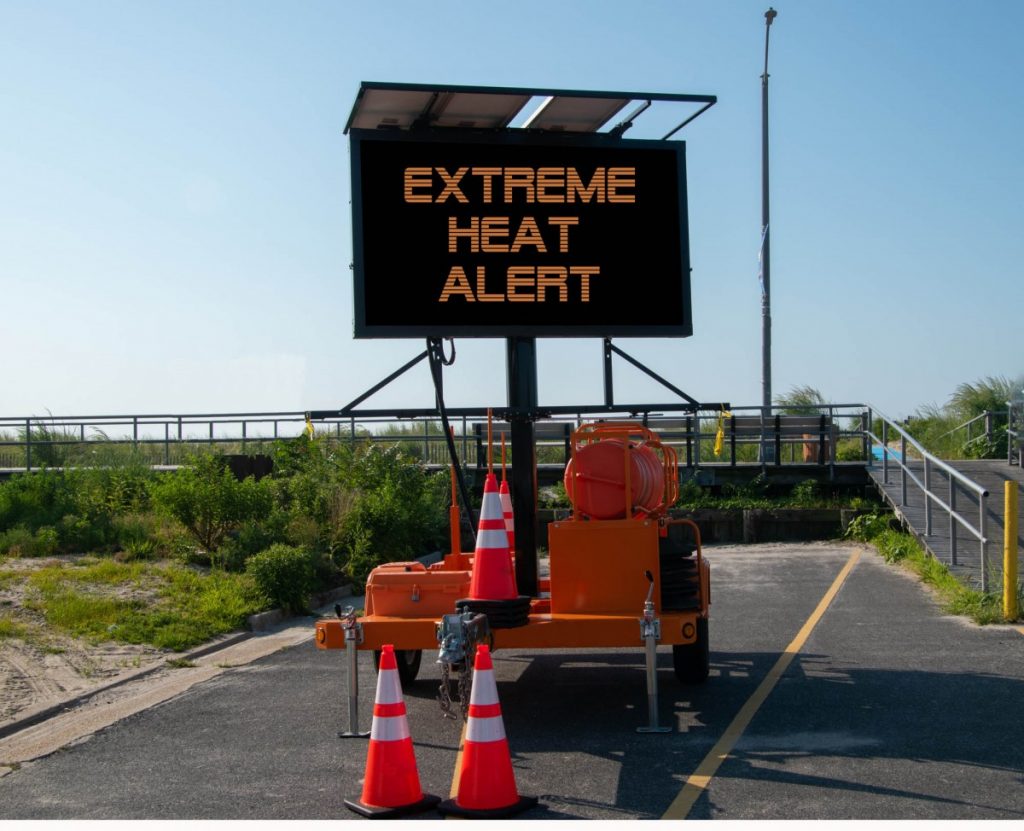
Heat Warning Systems and Action Plans
Following deadly extreme heat events in recent decades, several governments around the world have developed heat (or extreme heat event) health action plans, usually coupled with weather and health watch and warning systems. Heat action plans and warning systems should be based on pre-determined weather thresholds at which severe health risks increase, to ensure optimal implementation. Various guides are available in Canada on this topic, including a guide on determining warning thresholds for extreme heat events that was developed to help health authorities, municipalities, and all other stakeholders implement warning systems (Gachon et al., 2016); a guide on best practices for implementing a warning system and an extreme heat response plan (Health Canada, 2012); and a set of guidelines on medications, risk factors, and symptoms related to extreme heat stress to help health care professionals respond appropriately to extreme heat (Health Canada, 2011).
In Quebec, a semi-real-time weather and health monitoring and early warning system called SUPREME has been implemented since 2010. This may partially explain the significant decrease in mortality observed between the 2010 and 2018 extreme heat events, in addition to action plans implemented since then (Toutant et al., 2011; Canuel et al., 2019; Lebel et al., 2019).
Public health alerts issued through a variety of media and mechanisms (e.g., smartphones, radio, television, social media, community associations) activated when the outside temperature reaches a certain threshold and indicating preventive measures to be taken before and during extreme heat, are a way to quickly reach and inform people at higher risk. Research suggests that this type of system can decrease mortality and the number of people transported by ambulance to health centres for care (Toloo et al., 2013; Boeckmann & Rohn, 2014). However, the challenge for these warning systems is reaching the most vulnerable people, such as those who are isolated and experiencing homelessness, or those without electronic or telephone communication methods. In the Montérégie region of Quebec, this type of system was designed for seniors or those with certain pre-existing conditions. It increased people’s intention to go to cool locations during an extreme heat event, or to stay inside among participants, who adopted measures to keep cool at home (Mehiriz & Gosselin, 2017; Mehiriz et al., 2018). Women participating in a study on the system consulted a health care provider half as often as those in a control group.
Action plans should also include provisions to support the most socially isolated individuals. For example, in Rome, the proportional increase in all-cause mortality among people aged 75 and above was 50% lower in neighbourhoods where a social outreach program had been implemented to improve social support for isolated and sick individuals (Liotta et al., 2018).
Occupational Health and Safety
The decrease in the number of claims during extreme heat events in Australia, Europe and the USA seems to indicate that adaptation measures that are mandatory at a certain threshold (e.g., longer rest periods, more worker turnover, and better monitoring of worker hydration or level of physical effort) are effective in decreasing the effects of heat on workers (Xiang et al., 2014; Varghese et al., 2018).
3.4.4.3 Infrastructural Adaptation Measures
Greening Neighbourhoods
Greening is an adaptation measure that can reduce the urban heat island effect (Giguère, 2012; Health Canada, 2020b). During extreme heat events in Toronto, the number of heat-related ambulance calls was five times higher in neighbourhoods with a tree canopy less than 5% compared to other neighbourhoods (Graham et al., 2016). This difference is 18 times higher compared to neighbourhoods with a tree canopy of over 70%. According to a simulation, a 10% increase in vegetation in the City of Toronto could cool daytime summer temperatures by 0.5°C to 0.8°C (Wang et al., 2015).
The benefits of vegetation can lead to a reduced mortality rate for people who live near greening projects and parks in general. A cohort study conducted over 11 years in 30 Canadian cities, with adjustments made for confounding variables found that increasing vegetation by one quartile in an area less than 500 metres from a residence decreased all-cause mortality related to diabetes and cardiovascular or respiratory systems by 8% to 12% (Crouse et al., 2017).
Material Reflectivity (Albedo)
Increasing cities’ ability to cool down in hot weather is optimized when greening urban environments is combined with installing coatings and using high-albedo3 materials (Health Canada, 2020b). In general, a 0.1 increase in albedo (solar reflectivity) can reduce ambient temperatures by approximately 1°C during extreme heat (Santamouris, 2014). In a simulation, increasing ground albedo by 0.2 to 0.4, roof albedo by 0.3 to 0.7, and increasing vegetation in the City of Toronto by 10% could decrease perceived summer daytime temperatures by 3.6°C to 4.6°C (Wang et al., 2015). In Montréal, increasing albedo from 0.2 to 0.65 would decrease annual temperatures by 0.2°C and reduce temperatures on hot days up to 4°C (Touchaei & Akbari, 2015). This impact on ambient temperature has a direct effect on health. In three U.S. metropolitan areas (Atlanta, Philadelphia, and Phoenix), substantial greening (at least 50% of urban area) or a significant increase in albedo (above 0.45) could reduce projected increases in heat-related mortality by 40% to 99% by 2050 (Stone et al., 2014). In California, widespread installation of reflective roofs could reduce the increase in heat exposure from climate change by 51% to 100% by 2050, depending on the emission scenario (Vahmani et al., 2019).
Built Environment, Urbanization, and Community Infrastructure
Urban design can also influence the health effects of extreme heat (Health Canada, 2020b). In Vancouver, the risk of death in dense areas (≥1,000 people per square kilometre) is 43% higher than in less dense areas (Kosatsky et al., 2012). This effect is mainly explained by the low prevalence of residential air conditioning and the higher deprivation level of these neighbourhoods. In contrast, in Massachusetts, the heat-related mortality risk between 1990 and 2008 was not associated with urbanization measures (Hattis et al., 2012). Although population density is associated with the urban heat island phenomenon, urban sprawl increases the area with less reflective surfaces (e.g., roads, sidewalks, rooftops) and decreases in overall vegetated areas. For example, U.S. cities with greater sprawl experienced a larger increase in extreme heat events between 1956 and 2005 (Stone et al., 2010). To reduce the potential for heat storage in communities and associated mortality, urban densification should be combined with measures involving greening as well as increasing shade cover and solar reflectivity (Stone et al., 2014).
The quality of housing can also affect risks to health from heat. Using reflective materials (e.g., white-roof membrane), improving the insulation and ventilation in housing (active or passive), particularly in dilapidated housing in deprived neighbourhoods, and adding solar protection to windows (shutters, curtains, etc.) can substantially reduce residents’ heat exposure In addition, these measures are cost-effective in the medium and long term in terms of energy consumption (Mavrogianni et al., 2012; Porritt et al., 2012; Bélanger et al., 2014; Ngom et al., 2016).
3.5
Exposure to Ultraviolet Radiation
Share
3.5.1
Impacts of Climate Change on Ultraviolet Light — Trends and Projections
Share
The level and intensity of ultraviolet radiation that is reaching the surface of the earth in a particular location is influenced by numerous factors, such as the time of the day, the season, ozone layer thickness, type of cloud cover, snow reflection, altitude, and latitude. Therefore, projections of ultraviolet radiation in future climate scenarios come with several uncertainties. The Montréal Protocol ozone-depleting substances international agreement was effective in protecting the stratospheric ozone layer4 and preventing global-scale increases in solar ultraviolet radiation (Neale et al., 2021). However, in “the Arctic, springtime episodes of stratospheric ozone depletion, identified first in the early 2010s, continue to occur. The last episode in the spring of 2020 led to the largest ozone loss measured to date and resulted in UV indices that were twice as high as typical at several Arctic locations,” such as in Northern Canada (Neale et al., 2021, p. 3). Outside the Arctic region, small changes in UV radiation trends over the last 20 years were mainly influenced by clouds, aerosols, and surface reflectivity (Neale et al., 2021).
The potential impacts of climate change on stratospheric ozone levels are complex and uncertain. With climate change, changes in stratospheric ozone and cloud cover could lead to a decrease in ambient ultraviolet (UV) radiation, particularly at Northern latitudes. Cloud cover is projected to increase north of 50 degrees north latitude and consequently decrease UV radiation reaching the Earth’s surface (Bais et al., 2015). Solar reflectance at ground level and concentrations of aerosols and nitrogen oxides also affect UV radiation reaching humans. In Northern Canada, warming temperatures will decrease solar reflectance at ground level and UV radiation by reducing snow and ice cover (Bais et al., 2015; Bais et al., 2018).
South of 50 degrees north latitude, which is where the vast majority of Canadians live, cloud cover is expected to decrease, mainly resulting from an increase in GHG concentrations (Neale et al., 2021). In addition, at mid-latitudes (Southern Canada), increased GHG emissions are expected to stimulate ozone formation in the mid- and upper stratosphere (Bais et al., 2015), decreasing lower-atmosphere UV rays. The projected reduction in anthropogenic concentrations of certain air pollutants and aerosols could, by contrast, increase the intensity of UV rays, given that they are currently partially blocked by these pollutants. In addition, risky behaviours related to sun exposure, such as increased time spent outdoors and wearing clothing with little sun protection, tend to increase as temperatures rise (Zivin & Neidell, 2014; Pinault & Fioletov, 2017). The net effect of all these factors on the intensity and level of future UV exposure, and resulting health risks to Canadians, is therefore difficult to determine.
3.5.2
Effects of Ultraviolet Radiation on Health
Share
3.5.2.1 Skin Cancer
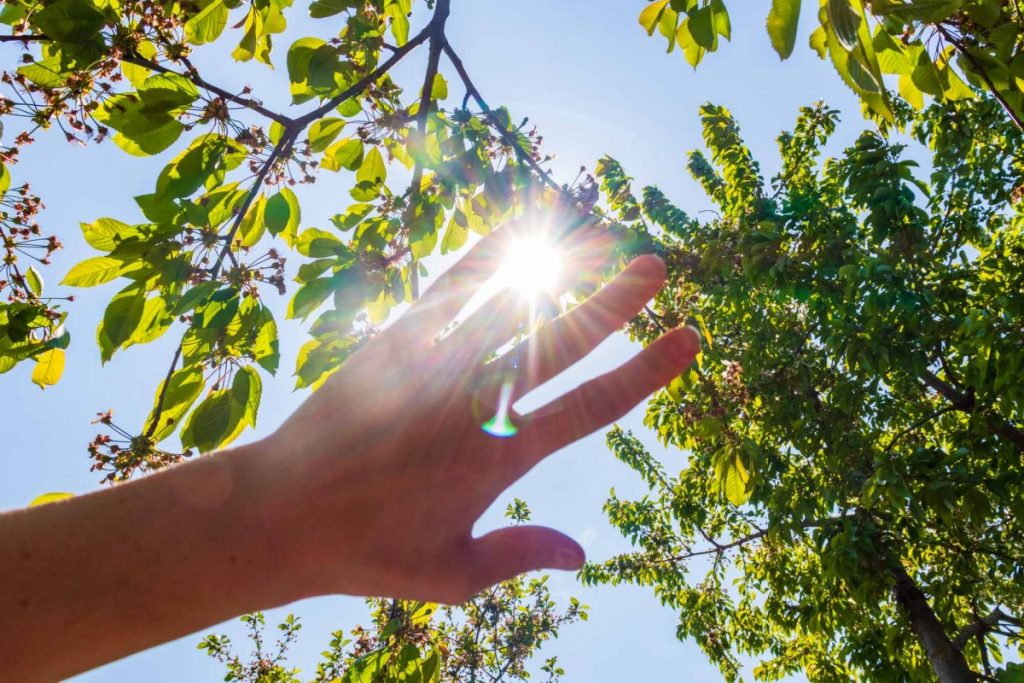
Overexposure to UV radiation is the leading cause of skin cancer. The World Health Organization has classified UV radiation as a Group 1 carcinogen — sufficient scientific evidence of cancer in humans (International Agency for Research on Cancer, 1992). The risk of developing malignant melanoma, the deadliest form of skin cancer, has been associated with exposure to ambient UV radiation in several countries including Canada (Watson et al., 2016; Pinault et al., 2017). Sunburns in children may increase the risk of melanoma later in life (Benedetti, 2019). UV exposure and the incidence of skin cancers are worsening as temperatures increase (Freedman et al., 2015; Kimeswenger et al., 2016; Kaffenberger et al., 2017). For example, a 2°C increase was estimated to increase the number of skin cancers by 10% annually (van der Leun et al., 2008; Kaffenberger et al., 2017). Although the incidence of melanoma in the last decade (2005–2015) has increased in many countries including Canada, a model indicates that if the Montréal Protocol would be fully implemented, about 430 million cases of keratinocyte cancer and 11 million cases of melanoma would be prevented just in the U.S., for people born between 1890 and 2100 (Neale et al., 2021).
3.5.2.2 Cataracts and Eye Tumours
UVA radiation can lead to premature aging of the eye, in turn contributing to the development of cataracts (Yam & Kwok, 2014; Delic et al., 2017; Bais et al., 2018; Ivanov et al., 2018). Repeated exposure can also lead to the development of skin cancer cells around the eye, precancerous sclera growth, conjunctival cancer, and intraocular melanoma (Yam & Kwok, 2014; Bais et al., 2018; Ivanov et al., 2018).
3.5.2.3 Immunosuppression
Excessive UV exposure can promote immunosuppression, both in the skin and throughout the body. A weakened immune system limits the body’s ability to defend itself against bacteria, viruses, and serious diseases such as cancer (Hart & Norval, 2018). That said, immunomodulation by solar UV radiation may also be beneficial to certain individuals: it can reduce the incidence of autoimmune disease, such as multiple sclerosis, type 1 diabetes, chronic inflammatory bowel disease (e.g., Crohn’s disease), arthritis, and allergies (Sloka et al., 2008; Gorman et al., 2010; Lucas, 2010; Holmes et al., 2015; Lu et al., 2015; Lucas et al., 2015; Bais et al., 2018; Simpson et al., 2018).
3.5.2.4 Vitamin D and Blood Pressure
Despite its harmful effects, UV exposure from the sun is the most significant source of vitamin D in humans. Considerable scientific literature has documented the benefits of vitamin D in reducing bone problems such as rickets, osteomalacia, and osteoporosis (Ross et al., 2011; Wintermeyer et al., 2016). In 2009, 10% of the Canadian population had vitamin D deficiency, and 32% had sub-optimal blood levels for bone health, with these percentages increasing significantly during the winter months. (Vieth et al., 2001; Rucker et al., 2002; Janz & Pearson, 2013). Vitamin D may also promote cardiovascular health, and heart disease is the leading cause of death in Canada. Among its effects, exposure to solar UV rays releases nitric oxide into the skin, reducing blood pressure (Juzeniene & Moan, 2012; Halliday & Byrne, 2014; Liu et al., 2014). Assessments have suggested that 30-minute exposure to sunlight reduces blood pressure by 5 to 7 mm Hg and could therefore decrease the risk of heart attack by 34% (Cabrera et al., 2016; Weller, 2017). Other suggested benefits of an adequate blood vitamin D concentration include reducing the incidence of type 2 diabetes, obesity, metabolic syndromes, and cancers, although the causal process remains to be determined (Mitchell, 2011; Pludowski et al., 2013; Shore-Lorenti et al., 2014; Gorman et al., 2017; Bais et al., 2018).
3.5.3
Populations at Increased Risk to Ultraviolet Radiation
Share
Some subpopulations tend to be more exposed to UV rays or are less likely to protect themselves from the sun, while others may be under-exposed. In Canada, sunburns occurred more frequently from 2005 to 2014 among men, younger age groups, people who were not members of visible minority groups, people living in higher-income households, and employed individuals (Haider et al., 2007; Pinault & Fioletov, 2017). Outdoor workers often exceed recommended levels of UV exposure and are therefore at higher risk of developing skin cancer (Schmitt et al., 2011; Fartasch et al., 2012; Peters et al., 2012; Modenese et al., 2018).
Groups that may experience increased UV exposure are those with fair skin (e.g., Caucasian/White, with blond or red hair); conversely, individuals with dark skin who live in areas with low UV exposure are more likely to have a vitamin D deficiency (Jablonski & Chaplin, 2012; Correia et al., 2014). Travel to tropical climates, certain medications that make skin more sensitive, and the male sex were also factors for increased risk of UV exposure (Pinault & Fioletov, 2017; Pinault et al., 2017). The more fragile skin of young people was also a factor, especially when they play a lot outdoors without protection (The Ontario Sun Safety Working Group, 2010; Joshua, 2012). In addition, people who use certain medications or products that make skin sensitive to UV rays (such as antidepressants, antibiotics, diabetes medications, oral contraceptives, immunosuppressants, and some cosmetics) are more susceptible to photoallergic or phototoxic reactions (Monteiro et al., 2016).
3.5.4
Ultraviolet Adaptation Measures
Share
3.5.4.1 Individual Adaptation Measures
Behaviours and Lifestyle
Applying sunscreen is known to be effective in protecting the skin from UV radiation, and wearing sunglasses is effective in protecting the eyes. The shade provided by a hat, long clothing, and infrastructure would be more effective than sunscreen in preventing sunburn and reducing UV exposure (Linos et al., 2012). Several factors can influence the adoption of protective behaviours to reduce exposure to the sun. One of the main barriers is a lack of general knowledge about the risks of solar UV exposure and the appropriate application of sunscreen (Weinstein et al., 2001; Dadlani & Orlow, 2008; Bränström et al., 2010). Other barriers include the thermal discomfort associated with wearing sun-protective (long and thick) clothing in hot temperatures, a positive attitude towards tanning for esthetic reasons, the belief that sun protection results in vitamin D deficiency, the cost of purchasing sun screen, and the perceived ineffectiveness or toxicity of sunscreen (Saraiya et al., 2004; Dadlani & Orlow, 2008; Youl et al., 2009; Bränström et al., 2010; Burnett & Wang, 2011). In practice, most people do not apply enough sunscreen, or apply it unevenly or only to certain parts of their exposed body.
3.5.4.2 Public Adaptation Measures
Awareness
Awareness campaigns have been somewhat effective in encouraging sun protection behaviours, especially when they are widespread and accompanied by more structural changes, such as building shady areas, reducing outdoor time at schools, or distributing sunscreen (Sandhu et al., 2016). This combination of large-scale interventions is associated with a median 11% increase in sunscreen use (Sandhu et al., 2016). A number of governmental and private organizations in Canada promote this type of intervention (Health Canada, 2018). For example, the Sun Safety at Work Canada project aims to support the implementation of sun protection programs in the workplace in collaboration with employers and decision makers (Kramer et al., 2015).
Environmental Monitoring
In terms of monitoring, Environment and Climate Change Canada (ECCC) created the UV Index as a tool to inform Canadians of the harmful potential of UV radiation (Fioletov et al., 2010). In 2018, ECCC began developing a new UV Index forecasting system that would provide hourly and longer-term (four days or more) forecasts, as well as regional and continental maps of UV radiation levels (Tereszchuk et al., 2018). Melanoma monitoring is also conducted by several organizations in Canada, such as the Canadian Cancer Society and the Public Health Agency of Canada (Canadian Cancer Society, 2019; Government of Canada, 2020).
3.5.4.3 Infrastructural Adaptation Measures
Several physical factors can also affect the level of solar UV exposure, such as artificial (e.g., buildings) or natural (e.g., large trees) structures that provide shady areas. Sun protection, in combination with thermal comfort, should be considered in urban planning. Green spaces, for example, can both reduce UV exposure through the shade they provide and increase it by encouraging people nearby to spend more time outdoors (Astell-Burt et al., 2014; Na et al., 2014; Porcherie et al., 2018). The City of Toronto is the first jurisdiction in Canada to include a shade policy in its planning (Kapelos & Patterson, 2014; Holman et al., 2018). Structures that provide shade can also result in reduced vitamin D production by limiting UV exposure. The vitamin D blood levels of individuals living in very dense areas with tall buildings may be up to four times lower than those of people living in an unshaded area (McKinley et al., 2011; Wai et al., 2015).
3.6
Average Cold and Extreme Cold Events
Share
3.6.1
Impacts of Climate Change on Cold — Trends and Projections
Share
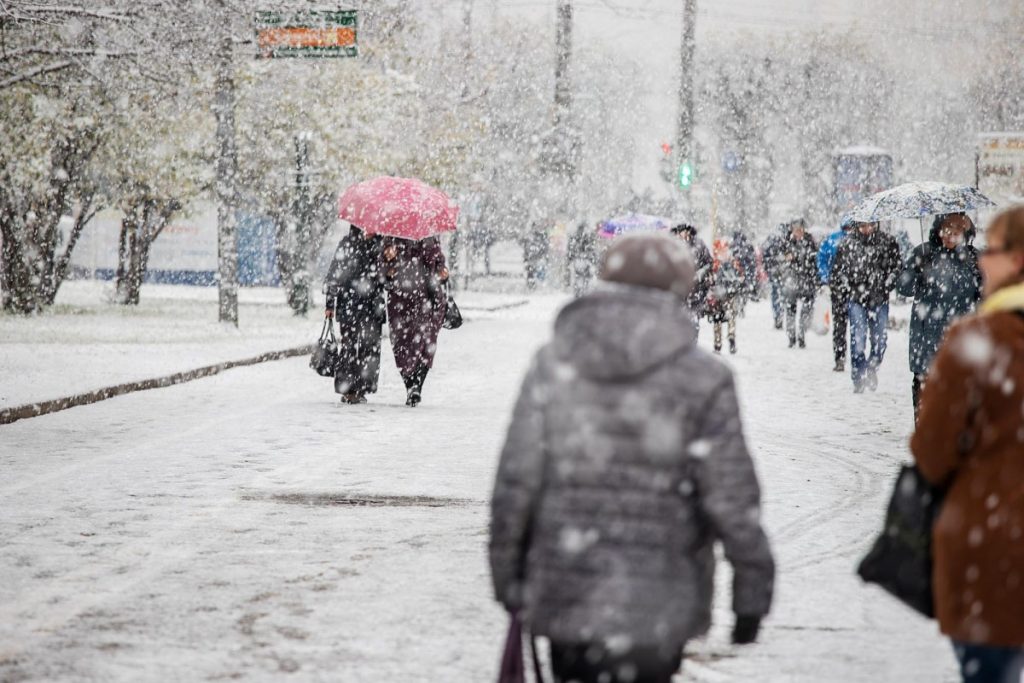
Over the past 70 to 100 years, the average winter temperature has increased and there have been fewer extreme cold days, a trend that will continue in the future (Zhang et al., 2019). Warmer temperatures will reduce the length of the cold season across Canada and the intensity and frequency of extreme cold (Zhang et al., 2019). Compared to 1976–2000, most projected decreases in the annual number of frost days (<0°C) under a moderate climate warming scenario (RCP4.5) fall between 25 and 40 days for 2051–2080 and may reach 50 days along the Pacific coast (Prairie Climate Centre, 2019). Under a high-emission scenario (RCP8.5), these reductions are more than 45 days per year in most cases. The reductions tend to be smaller in the Prairies region and more intense in British Columbia and the Maritime provinces.
Continuing the comparison between the 2051–2080 time horizon and the 1976–2000 period, simulations project a decrease in the number of extreme cold days (<−30°C) with climate change. While regions such as Southern Ontario, the Atlantic provinces, and the Pacific coast no longer reach those temperature levels, the Northern Prairies, Northern Ontario, and Northern Quebec are expected to see the number of extreme cold days reduced by 15 to 35 days per year under a high emissions scenario (RCP8.5) (Prairie Climate Centre, 2019). The number of cold days would be virtually reduced to zero in the St. Lawrence Valley and the Southern Prairies (Prairie Climate Centre, 2019). For example, extreme cold days are projected to drop from 52 to 14 in the Northwest (e.g., Yellowknife) and from 13 to two days in the Prairies (e.g., Saskatoon). Even if the reduction was less significant under less severe climate warming, few differences would be observed in Southern Canada.
Projections for the duration of cold spells also vary widely across Canada. Under a moderate emission scenario (RCP4.5), projections for the reduction in the total duration of cold spells range from a single day in Quebec to approximately five fewer days in Northern British Columbia and the Yukon for 2081–2100 (Sillmann et al., 2013). The results under the high emissions scenario (RCP8.5) are similar; the difference between the two scenarios is less than one day for most Canadian regions.
3.6.2
Effects of Cold Weather on Health
Share
Cold temperatures — whether they are extreme or not — are known to increase the risk of cardiovascular, respiratory, and stroke-related illness and mortality (Turner et al., 2012b; Gill et al., 2013; Phung et al., 2016; Ryti et al., 2016; Moghadamnia et al., 2017; Sun et al., 2018) as well as general mortality (Gasparrini et al., 2015; Liddell et al., 2016; Hajat, 2017; Song et al., 2017). The duration of individual cold exposure that lead to these health effects is not well known (Ryti et al., 2016); some effects can be seen up to two weeks following extreme cold, and some take even longer (Kinney et al., 2015; Liddell et al., 2016; Phung et al., 2016; Ryti et al., 2016). Humidity can also influence the effects of cold on health, as both extremes (low and high humidity) appear to exacerbate cold-related mortality and morbidity (Mäkinen et al., 2009; Barreca, 2012; Davis et al., 2016).
3.6.2.1 Mortality
According to a study conducted of 15 Canadian cities, the mortality risk associated with the minimum temperature in Vancouver, Ottawa, Edmonton, and Montréal for the time period 1981 to 2000 was between 19% and 72% higher than the optimal mortality temperature (Martin et al., 2012). In Ontario, each 5°C reduction in winter temperatures corresponded to an average 2.5% increase in fatalities from 1996 to 2010 (Chen et al., 2016). However, another study, using a 30-day lag period, found no relationship between cold temperatures and mortality in Montréal (Goldberg et al., 2011). In Quebec, all-cause mortality is not associated with average temperatures below 18°C, when seasonality and influenza are taken into account (Doyon et al., 2008). The percentage of all-cause deaths due to cold was calculated for 21 Canadian cities and ranged by city from 1.96% to 5.53% between 1986 and 2012 (Gasparrini et al., 2015).
3.6.2.2 Infections
Individuals also change their behaviour during extreme cold events, notably by increasing their time indoors. Cold temperatures thus coincide with the maximum incidence of influenza and respiratory infections such as pneumonia and bronchitis because they seem to promote the spread of such diseases (Mäkinen et al., 2009; World Health Organization, 2013b; Xu et al., 2014a; Bunker et al., 2016) (see Chapter 6: Infectious Diseases). Other infectious diseases can also be more easily transmitted in this way, although cold is also associated with a decrease in the spread of water-borne diseases, as observed in Arctic and sub-Arctic regions (Hedlund et al., 2014; Herrador et al., 2015; Bruce et al., 2016).
3.6.2.3 Hospitalizations and Emergency Department Visits
In a systematic review, the risk of hospitalization was found to increase on average by 2.8% for each degree the temperature decreased below optimal conditions (Phung et al., 2016). In Quebec, the coldest temperatures between 1989 and 2006 were associated with a maximum 12% increase in excess hospital visits for ischemic diseases in winter (Bayentin et al., 2010). There are also more emergency department visits for ischemic heart disease in Quebec in the early winter, and these decrease as the season progresses, indicating a physical and social acclimatization effect (Bayentin et al., 2010). However, cold does not appear to have any particular effect on kidney problems and mental health disorders (Wang et al., 2014; Lim et al., 2018). Furthermore, no relationship was found between extreme cold (first percentile) and emergency department visits for psychological or behavioural problems in Toronto (Wang et al., 2014).
3.6.2.4 Overall Impact on Health
Climate change is expected to have a net effect of mitigating some of the adverse health effects of the cold in Canada. Projections under an average global warming scenario for 15 Canadian cities indicated that the annual rate of deaths due to cold could decrease from three to 19 deaths per 100,000 inhabitants by 2079, compared to current rates, depending on the city (Martin et al., 2012). In addition, warmer winter temperatures encourage individuals to spend more time participating in outdoor activities, which promotes physical activity and social connections. This increased time spent outdoors could also reduce the risk of spreading infectious diseases such as colds, influenza, and lung infections (Mäkinen et al., 2009; Bunker et al., 2016). However, warmer winter temperatures may increase the number of fractures, given that temperatures near freezing and rainfall followed by a significant drop in temperature have been associated with a higher risk of falling, according to a study in Montréal (Morency et al., 2012). Since winter is often associated with increased smog and concentrations of fine particulate matter, this increase could also increase exposure to air pollutants (Jerrett et al., 2005).
3.6.3
Annual Cold and Heat Mortality Comparison
Share
Both globally and in Canada, deaths from cold winter temperatures currently outnumber deaths from heat in summer (Martin et al., 2012; Gasparrini et al., 2015). From 1985 to 2012, 4.5% of all-cause deaths in Canada could be attributed to cold, compared to only 0.5% attributed to heat (Gasparrini et al., 2015). For Canada as a whole, this increases to 6.2% (for cold) and 0.7% (for heat) for the 2010–2019 period (Gasparrini et al., 2017), partly due to the aging of the population. This effect was also observed in Ontario, where, during summer, every 5°C increase was associated with four excess daily deaths; during the winter, every 5°C decrease was associated with seven additional daily deaths (Chen et al., 2016). The effect of cold or heat is often calculated based on the percentiles of average temperatures in a year (fifth percentile and under or first percentile for cold; 95th percentile and over or 99th percentile for heat) to estimate the effect of extreme temperatures.
3.6.3.1 Geography
Unlike heat, which affects cities more because of the presence of urban heat islands, cold appears to have a greater impact in rural areas (Bayentin et al., 2010; Conlon et al., 2011). The effects of cold on health can be felt for weeks after an extreme cold event, while the same can be said for only a week after an extreme heat event (Turner et al., 2012b; Bunker et al., 2016; Ryti et al., 2016; Moghadamnia et al., 2017; Sun et al., 2018). For both heat and cold, daily, weekly, or monthly temperature changes coincide with increased mortality and events, especially cardiac and respiratory events (Lim et al., 2012; Cheng et al., 2014; Vutcovici et al., 2014; Vanasse et al., 2016b).
3.6.3.2 Mortality Projections Up to 2100
A few studies have examined the projected net effect of climate change in Canada on mortality associated with ambient temperatures. These studies suggest that the increase in heat-related mortality is expected to outpace the reduction in cold-related mortality in most, if not all regions. In Quebec, a net increase of 3% in annual mortality was projected for 2080 compared to 1981–1999 (Doyon et al., 2006; Doyon et al., 2008). Conversely, a study of 15 Canadian cities estimated that only four would see a net increase in mortality: London, Hamilton, Regina, and Montréal (Martin et al., 2012). Thus, the net impacts of temperature on excess mortality appear to vary across geographic regions. Temperature-related excess mortality between 2090 and 2099 in Canada is expected to increase compared to the 2010–2019 period under climate change scenarios RCP4.5, RCP6.0, and RCP8.5 (Gasparrini et al., 2017; Lavigne, 2020). Figure 3.4 shows the projected net mortality change across Canada for RCP8.5. Although in simulations some regions show improvements in mortality, the vast majority of health regions, both urban and rural, are expected to experience a net negative impact on health (Gasparrini et al., 2017; Lavigne, 2020). In these two studies, the percentage of all-cause deaths due to heat is lower than those due to cold, regardless of the scenario used.
Net mortality trends 2090–2099 compared to 2010–2019 under RCP 8.5, simulated across Canadian health administrative regions.
Figure 3.4
The map presents the net result of the combined changes in cold and heat mortality, mainly related to cardiovascular (+2.34% for the country) and respiratory (+7.82% for the country) disease.
Source
Lavigne, 2020.
3.6.4
Populations at Increased Risk to Cold
Share
3.6.4.1 Age, Sex, and Gender
Overall, seniors are at a higher risk of experiencing the effects of the cold (Ryti et al., 2016). A meta-analysis calculated that cardiovascular and respiratory mortality in people aged 65 and older increases by 1.7% and 2.9%, respectively, with a reduction of 1°C below optimal temperature (Bunker et al., 2016). On the other hand, some results in Canada indicate that people under 65 are more at risk than seniors. A study in Ontario found that each 5°C decrease in temperature between 1996 and 2010 increased the risk of dying from cardiovascular disease by 8% for those aged 65 and younger, and by 3% for those aged 65 years and older (Chen et al., 2016). Few studies have examined the effects of the cold on children’s health (Xu et al., 2012; Song et al., 2017).
A Quebec study corroborated these results and estimated that men under age 65, particularly those aged 45 to 64, are at higher risk than those aged 65 and older and were more likely to have or die from ischemic heart disease during periods of intense cold between 1989 and 2006 (Bayentin et al., 2010). This could be explained by the fact that men generally spend more time outdoors for work or snow removal. This increases their exposure to adverse weather conditions and requires increased cardiovascular effort (Ali & Willett, 2015; Auger et al., 2017e). In Ontario, each 1°C reduction below 0°C between 2004 and 2010 led to a median 15% increase in the median number of visits to the emergency department related to outdoor work (frostbite or hypothermia) (Fortune et al., 2014).
Pregnancy and perinatal periods are critical windows of exposure to cold negative impacts to health. Cold appears to increase the likelihood of adverse effects at birth or during pregnancy, such as eclampsia, low birth weight, and premature birth (Strand et al., 2011; Poursafa et al., 2015).
3.6.4.2 Chronic Diseases
Some pre-existing diseases may also make people more susceptible to the effects of the cold. In Quebec, one study suggested that regions with higher smoking rates among those 45 to 64 years old have higher rates of hospitalization for ischemic heart disease in winter (Bayentin et al., 2010). This increase was also observed among smokers and alcohol drinkers in the United Kingdom (Sartini et al., 2016). In Toronto, people with pre-existing kidney or cardiac conditions had a higher probability of being admitted to the emergency department for cardiovascular reasons in extreme cold compared to those without this type of problem (Lavigne et al., 2014). This was observed in China among those with pre-existing respiratory diseases (Wang et al., 2016a). The impact of pre-existing morbidity on susceptibility to cold is also age-dependent.
3.6.4.3 Material and Social Deprivation
The impacts of cold on individuals with low socio-economic status has not been studied extensively. In Quebec, the effects of cold on emergency department visits for ischemic heart disease are most significant in areas of low socio-economic status (Bayentin et al., 2010). In Portugal, low socio-economic status has been associated with winter mortality, with the relative risk being 1.75 times higher among those with low socio-economic status compared to those with high socio-economic status (Almendra et al., 2017). Winter heating costs can lead low-income and even middle-class individuals to turn down the heat to meet other needs (rent, food, etc.), forcing them to live in a cold home (Liddell & Morris, 2010; Howden-Chapman et al., 2012; Rezaei, 2017). A cold home increases the risk of exposure to outdoor cold and affects the perceived mental well-being and emotional resilience of residents (Marmot Review Team, 2011). Children appear to have a higher risk of developing respiratory problems, eating fewer calories, and spending more time indoors when the home is cold, which jeopardizes their physical and cognitive development (Liddell & Morris, 2010; Marmot Review Team, 2011). Energy insecurity in Canada averaged 8% in 2015, with peaks in the Maritimes and Saskatchewan (Canada Energy Regulator, 2017). This rate is three to four times higher than that in Scandinavian countries, but comparable to the European average (Thomson et al., 2017).
3.6.4.4 People Experiencing Homelessness
People experiencing homelessness are also very exposed to cold. A study in Paris, France, estimated that people experiencing homelessness accounted for 62% of those admitted to emergency departments for hypothermia or frostbite in winter from 2005 to 2009 (Rouquette et al., 2011). Many Indigenous peoples live in inadequate housing that require minor to major repairs (Statistics Canada, 2020), and may not be protective of cold temperatures. Indigenous peoples account for 10% to 90% of people experiencing homelessness in 18 Canadian cities, from Halifax to Vancouver (Patrick, 2014). They are therefore disproportionately affected by the effects of cold.
3.6.5
Cold Adaptation Measures
Share
3.6.5.1 Public Warning System
Warning systems should consider wind chill and the temperature felt when setting thresholds, since these variables are associated with the cardiovascular effects of cold on health (Lin et al., 2018). It is difficult, however, to make cold thresholds operational for preventive warning systems, given that wind and humidity forecasts have limited accuracy (Laaidi et al., 2013). Forecasting models do exist, nevertheless. In Quebec, depending on the climate region and based on the 1994–2015 period, health thresholds for a 2-day forecast based upon 25% excess mortality were set at between −15°C and −23°C during the day and −20°C and −29°C at night (Yan et al., 2020). In addition, thresholds based upon a 7% excess hospitalization, were identified as between −13°C and −23°C during the day, and between −17°C and −30°C at night. The thresholds used should also consider the climatic and anthropogenic characteristics of different regions. In Ontario, for example, the temperature threshold below which emergency department visits increase is lower in the North than in the South (VanStone et al., 2017). Health authorities should also consider that intense cold periods can affect the volume of emergency department visits for at least one week and should adjust their capabilities accordingly (Ryti et al., 2016; Lin et al., 2018; Sun et al., 2018). In Canada, schools can also close in extreme cold as part of efforts to keep students safe.
3.6.5.2 Housing Insulation
The most common cold adaptation measures for individuals include wearing warm clothing and increasing time spent indoors, but people with cold homes will still be affected by staying indoors. Housing insulation reduces energy costs and makes it easier to maintain optimal indoor temperatures. Individuals who have benefited from a housing insulation program report better overall health and mental well-being after these renovations (Liddell & Morris, 2010; Howden-Chapman et al., 2012). For example, in New Zealand people aged 65 and over who had previously been hospitalized for cardiovascular or respiratory reasons were at a lower risk of death as a result of improved insulation in their homes, compared to a control group (Preval et al., 2017).
3.6.5.3 Occupational Health and Safety
The Canadian Centre for Occupational Health and Safety sets acceptable working temperature thresholds based on weather variables and the type of work (Canadian Centre for Occupational Health and Safety, 2017). All provinces and territories have adopted these measures as legal limits or guidelines. In addition, several international standards for best practices in cold weather risk assessment and prevention are available (ISO 11079, ISO 15743, etc.) (Holmer, 2009; Mäkinen et al., 2009).
3.7
Drought
Share
3.7.1
Impacts of Climate Change on Drought — Trends and Projections
Share
Past observations do not indicate an increasing trend in the occurrence and severity of droughts in Canada (Bonsal et al., 2019). Climate change may change this trend, however. Although annual rainfall amounts will continue to increase (mainly due to the increase in rain outside the summer months), summer precipitation is projected to decrease in Southern Canada in the late century, under the high emissions scenario (Zhang et al., 2019; see also section 3.9 Precipitation and Storms). As a result, precipitation quantities will be reduced during the season when plants and agriculture need it most, particularly in the Prairie provinces (Prairie Climate Centre, 2019). Figure 3.5 shows projected average annual precipitation for Canada for 2021-2050. In addition, warming temperatures will increase water evaporation. As a result, the impact of climate change on drought in Canada will depend on the net effect of changes in the frequency, duration, and intensity of these conflicting drivers and is therefore difficult to estimate (Bonsal et al., 2019). Still, the Southern Prairies and interior regions of British Columbia are expected to experience an increase in droughts and water shortages in the summer through the end of this century (Bonsal et al., 2019). A similar projected has been made for Southern Quebec, where the maximum number of consecutive days without precipitation is expected to increase in summer and the annual number of unusual humidity events is expected to increase (Ouranos, 2015). Environments that rely on melting snow or ice for their water supply during dry seasons are also more likely to experience an increase in the number and intensity of droughts due to decreased overall snow and ice cover (including glacier loss), and change in streamflow seasonality due to increased winter flows, earlier snow melt, and reduced summer streamflow (Bonsal et al., 2019) (see Chapter 7: Water Quality, Quantity, and Security).
Total annual precipitation, average projected for 2021-2050, under a high emissions scenario (RCP 8.5).
Figure 3.5
Blue areas correspond to areas with significant amounts of precipitation, while brown areas correspond to areas with very low precipitation, increasing the risk of drought.
Source
Prairie Climate Centre, 2019.
3.7.2
Effects of Drought on Health
Share
3.7.2.1 Indirect Health Impacts from Lower Air Quality
Drought increases the amount of dust (PM2.55 and PM10) in the air, as particles are more mobile when not weighed down by moisture (see Chapter 5: Air Quality). In the United States, overall PM2.5 concentrations are projected to increase by 16% in 2100 compared to 2000, simply due to the increased number of droughts (Wang et al., 2017). Because fine particulate matter increases the risk of mortality from respiratory and cardiovascular diseases (Kim et al., 2015), the increased frequency and intensity of droughts could increase overall mortality. For example, it has been estimated that the increase in fine dust concentrations in the air in the Southwestern United States could increase mortality from 24% to 130% from 2076–2095, compared to 1996–2015 (Achakulwisut et al., 2018). This trend was observed in the United States, where periods of worsening drought conditions increased the mortality rate by 1.55% between 2000 and 2013 compared to other periods (Berman et al., 2017). Droughts also indirectly affect air pollutant concentrations by increasing wildfires (see Chapter 5: Air Quality).
3.7.2.2 Infectious Diseases
Winds, combined with dry weather, can also facilitate the transport of pollens, mould, fungi, bacteria, and other organic matter (Stanke et al., 2013). Droughts can cause and exacerbate allergic and respiratory symptoms and promote the spread of infectious diseases. Related respiratory diseases include bronchitis, sinusitis, pneumonia, and asthma (Yusa et al., 2015; Doede & Davis, 2018). Some evidence points to an increase in cases of vector-borne diseases such as West Nile virus and encephalitis, during droughts, although a decrease is observed for other diseases, such as Lyme disease (Yusa et al., 2015) (see Chapter 6: Infectious Diseases).
3.7.2.3 Water-Borne Diseases
Droughts can increase pathogen concentrations in water and facilitate the transport of organic matter to water bodies during subsequent rainfall (Funari et al., 2012; Cann et al., 2013). As a result, they may increase the risk of water-borne diseases through surface water, although few studies have evaluated the effects of droughts in this regard (Levy et al., 2016) (see Chapter 7: Water Quality, Quantity, and Security). In some rural Quebec municipalities, the risk of gastrointestinal disease was at least twice as high within four weeks of very low precipitation events (Febriani et al., 2010). In Greater Vancouver, the number of Cryptosporidium and Giardia cases increased significantly up to six weeks after a heavy rainfall day following a severe drought (Chhetri et al., 2017).
3.7.2.4 Food Security
Droughts weaken crops, predisposing them to mycotoxin contamination (toxins produced by certain moulds) and making them vulnerable to insect attacks (van der Kamp, 2016; Medina et al., 2017). Declining agricultural yields can increase consumer prices and affect people experiencing food insecurity due to social disparities (see Chapter 8: Food Safety and Security).
Areas such as the Southern Prairies and Prince Edward Island, where agriculture is a significant part of their economy and identity, are more vulnerable to droughts. For example, droughts in 1980 and 2001–2002 each cost Canadians an estimated $5.8 billion, excluding health costs (Wheaton et al., 2008; Diaz et al., 2016). Droughts reduce agricultural productivity, increase personal debt for farmers, devalue land, and reduce employment opportunities in rural areas (Guiney, 2012). By reducing the economic viability of rural areas, droughts can result in rural exodus and perpetuate a vicious cycle of vulnerability (Vins et al., 2015). This loss of viability in rural areas can ultimately affect the mental and social health of the people living there.
3.7.3
Populations at Increased Risk to Drought
Share
3.7.3.1 Rural Living
Rural populations are at increased risk to impacts of droughts compared to urban populations because they are generally more dependent on agricultural activities for their economic well-being and because their proximity to natural environments means that the deterioration of the environment affects them more directly. The resulting financial, social, and emotional stress can negatively affect the psychosocial well-being of rural populations. However, these effects have not been studied extensively in a Canadian context; most studies on the subject have been conducted in Australia and may not be representative of Canada (see Chapter 4: Mental Health and Well-Being).
3.7.3.2 Psychosocial Health
Australian farmers who report that droughts have significantly reduced their agricultural productivity have more mental health problems and a lower level of psychological well-being compared to unaffected farmers (Edwards et al., 2015). Rural children and adolescents affected by Australian droughts report higher-than-normal levels of emotional and relationship distress (Dean & Stain, 2010; Carnie et al., 2011).
Drought duration and intensity are determining factors of the impact a drought can have on the psychological distress of affected populations. In Australia, a drought of more than one year increased the incidence of psychological distress among rural residents by 6% (OBrien et al., 2014). In extreme cases, droughts may also increase the suicide rate in some population subgroups (Gunn et al., 2012; Hanigan et al., 2012). For example, rural men aged 10 to 49 had a higher risk of suicide during intense droughts (up to 15%) (Hanigan et al., 2012). On the other hand, available data are somewhat contradictory for women and seniors, who, in some cases, were at a lower risk of suffering from psychological problems or committing suicide (Hanigan et al., 2012; Powers et al., 2015; Crnek-Georgeson et al., 2017). For urban populations, mental health risks do not appear to be affected by droughts regardless of their duration or intensity (Gunn et al., 2012; Hanigan et al., 2012; OBrien et al., 2014).
3.7.3.3 Food Insecurity and Malnutrition
Drought-related stress and financial insecurity can also have a negative impact on food quality, as demonstrated by studies in Australia (see also Chapter 8: Food Safety and Security). Rural populations affected by a particularly long and intense drought between 2001 and 2008 ate more high-sugar and high-fat foods compared to those who were not affected or for whom the drought was shorter (Friel et al., 2014). Children are particularly at risk because the quality of their diet is critical to their physiological and cognitive development (Martinez Garcia & Sheehan, 2016). In addition to the agricultural sector, the economic viability of the forest industry and its workers may also be compromised by droughts, as they fuel wildfires (Bonsal et al., 2011).
3.7.3.4 Age, Sex, and Gender
People vulnerable to the effects of droughts are also vulnerable because of associated increases in pollutant concentrations in the air and water. In children, droughts can increase the risk of developing and exacerbating respiratory problems. In California, the number of emergency department visits for childhood asthma doubled in the years of severe drought from 2012 to 2016 compared to previous years, with children close to farmland at greater risk (Doede & Davis, 2018). Seniors, people with chronic diseases, fetuses during pregnancy, low-income individuals, and outdoor workers are also more exposed or sensitive to air pollutants, which can be amplified during droughts (see Chapter 5: Air Quality). In addition, children, seniors, and immunocompromised people are at higher risk of contracting waterborne diseases (Funari et al., 2012; Cann et al., 2013).
3.7.4
Drought Adaptation Measures
Share
3.7.4.1 Awareness of Psychosocial Impacts
Rural populations are more reluctant to seek help when they need it (Berry et al., 2011; Gunn et al., 2012). In particular, the stigma attached to mental health problems decreases the likelihood of people seeking help for these types of problems. Promoting mental health literacy, organizing social events in times of drought, establishing a telephone support line, as well as creating psychosocial programs, can promote social acceptance of mental health problems and of seeking help, if necessary (Hart et al., 2011).
3.7.4.2 Financial Support Programs and Monitoring and Warning Systems
Several rural Canadian communities have implemented drought adaptation measures. Provinces such as Saskatchewan and Alberta have implemented drought monitoring systems, emergency plans for extended dry conditions, and programs to improve environmental management infrastructure (irrigation, reservoir, etc.) (Hurlbert & Gupta, 2016). A drought monitoring and reporting tool is also available across Canada (Agriculture and Agri-Food Canada, 2021). Low-labour agriculture, crop diversification and rotation, as well as the use of species more resistant to dry conditions, are other options to reduce the vulnerability of crops and people working in agriculture. These measures were used during droughts in the Prairies in 2001 and 2003, where they reduced losses (Abbasi, 2014; Diaz et al., 2016). Nevertheless, infrastructures and strategies are often implemented on the basis of past climate data and are therefore not adapted to the increasing frequency and intensity of drought (Mcmartin et al., 2018). In California, it was estimated that a water management policy using past data would not meet water demands in future droughts. It would underestimate water supply needs by up to 58% compared to an adaptive policy that takes account of future climate conditions (Georgakakos et al., 2012). Vodden & Cunsolo (2021) identify adaptation options to better prepare for future drought impacts and reduce financial stress they cause. Such options include winter water storage to feed summer irrigation, agroclimatic atlas to support the development of drought-adapted crop varieties and improved infrastructure such as dams or intake pipes (Warren & Lulham, 2021).
3.7.4.3 Monitoring the Indirect Impacts of Drought on Air and Water Quality
Monitoring air quality and water-borne diseases that may be affected by droughts makes it easier to implement preventive or reactive responses to protect health. For example, Environment and Climate Change Canada’s Air Quality Health Index (AQHI) informs the public in semi-real-time about the immediate risks associated with air quality in some 60 communities across 10 Canadian provinces (Environment and Climate Change Canada, 2019a). The AQHI provides information about when certain thresholds are exceeded, including on adaptation measures for the general public and certain subgroups of vulnerable populations (Environment and Climate Change Canada, 2019a) (see Chapter 5: Air Quality). Air quality maps are also available in quasi-real-time across North America through automated analysis of satellite images (AirNow, 2021). However, pollen monitoring remains seriously lacking in several Canadian regions compared to Europe or the United States, as shown in Figure 3.6 (Buters et al., 2018). Improving water treatment facilities could also reduce the incidence of water-borne diseases in the event of drought (see Chapter 7: Water Quality, Quantity, and Security). Other strategies to restrict water consumption voluntarily or in a mandatory way during droughts can also help to better allocate water resources and limit agricultural losses (Yusa et al., 2015).
Impacts of Climate Change on Wildfire — Trends and Projections
Share
Forest area affected by fires doubled in Canada between the 1970s and early 2000s, mainly due to climate change (Gillett et al., 2004). One study estimated that the fire risk for 2010–2020 in Western Canada would increase more than it would have been without the anthropogenic influence of climate change (Kirchmeier-Young et al., 2017). Western Canada experienced significant increases in the number of major fires and the area burned between 1959 and 2015 (Hanes et al., 2019). Climate change has reportedly increased the area burned seven- to 11-fold during the extreme 2017 fire seasons in British Columbia (Kirchmeier-Young et al., 2019). This trend is expected to continue and grow with climate change in all regions of Canada by the end of the century (Flannigan et al., 2005; Flannigan et al., 2009). The number of days of uncontrolled wildfire could double or even triple by 2100 in British Columbia and the boreal forest (Wotton et al., 2017).
There are three reasons for these increases. First, warmer temperatures mean a longer fire season. For example, the fire season has been extended in the interior of British Columbia, Alberta, and Northern Ontario (Albert-Green et al., 2013; Hanes et al., 2019). Second, warmer conditions increase lightning strikes, driven by increased thunderstorms in a warmer/more humid environment, which increase the risk of fire (Romps et al., 2014). Third, warmer temperatures, coupled with earlier spring snow and higher spring/summer extreme temperatures, dry out forest fuels unless there is a significant increase in precipitation (Flannigan et al., 2016). Furthermore, burning forests releases GHGs that are responsible for climate change, creating a vicious cycle (Prairie Climate Centre, 2019). Most climate change scenarios in Canada do not project increases in precipitation that would offset the drying effect of warmer temperatures. Finally, climatologists do not always include behavioural factors in their projections, although humans are responsible for about 50% of bush or wildfires (Van Wagner, 2015). The greater proximity of the forests to where people live due to the expansion of urban areas and roads can also contribute to an increase in wildfires, particularly in the southern part of the country.
Air pollutant emissions from wildfires are a health concern. Four factors influence the amount of pollutant emissions from wildfires: the area burned, the amount of fuel burned, the completeness of combustion, and the amount of pollutant emissions in relation to the amount of fuel burned (emission factor). The amount of fuel burned and area burned are projected to increase in all Canadian forests by 2100 as a result of climate change (Wotton et al., 2017). Ultimately, wildfire pollutant emissions could double across Canada by the end of this century.
3.8.2
Effects of Wildfires on Health
Share
The health risks associated with air pollution generated by wildfires are addressed more fully in Chapter 5: Air Quality, along with a discussion of populations at increased risk, and adaptation measures. A summary of pertinent information for this chapter is provided below.
3.8.2.1 Wildfire Smoke Characterization
The health burden associated with wildfires is related mainly to emissions of air pollutants such as fine particulate matter (PM2.5), carbon monoxide, nitrogen oxides, and volatile organic compounds (Black et al., 2017). The composition of wildfire smoke is highly variable and depends on vegetation type and weather conditions. Wildfire smoke can spread over long distances, and consequently affect populations several thousand kilometres from the combustion site (Le et al., 2014; Lutsch et al., 2016). The adverse effects of wildfire smoke on human health are likely the result of similar mechanisms as for ambient fine particles, such as causing inflammation and oxidative stress as well as suppressing immune responses (Reid et al., 2016; Black et al., 2017; Cascio, 2018).
3.8.2.2 Smoke from Wildfires and Mortality
Studies have demonstrated a link between all-cause mortality and exposure to wildfire smoke (Youssouf et al., 2014; Reid et al., 2016; Cascio, 2018). Using its Air Quality Benefits Assessment Tool, Health Canada estimated 54–240 premature deaths due to short-term exposure and 570–2500 premature deaths due to long-term exposure could be attributed annually to fine particulate matter emissions from wildfires between 2013 and 2018, excluding 2016 (Matz et al., 2020). Although results vary depending on year and location and intensity of the fires, the majority of the premature deaths were associated with British Columbia and Alberta, followed by the Western provinces of Saskatchewan and Manitoba, and the Northwest Territories. For the continental United States, an estimated 1500 to 2000 and 8700 to 32,000 premature deaths per year were attributed to short-term and long-term exposure to PM2.5 from wildfires, respectively, from 2008 to 2012 (Fann et al., 2018).
Considering both RCP4.5 and RCP8.5 climate scenarios compared to the early 21st century, premature mortality from wildfire-PM2.5 was estimated to double for the continental United States by late 21st century, even as total premature mortality attributable to all PM2.5 (anthropogenic emissions) is expected to decrease (Ford et al., 2018).
3.8.2.3 Wildfire Smoke and Respiratory and Cardiovascular Disease
Exposure to wildfire smoke has increased the exacerbation of respiratory diseases, particularly asthma, chronic obstructive pulmonary disease, bronchitis, and pneumonia (Henderson & Johnston, 2012; Cascio, 2018). In comparison, the relationship between wildfire smoke exposure and cardiovascular disease remains inconclusive in the literature, as some studies demonstrate an association, while others report null findings (Reid et al., 2016; Cascio, 2018).
Wildfire-related health studies in Canada have been conducted primarily in British Columbia. For the 2003 fire season, a study estimated that every 30 μg/m3 increase in PM10 concentrations increased the likelihood of consulting a physician for respiratory problems by 5%, for asthma specifically by 16%, and of being admitted to the hospital for respiratory issues by 15% (Henderson et al., 2011). No association with physician visits or hospital admissions for cardiovascular outcomes was observed in this study. Another study also determined that most days with air concentrations of PM2.5 over 25 μg/m3 during the 2014 fire season were associated with greater than anticipated increases in doctor visits for asthma and in salbutamol (asthma medication) dispensations (McLean et al., 2015). In the Northwest Territories, primary care visits for asthma, cough, pneumonia, and salbutamol prescriptions increased in 2014 during a severe fire season, compared to 2013 and 2012 (Dodd et al., 2018a).
3.8.2.4 Direct Exposure to Wildfires and Psychosocial Health
The effects of wildfires on psychosocial health, including property loss, evacuations, and environmental degradation, have also been investigated. Six months after the 2016 Fort McMurray fires, 20% of residents surveyed met the criteria for generalized anxiety disorder (Agyapong et al., 2018). People with certain risk factors (pre-existing anxiety disorder, having witnessed the destruction of one’s own home, living in other accommodations after the fires, limited family or government support, and seeking psychological counselling) were two to seven times more likely to meet the criteria for the disorder. This incidence of depression and anxiety increased with the duration of evacuation and the extent of financial loss (Cherry & Haynes, 2017). In the Northwest Territories, the 2012 and 2013 wildfires appear to have exacerbated feelings of loneliness, fear, stress, and uncertainty in the population, including in the First Nations, Inuit, and Métis Indigenous populations (Dodd et al., 2018a; Dodd et al., 2018b). Prolonged smoke episodes related to these wildfires would have increased indoor time and caused respiratory problems (Dodd et al., 2018b). Some studies in Australia and Greece have also shown that people who suffered loss or health problems, or who were evacuated as a result of wildfires, are more likely to experience trouble sleeping, anxiety, and hostile feelings as well as depressive and post-traumatic symptoms (Finlay et al., 2012; Psarros et al., 2017; Thompson et al., 2017). Wildfire smoke on its own has not been associated with hospitalizations and counselling for mental illness (Reid et al., 2016). Mixed results about the relationship between wildfire smoke exposure and cardiovascular health could be explained by the level of psychosocial impacts felt during an event; the combined effect of air pollutant inhalation and psychological stress may be conducive to adverse cardiovascular effects (Reid et al., 2016).
3.8.2.5 Water-Borne Diseases
Wildfires can also raise levels in water of organic matter, sediment, and heavy metals, such as nitrogen, phosphorus, arsenic, mercury, and manganese (Smith et al., 2011; Khan et al., 2015). Wildfires followed by heavy rainfall are particularly conducive to deteriorating water quality (see Chapter 7: Water Quality, Quantity, and Security). These increases can be harmful to people who draw their water from unfiltered sources and problematic for filtration plants during intense wildfires. Wildfires can also weaken coastal environments, making them vulnerable to erosion and flooding, which can also affect water quality.
3.8.3
Populations at Increased Risk to Wildfires
Share
While the effects of wildfire smoke are important, there are other factors important to health that can compound the overall impacts of fire.
3.8.3.1 Pre–Existing Morbidity
Studies of populations at increased risk to wildfire smoke are rare (Reid et al., 2016). Populations at risk are often inferred from studies of the health effects of air pollutants from all sources (Rappold et al., 2017; Cascio, 2018) (see Chapter 5: Air Quality). However, several studies have suggested that people with asthma, chronic obstructive respiratory diseases, or lung infection ns are more likely to experience the harmful effects of smoke (Henderson & Johnston, 2012; Reid et al., 2016).
3.8.3.2 Seniors
Seniors seem more susceptible to wildfire smoke health impacts (Liu et al., 2017) and several studies, both in animal and human models and studies, suggest that oxidative stress and systemic inflammation from exposure to biomass particles could be involved (Youssouf et al., 2014). In the Northeastern United States, hospitalization rates for respiratory and cardiovascular problems in people aged 65 years and older during smoke events increased by 49.6% and 64.9%, respectively, compared to the period before smoke events (Le et al., 2014). In the Western United States, climate change could lead to a modest increase of 178 respiratory hospital admissions among people aged 65 and older from 2046 to 2051 (Liu et al., 2016b).
3.8.3.3 Children
In the 2011 wildfires near Slave Lake, Alberta, affected children experienced symptoms of post-traumatic stress six months after the event, but these symptoms disappeared after a year (Townshend et al., 2015). Younger children with several stress factors (death of a loved one, disease, academic problems, etc.) or whose home was destroyed in a wildfire were at higher risk of experiencing symptoms without resolution (Felix et al., 2015; Townshend et al., 2015). During the Fort McMurray wildfires in 2016, grades 7 to 12 students who were exposed to the wildfire showed a higher prevalence of depressive symptoms, suicidal ideation, and smoking than students the same age living in Red Deer, an Alberta city unaffected by these events (Brown et al., 2019). These children also had lower self-esteem and quality of life scores.
3.8.3.4 Social Inequities
In the United States, Black people, those with incomes below the median, and women were at a higher risk of being admitted to the emergency department for respiratory problems on smoke days (Liu et al., 2017). During a 2008 wildfire in North Carolina, rural counties with lower education, employment, income, and social capital levels presented a higher risk of emergency department admissions for asthma and heart failure compared to counties more privileged along those measures (Rappold et al., 2012). The two factors explaining the strongest correlations were income and income inequality. Women appear to be more likely than men to experience depression as a result of evacuation due to wildfire or related job loss (Cherry & Haynes, 2017).
3.8.3.5 Indigenous Populations
In addition to impacts on respiratory and cardiovascular diseases, wildfires can also disrupt traditional and subsistence activities in northern First Nations, Inuit, and Métis communities, leading to psychological impacts such as stress, anxiety, and depression (Cunsolo Willox et al., 2015; Manning & Clayton, 2018). Persistent smoke from the wildfires in summer 2014 disproportionately affected the physical, and psychosocial health of people living in First Nations communities in Northwest Territories (Dodd et al., 2018a; Dodd et al., 2018b).
3.8.3.6 Safety of Wildland Firefighters
Wildland or forest fire fighters are at greater risk of health effects from fires. They are more likely to experience decreased lung capacity as well as increased oxidative stress and respiratory symptoms, but there is little evidence to suggest that related mortality and morbidity are higher in the long term (Adetona et al., 2016; Black et al., 2017). A study in Greece also indicated that more of these workers experienced post-traumatic symptoms, particularly seasonal workers or workers fearful of dying in a fire, workers exhibiting symptoms of depression, or workers with personality characteristics of neuroticism (Psarros et al., 2018).
3.8.4
Wildfire Adaptation Measures
Share
3.8.4.1 Individual Adaptation Measures
For clean air shelters and homes, high-performance filters can substantially reduce the amount of fine particulate matter in the air, which could mitigate effects on respiratory and cardiovascular health, depending on sources of pollution in the building, the size of the building, and the ventilation rate (Barn, 2014). To encourage people to adopt needed action to protect health, simple messages like “Don’t go outside” or “Don’t do outdoor physical activity” can be used. It is also best to not require infrastructure changes such as buying portable air filters or air conditioners (Dix-Cooper et al., 2014). The health effects of reduced time outdoors during an event have not been adequately assessed but are likely to depend on the quality of the home and its facilities. Seniors, people who do not understand the language used in messages sent out, and people who are more isolated are more difficult to reach and therefore less likely to follow these measures.
3.8.4.2 Public Adaptation Measures
Monitoring and Warning System
Given the complexity of calculating source emissions and the relative cohesion of a smoke plume over large distances, including wildfires in air quality forecasts is a significant challenge (see Chapter 5: Air Quality). Environment and Climate Change Canada has implemented Canada’s Wildfire Smoke Prediction System (FireWork) to estimate wildfire smoke trajectory across North America over the coming 48 hours (Environment and Climate Change Canada, 2019b). In British Columbia, adjustments have been adopted for the AQHI to more accurately reflect the impacts of wildfire smoke on air quality, public perception of risk, and population health in British Columbia. The AQHI and the modified index (AQHI+) were both associated with all-cause mortality, physician visits for circulatory and respiratory causes, and with prescription of asthma medication. During the wildfire season, the modified index exhibited a better fit for asthma-related outcomes and, during periods with intense wildfire activity, for all respiratory outcomes (Yao et al., 2020). Air quality forecasts for wildfires continue to improve (Chen et al., 2019) and forecasts have been associated with some respiratory health outcomes (Yao et al., 2013; Yao et al., 2020). Action levels for interventions to reduce exposure can be based upon air quality indexes values or pollutant concentrations. Assuming fairly widespread adoption of measures by the public, a North Carolina simulation found that 24- or 48-hour forecasts could help reduce emergency department visits for asthma and heart failure if the threshold level is for forecasted concentrations of 20 μg/m3 PM2.5 compared to higher concentrations such as 50 μg/m3 (Rappold et al., 2014).
Preparation and Action Plan
To better prepare the health care system and population for wildfires, the National Collaborating Centre for Environmental Health and British Columbia Centre for Disease Control recommended 13 priority actions based on consultations with 29 health care professionals (Maguet, 2018). These priorities relate to the following themes: documenting the experiences in implementing smoke shelters and establishing guidelines for identifying and using them; soliciting the active participation of local public health care professionals in planning emergency responses; and raising awareness among health care professionals about the effects of wildfires and associated adaptation measures. Allowing pharmacists to prescribe or renew certain medications without a physician’s prescription in emergency situations could also reduce the vulnerability of some people with pre-existing diseases that need to be treated with medication (Mak & Singleton, 2017).
Evacuations
The effects on health of wildfire evacuations as an adaptation measure are mixed and should only be undertaken when public safety is not compromised. Several studies have shown that some evacuations have resulted in increased mortality and morbidity among institutionalized individuals, in spreading infectious disease in shelters, and in compromised health and mental well-being in both adults and children (Stares, 2014). Indigenous Peoples often experience disproportionate adverse impacts related to evacuation (see Chapter 2: Climate Change and Indigenous Peoples’ Health in Canada). The positive effects of evacuations have not been assessed and are difficult to document. These results are consistent with other studies on the health effects of evacuations (Munro et al., 2017; Thompson et al., 2017). In short, the harmful effects of wildfire smoke can be reduced by distributing high-performance filters, making smoke shelters available in affected communities, sending out simple messages encouraging people to stay indoors using communication methods that reach the most isolated people of society or those who are less likely to understand, and evacuating populations for whom the health risks of staying outweigh those associated with evacuation. High perception of risk and past property damage increases the likelihood that an individual will evacuate before and during a wildfire, which underscores the importance of raising awareness among affected populations (Thompson et al., 2017).
3.8.4.3 Infrastructural Adaptation Measures
Land-Use Planning
Containing urban sprawl is an adaptation measure that limits both direct exposure (heat) and indirect exposure (smoke) to wildfire health hazards. To limit wildfire exposure, municipalities can limit their urban perimeter and keep construction projects, as well as identifying natural buffer zones to restrict development in the wildland urban interface. Cities that now have agricultural activities in the surrounding area are also less at risk of wildfire damage because agricultural land can create a buffer zone (Darques, 2015). Planting more fire-resistant vegetation at the edge of a forest can also reduce the severity of some wildfires (Fernandes, 2013).
Built Environment
Home adaptation is also a key factor in mitigating wildfire risk. Most infrastructure losses are caused by wind-propelled ash deposited on buildings and by vegetation burning near buildings. As a result, using non-combustible materials for homes and thinning the surrounding vegetation up to 30 metres from the building are both associated with a significant decrease in infrastructure losses during a wildfire (Moritz et al., 2014). Programs, such as FireSmart (https://firesmartcanada.ca/), offer a variety of effective methods for adaptation.
Prescribed Burning
Prescribed burning of combustible material has been presented as an adaptation option to reduce the occurrence and intensity of wildfires (Fernandes, 2013). Results of its effectiveness are mixed, however. Since organic combustible materials renew quickly in the forest, prescribed burning is most effective as part of the initial response when a wildfire occurs or when it involves permanent reduction in combustible materials (Enright & Fontaine, 2014). Prescribed burning requires treatment of a significant portion of the forest to be effective, which incurs substantial costs. Repeated burning also increases the amount of pollutants in the air, exposing nearby residents to the associated health risks (Navarro et al., 2018). Without assessing the associated costs, a study in Europe found that systematic and widespread use of prescribed burning could reduce the projected increase in the area burned under future climate change from 200% to less than 50% in 2090, compared to the beginning of the century (Khabarov et al., 2016).
3.9
Precipitation and Storms
Share
3.9.1
Impacts of Climate Change on Precipitation and Storms — Trends and Projections
Share
Annual average precipitation in Canada increased by 20% between 1948 and 2012, with a larger increase in Northern Canada (Zhang et al., 2019). Heavy precipitation over a day or less can cause localized damage to infrastructure, such as roads and buildings, while multi-day episodes of precipitation can produce flooding over a large region. For Canada as a whole, no trends were detectable in extreme precipitation accumulated over periods of a day or less. More locations have experienced an increase rather than a decrease in the highest amount of one-day rainfall each year, but the direction of trends is random over the country.
Projections indicate with a high degree of confidence that both annual average precipitation and extreme precipitation events (Figure 3.7) are expected to increase over the course of the century regardless of the GHG emission scenario. In addition, changes in rainfall patterns vary according to the season (Zhang et al., 2019). Winter precipitation in the form of rain has increased, and this trend is expected to continue. The projected increase in annual mean precipitation (about 24% higher under RCP 8.5) is mainly due to increased non-summer precipitation in all regions of Canada, particularly in Northern regions. Conversely, summer precipitation is expected to decrease over Southern Canada, especially under RPC 8.5 (Zhang et al., 2019). As the climate warms, particularly in Northern Canada, there will inevitably be an increased likelihood of precipitation falling as rain rather than snow, as it is already observed (Zhang et al., 2019).
Annual number of heavy precipitation days projected for 2021-2050 in Canada, based on current GHG emission trends (RCP 8.5).
Figure 3.7
Blue areas correspond to areas with more than 10 days per year of extreme precipitation, while brown areas correspond to areas with less than 4 days per year of extreme precipitation. A Heavy Precipitation Day (HPD) is a day on which a total of at least 20 mm of rain or precipitation falls. Frozen precipitation is measured by its liquid equivalent: 20 cm of snow equals about 20 mm of precipitation.
Source
Prairie Climate Centre, 2019.
The effect of climate change on winds and tornadoes is uncertain. For hail events in Canada, one study projected that, by 2070, the number of hail days will decrease (compared to the 1971–2000 period); the confidence for such projections are low — the lowest among extreme event types (Brimelow et al., 2017). In contrast, large hailstones might increase in summer, creating more damage than previously, particularly in Central and Western Canada (Brimelow et al., 2017). Winds and precipitation also cause flooding, erosion, and coastal submergence, which are addressed separately in the section 3.10 Floods, Coastal Flooding, and Coastal Erosion.
3.9.2
The Effects of Precipitation and Storms on Health
Share
3.9.2.1 Unintentional Trauma – Precipitation
Snow, rain, and freezing rain increase the risk of falling outdoors by reducing traction or creating obstacles to travel. Precipitation increases the risk of hip and wrist fractures, in particular (Ali & Willett, 2015). In Montréal, only three freezing rain or rain events, followed by significant temperature drops, caused nearly half of the falls that occurred during the months of December and January in 2008–2009 (Morency et al., 2012). Another study of people 40 years and older in Montréal indicated that snowfall could have a greater impact on hip fractures than rainfall (Modarres et al., 2014). The risk of hip fractures related to weather variables appears to increase exponentially during extreme conditions. In England, medical visits for accidental injury from 1996 to 2006 increased by 2.2% for every 10 millimetres of rain and by 7.9% on snowy days (Parsons et al., 2011). Freezing rain seems to have the greatest impact on injuries, with the effect lasting up to three days following precipitation (Modarres et al., 2014). During the ice storm that swept across Ontario in December 2013, Ottawa and Toronto residents were 2.5 times more likely to be hospitalized for environmental reasons than in previous years (Rajaram et al., 2016). In addition to injuries, snow can indirectly increase the risk of heart attack, given that snow removal and walking in the snow increases hear rate and that the cold promotes vasoconstriction (Auger et al., 2017e).
3.9.2.2 Unintentional Trauma – Storms
Despite its destabilizing effect, average wind speed does not appear to be significantly associated with an increase in the number of injuries below the storm threshold (Ali & Willett, 2015). Wind gusts of 70 km/h or more appear to increase the risk of injury (Saulnier et al., 2017). There is also an increase in injuries during the recovery effort following a storm. These include lacerations, punctures, electrocutions, and falls due to infrastructure fragility and insecurity (Goldman et al., 2014). Although precipitation generally keeps pollen on the ground, periods of extreme precipitation and storms lift massive amounts of pollen into the air through osmotic shock. This can lead to a sharp increase in asthma symptoms among those with pollen allergies (D’Amato et al., 2012).
3.9.2.3 Road Accidents – Precipitation
Precipitation increases the risk of road injuries by making the roadway slippery (Koetse & Rietveld, 2009; Ali & Willett, 2015). In the Greater Vancouver area, an estimated 17% to 28% increase in collisions is expected by 2055 due to increased maximum and total precipitation; the effect is more pronounced during heavy precipitation events (Hambly et al., 2013). However, precipitation also reduces the risk of road fatalities because drivers adjust their driving on snow-covered or wet roads by reducing speed, among other measures (Koetse & Rietveld, 2009; Ali & Willett, 2015). Across Canada, the relative risk of rainfall-related mortality decreased in 10 Canadian cities between 1984 and 2002, but there was no change for snowfall (Andrey, 2010). This trend could continue in the future, depending on precipitation patterns and improvements in vehicle and road safety. By contrast, the increase in freeze–thaw cycles and in winter thaws could make travel less safe, as a water-coated ice surface is more slippery and winter tires are less effective under these conditions (TIRF, 2012). Stronger winds could also intensify blowing snow, decrease road visibility, and reduce vehicle control of drivers (Goldman et al., 2014). The net effect of climate change on the risk of road travel injuries in Canada therefore remains to be determined.
3.9.2.4 Physical Activity
Increased summer precipitation may also influence physical activity. A study in Canada found that the number of footsteps among 8125 participants decreased by 8.3% when rainfall totals reached 14 millimetres (Chan et al., 2006). Children can spend up to 15 minutes less per day on moderate- or high-intensity physical activity on rainy days compared to dry days (Harrison et al., 2015). This plateaus, however, after which point the amount of rain no longer affects level of physical activity. As a result, an increase in heavy rainfall events rather than days of rain may not have much impact on physical activity levels.
3.9.2.5 Water-Borne Diseases
Stormwater from precipitation carries many pollutants from anthropogenic and natural environments to locations conducive to water concentration. This results in significant bacterial loads in surface water and stormwater can contaminate groundwater upon mixing (Cann et al., 2013). This increases the risk of water-borne disease agents, particularly gastrointestinal diseases such as viruses (e.g., enterovirus), bacteria (e.g., Campylobacter) and enteric protozoa (e.g., Giardia) (Levy et al., 2016; Ghazani et al., 2018) (see Chapter 6: Infectious Diseases and Chapter 7: Water Quality, Quantity, and Security). In addition, both precipitation highs (e.g., heavy precipitation) and lows (drought) increase the risk of water-borne diseases spreading, and climate change is expected to increase the frequency of these two extremes in Canada (Herrador et al., 2015; Ghazani et al., 2018).
Legionellosis cases are positively correlated with the amount of precipitation. Legionellosis is mainly transmitted through the respiratory tract, and precipitation increases the formation of bacteria-infected airborne particles (see Chapter 6: Infectious Diseases). In Connecticut, each 5 millimetre increase in rainfall was found to have raised the risk of legionellosis by 48%, which is a higher incidence than observed for changes in temperature or humidity (Cassell et al., 2018). In fact, about half of pathogens that significantly affect human or animal health are sensitive to precipitation or moisture (McIntyre et al., 2017). Extreme precipitation in particular affects some bacteria or parasites that are agents of water-borne diseases, such as Campylobacter, Cryptosporidium, Giardia, and Legionnella, but this is not the case for non-extreme precipitation (Sakamoto, 2015; Young et al., 2015). In Vancouver, days that exceed the 90th percentile of precipitation increased the number of Cryptosporidium and Giardia cases up to six weeks after the event (Chhetri et al., 2017). Heavy rainfall and storms can also increase the risk of food-borne pathogens, such as norovirus, Campylobacter, Toxoplasma gondii, and Listeria monocytogenes (Smith & Fazil, 2019).
Runoff from extreme precipitation also affects recreational waters (e.g., beaches), exposing users to several infectious agents of waterborne diseases (Sanborn & Takaro, 2013) (see Chapter 7: Water Quality, Quantity, and Security).
3.9.2.6 Indirect Impacts – Power Outages
Strong winds and precipitation such as freezing rain can cause power outages. A prolonged and widespread outage can cause significant social disruption and affect the psychosocial health of those affected (Silver & Grek-Martin, 2015). In winter, power outages can also force some people to live in cold homes and suffer the resulting health consequences. During winter power outages, the risk of carbon monoxide poisoning is high due to the use of portable generators and heating/cooking units (Goldman et al., 2014; Johnson-Arbor et al., 2014). Poisoning can also occur when the exhaust pipe of a running car is blocked by snow, which occurs mainly on the same day as a snowstorm (Johnson-Arbor et al., 2014).
3.9.3
Populations at Increased Risk to Storms and Precipitation
Share
3.9.3.1 Precipitation
Sex and Gender
Heavy snowfalls have been linked to cardiovascular complications. In a Quebec study examining the period from 1981 to 2014, men were at a 16% higher risk of being hospitalized and a 34% higher risk of dying due to myocardial infarction on the day following a 20 centimetre snowfall, compared to a day without snow (Auger et al., 2017e). This could be related most likely to the increased cardiac demands of snow shovelling coupled with cold, with men being potentially more likely than women to shovel, particularly after heavy snowfalls (Auger et al., 2017e).
Age
Studies suggest that children and adults over 40 are primarily at risk of falling during precipitation and of being injured. In Montréal, freezing rain was identified as a more significant weather factor than average temperature or snow to explain the number of falls among those aged 50 and over, while other studies seem to indicate a decreasing risk beyond 75 years of age due to loss of mobility, and thus a decrease in travel when freezing rain occurs (Morency et al., 2012; Ali & Willett, 2015). A study in Quebec found that people aged 40 to 74 are more likely to be injured due to weather conditions than those aged 75 and over (Martel et al., 2010). Children in Finland were found to be 50% more likely to injure their wrists on rainy days than on dry days (Ali & Willett, 2015).
Rural Living
In Canada, residents of small towns and of rural and remote areas are also at greater risk of contracting water-borne disease, with a relatively high proportion of outbreaks estimated to have occurred in municipalities with populations of 5000 or less following unusual weather events such as drought or heavy precipitation events (Febriani et al., 2010; Moffatt & Struck, 2011). These municipalities and private well water supplies often rely on groundwater with little or no treatment to supply their residents with drinking water. Small systems and private individuals often have less means to invest sufficiently in water treatment and protection measures. In Canada, one in eight people are supplied from private supplies, most of which rely on rural groundwater sources (Charrois, 2010), and about 1.7 million (4.9%) Canadians are served by small community groundwater (3.1%) and surface water (1.8%) supplies (Murphy et al., 2016).
Indigenous Populations
Many Indigenous populations are also at greater risk of water-borne diseases, especially since most water management infrastructure in these communities are considered at moderate- or high-risk to the impacts of heavy precipitation (Neegan Burnside Ltd., 2011). In addition, many communities lack access to safe drinking water, and continue to experience boil water/drinking advisories; this increases health risks from extreme rainfall events. Inuit communities have the highest prevalence and incidence of gastrointestinal disease (Wright et al., 2018). See Chapter 2: Climate Change and Indigenous Peoples’ Health in Canada and Chapter 7: Water Quality, Quantity, and Security for more discussion of the increased risks of extreme precipitation or storms for First Nations, Inuit, or Métis people and vulnerability factors that exacerbate the direct and indirect impacts of these hazards on their health.
3.9.3.2 Storms
Some population groups are more affected by storms that cause significant social disruption and have more severe health impacts. Because medications may be more difficult to obtain during and following a storm, those whose physical or mental health depends on them may be more negatively affected (McClelland et al., 2017). Seniors, men, smokers, and people who already have respiratory problems are more likely to develop legionellosis and other water-borne diseases during heavy rainfall events, usually a few weeks after the event (Hicks et al., 2007; Sakamoto, 2015; Cassell et al., 2018).
Age
Children are at risk for post-traumatic stress disorder as a result of storm events, particularly children who previously had anxiety or depressive symptoms (Furr et al., 2010). Older people are also more affected by tornadoes and high winds. For example, the 2011 tornadoes in the United States increased the number of hospitalizations and intensive care visits among seniors from 4% to 9% within 30 days after the events (Bell et al., 2018).
Perinatal Effects
Stress during pregnancy caused by a storm with prolonged effects on essential services can also have long-term consequences for the unborn child. For example, the Ice Storm Project examined the impacts of prenatal stress associated with the January 1998 ice storm that plunged 3 million people into the dark in Southern Quebec. Some homes had no electricity for up to 40 days during one of the coldest months of the year. In this study, children of pregnant women who were significantly affected (stress) by this event were at higher risk for several physical and mental health problems, including exhibiting warning signs of eating disorders (St-Hilaire et al., 2015) and autism (Walder et al., 2014). They are also more likely to have a weakened immune system (Veru et al., 2015), to develop asthma problems (Turcotte-Tremblay et al., 2014), to have a higher body mass index (Liu et al., 2016a), and, in young girls, to have their first period at an older age (Duchesne et al., 2017).
Crop and Animal Farmers
Crop and animal farmers typically have to stay on their property during power outages because they have to take care of their livestock and infrastructures. During the 1998 ice storm, 49% of Eastern Ontario farmers without electricity for a week or less reported symptoms of stress throughout the event, and this rate rose to 76% for farmers without electricity for more than 15 days (Sutherland & Glendinning, 2008). Furthermore, 13% of farmers without electricity for a week or less and 37% of those without electricity for more than 15 days experienced health effects other than persistent stress after the event, indicating an increasing impact associated with the duration of the power outage.
3.9.4
Storm and Precipitation Adaptation Measures
Share
3.9.4.1 Public Adaptation Measures
Action Plans and Multi-Barrier Approach for Water Management
Several measures are being taken to reduce the health risks associated with precipitation, particularly in the area of drinking water. A multi-barrier approach reduces the risk of water contamination for municipalities with a drinking water treatment facility, providing multiple operational redundancies in the event of system failure (Patrick, 2018) (see Chapter 7: Water Quality, Quantity, and Security). On a smaller scale, a participatory approach involving environmental representatives and experts could help better identify drinking water contamination risks and improve knowledge of watershed-related issues (Dykman, 2013). Alberta and Saskatchewan have adopted this type of collaborative approach in their planning to protect water sources in several Indigenous communities (Patrick, 2018). Integrated watershed management, used in several provinces across Canada, adheres to the principles of Indigenous governance, community engagement, as well as inclusive decision-making (Conservation Ontario, 2010; Canadian Council of Ministers of the Environment, 2016; Regroupement des organismes de bassins versants du Québec, 2019). It is also essential that future climate change impacts be considered in identifying risks to ensure the effectiveness and sustainability of the strategies put in place, particularly with respect to drinking water (Canadian Council of Ministers of the Environment, 2016).
Evacuations During Floods or Storms
Evacuations are one of the adaptation measures to reduce post-disaster damage. On an individual level, risk perception, past evacuation behaviours, and having an evacuation plan are all factors that make individuals more likely to evacuate, whereas likelihood of evacuation generally decreases as length of residency increases (Thompson et al., 2017). Issuing a mandatory evacuation notice also provides a greater incentive for people to evacuate than a voluntary evacuation notice. In addition to the influence of family and friends, having local community representatives issue this warning increases the likelihood of evacuation. Given their significant economic and psychosocial costs, evacuations should be limited to large-scale events. Evacuations may have more negative than positive health effects (Stares, 2014; Munro et al., 2017). To reduce these negative impacts, public authorities can encourage households to purchase essential items (non-perishable food, first aid kit, flashlight, etc.) for an emergency kit. Evacuation criteria could also be reviewed to better reflect the health consequences of evacuations. For long-term care facilities, nursing homes, and retirement homes, pre-emptive evacuations during storms should be avoided: several studies show that people evacuated from these institutions have a higher risk of mortality and hospitalization than people who remain (Pierce et al., 2017; Willoughby et al., 2017). The mortality rate in nursing home residents reach 17% up to six months after the evacuation (Willoughby et al., 2017). Nursing home residents who are at increased risk of experiencing the negative impacts of an evacuation are male residents aged over 80 years, who have greater functional and cognitive impairment and a number of comorbidities (Willoughby et al., 2017).
Emergency Response and Organizational Preparedness
Several measures would reduce the impact of extreme events on patients in long-term care facilities, such as adopting a disaster management plan, training staff on responding to extreme weather events, anticipation of patient needs following the event, and implementation of redundancy systems (central generator, etc.). Implementing a municipal or provincial disaster management plan that clearly delineates the responsibilities of each department and includes predetermined shelters and services reduces response time and increases response effectiveness (Mehiriz & Gosselin, 2016). Disaster simulation activities can also provide critical insight into system shortcomings and areas for improvement in managing such events (Bayntun et al., 2012). Having adequately trained and an appropriate number of staff in health facilities has been identified as the most important factor in ensuring the resilience of health services during disasters (Ryan et al., 2016). A 2016 Quebec study of health organizations indicated that they were much less prepared for certain frequent events such as flooding than for extreme heat events (Valois et al., 2017a). In addition, two studies have shown that Level 1 trauma centres in Canada are not adequately prepared for natural or human-caused disasters (e.g., terrorist attacks). In 2011, more than 40% of these centres, critical to emergency response, had not conducted a simulation exercise in the last two years, compared to 30% in 2019 (Gomez et al., 2011; Gabbe et al., 2020).
3.9.4.2 Infrastructural Adaptation Measures
Some measures related to residential or public infrastructure can help communities adapt to extreme storms or precipitation. Upgrading infrastructure, particularly roofs, to meet Canada’s building standards would reduce the vulnerability of infrastructure and its occupants to inclement weather. Other responses, such as installing weather-resistant shutters on windows, strengthening garage and front doors, and stabilizing outdoor objects, can prevent wind and the debris it carries from damaging property and endangering the people inside (Institute for Catastrophic Loss Reduction, 2012a). Regular roof repairs and maintenance ensure sufficient capacity and slope to withstand snow, ice, or sleet build-up and are therefore other options to reduce the risk of collapse (Institute for Catastrophic Loss Reduction, 2012b). However, these measures are not financially accessible to all owners.
Adaptation measures to reduce the likelihood of a power outage following a storm or heavy freezing rain include burying power lines, strengthening the support capacity of distribution poles and towers, integrating anti-cascading towers, and managing vegetation near power lines (Hydro-Québec, n.d.; Audinet et al., 2014). Restoring damaged features in disaster areas that are aesthetically and culturally significant was also proposed as a potential way to promote psychosocial health of disaster victims and the post-disaster recovery effort. In Ontario, those with a strong sense of belonging to the area were more involved in the recovery effort following a tornado that struck the rural community of Goderich in 2011, thereby fostering social cohesion (Silver & Grek-Martin, 2015).
3.10
Floods, Coastal Flooding, and Coastal Erosion
Share
3.10.1
Impacts of Climate Change on Floods, Coastal Flooding, and Coastal Erosion — Trends and Projections
Share
The frequency and severity of flooding, coastal flooding, and coastal erosion will be influenced by increased average and extreme precipitation, early snowmelt, higher sea levels, and reduced ice cover (Derksen et al., 2019; Greenan et al., 2019; Zhang et al., 2019). Warmer winter and spring temperatures, combined with more precipitation falling as rain rather than snow, are expected to result in earlier snowmelt in spring and earlier arrival of spring flooding, although the combined effect of this warming and of reduced snow cover on flooding is uncertain (Bonsal et al., 2019; Derksen et al., 2019). Due to changes in precipitation patterns, rainfall-related flooding is expected to increase while snowfall-related flooding is expected to decrease. In urban settings, increased extreme precipitation events will increase the risk of overflow6 and flash flooding.
The extent of sea-level rise will vary greatly across Canada depending on regional vertical land movement in response to the retreat of the last glacial ice sheet (Greenan et al., 2019). In the Atlantic Provinces, for example, sea levels are expected to rise more than the global average due to land subsidence (downward movement). Across Canada, sea levels are expected to rise for most of the Atlantic, Pacific, and Beaufort coasts, although some specific regions, such as Hudson Bay, may see lower sea levels due to the uplift of the land as a result of the uplift being higher than the rate of global sea-level rise (Greenan et al., 2019). Inland, there is no evidence that lake and wetland levels have changed at this time (Bonsal et al., 2019). However, accelerated evapotranspiration could lower the water level of inland water bodies if it exceeds the predicted increase in precipitation. Finally, wave activity in Atlantic and Arctic Canada will increase in response to the increased extent and duration of the ice-free period (Greenan et al., 2019). Combined with rising sea levels, this is expected to increase the number of coastal floods as well as the rate of coastal retreat. There is also a higher documented risk of fluvial, pluvial, and coastal flooding in Indigenous communities across the country. A recent study of 985 communities estimated that almost 22% of residential properties were at risk of flooding, with a 100-year recurrence (Thistlethwaite et al., 2020).
3.10.2
Effects of Floods, Coastal Flooding, and Coastal Erosion on Health
Share
3.10.2.1 Floods – Physical Impacts
Floods can cause injury, infect wounds, and result in electrocution, particularly during the recovery and cleanup period (Du et al., 2010; Lowe et al., 2013). Floods can also cause drowning and hypothermia, with greater danger during flash flooding. Mortality and injury are but a small part of the health burden caused by flooding in Canada, however. More significant effects are felt on physical and mental morbidity (Bartholdson & von Schreeb, 2018).
Floods have been associated with an increased incidence of water-borne, vector-borne, and other infectious diseases because it increases the likelihood of direct contact with water, drinking water contamination, and the reproduction of pathogens and disease vectors, such as insects and some pests (Funari et al., 2012; Brown & Murray, 2013; Cann et al., 2013; McMichael, 2015; Levy et al., 2016) (see Chapter 6: Infectious Diseases). Flooding in urban areas that results in sewer overflows promotes the spread of infectious agents, moulds, and other toxic contaminants that are harmful to human health. For the St. Lawrence River, the increase in overflows upstream (e.g., from the metropolitan Montréal area) is expected to increase Escherichia coli concentrations up to 87% by 2070 in drinking water sources downstream, such as those in the greater Quebec City area (Jalliffier-Verne et al., 2017). Flooded houses also support the development of fungi, bacteria, and moulds that increase the risk of developing and exacerbating skin, allergy, and respiratory problems (Tempark et al., 2013; Azuma et al., 2014; Saulnier et al., 2017).
3.10.2.2 Floods – Psychosocial Impacts
Floods impair living environments, disrupt social life, and increase financial uncertainty, given the associated material costs and economic disruption, often over many months. Flooding is therefore associated with compromised psychosocial impacts and quality of life (Turner et al., 2012a; Fernandez et al., 2015; French et al., 2019) (see Chapter 4: Mental Health and Well-Being). Among its manifestations, flooding increases the incidence of symptoms of post-traumatic stress, depression, and anxiety in addition to suicidal ideation in exposed individuals (Alderman et al., 2012; Turner et al., 2012a; Warsini et al., 2014; Fernandez et al., 2015; Munro et al., 2017; Graham et al., 2019). According to some studies, the prevalence of post-traumatic stress in populations exposed to flooding in the previous two years ranges from 9% to 53% (Alderman et al., 2012). Repeated flooding does not necessarily increase the level of post-traumatic stress and depression; however, little research has been done on its health effects (French et al., 2019). According to a 2017 survey of 200 households, 67% of the Eastern Montréal population affected by flooding reported feeling anxious or having trouble sleeping or concentrating, and that percentage was highest among evacuated individuals (CIUSSS du Centre-Sud-de-l’Île-de-Montréal, 2017). In addition, 24% of respondents felt that their mental health was fair or poor; that is nearly five times the prevalence of mental ill health than in Montréal’s population overall. Other studies using indices of psychological well-being have also observed an inverse relationship between these indices and the level of exposure to flooding (Fernandez et al., 2015). A study of approximately 100 residents affected by the 2014 floods in Burlington, Ontario, found that these residents experienced high levels of stress even three years after the flood (Decent, 2018). Nevertheless, the prevalence of psychological disorders can decrease and eventually resolve over time (Fernandez et al., 2015; Johal & Mounsey, 2016; Jermacane et al., 2018).
Exposure to flooding appears to increase excessive use of drugs, alcohol, or medication, and to decrease the sense of safety and belonging to the area (Tapsell & Tunstall, 2008; Fernandez et al., 2015). Relationships with neighbours, friends, and family can also deteriorate after a flood, as seen among seniors up to six months after the 1996 Saguenay flood (Maltais, 2006). The opposite can also be true, however. A survey of 963 people after the 2013 Calgary flood found that those who supported others during or after the flood had a higher sense of social cohesion (Hetherington et al., 2018).
The stress from flooding can also affect physical health (Saulnier et al., 2017). For example, during the flooding of the Richelieu River in Quebec in 2011, exposed individuals were 25% more likely to have a cardiac event afterward, although this increase was not seen in the 1996 Saguenay flooding (Vanasse et al., 2015; Vanasse et al., 2016a). Indeed, these two floods were very different in terms of the number of people affected and the duration of the event. Complications associated with diabetes as well as high blood pressure and nutrition also increase post-flood (Saulnier et al., 2017).
3.10.2.3 Coastal Flooding
The impacts of coastal flooding on the health of populations are different than the consequences of flooding and of storms. It is less likely than flooding to spread vector- or water-borne diseases, although related precipitation may increase the risk. Like regular flooding, coastal flooding may require prolonged evacuations and cause significant damage to public infrastructure and property. The psychosocial and physical impacts associated with financial stress and social disruption therefore theoretically apply as much to coastal flooding as they do to freshwater flooding (Lane et al., 2013; Manuel et al., 2015). That said, few studies have actually examined the health effects of this hazard outside the context of hurricanes or tropical storms, which do not really apply to Canada other than the Atlantic provinces, which can experience the tail-end of hurricanes (Lane et al., 2013; Hung et al., 2016; Ryan et al., 2016; Saulnier et al., 2017).
3.10.2.4 Coastal Erosion
Unless landslides occur, there is little or no risk of injury from coastal erosion. However, it has the potential to cause psychosocial impacts and damage property. The effects of coastal erosion on health are more difficult to assess, as they are felt in the medium to long term and, in theory, they allow for preventive responses. Like coastal flooding, little research has been done on the health effects of coastal erosion. In some areas, however, it is clear that coastal erosion and flooding will increase the isolated nature of regions by making roads impassable and damaging other infrastructures along the coastline (Drejza et al., 2015; Manuel et al., 2015). By reducing the habitability of affected regions, they could also lead to a permanent community breakdown and encourage the exodus of populations.
3.10.2.5 Indirect Impacts – Power Outages
Regular and coastal flooding can also cause power outages. Although the effects of power outages in warmer weather are less of a threat, given that dangers are mainly associated with using backup heating and being exposed to the cold (Lane et al., 2013; Klinger et al., 2014), power outages during shoulder seasons could increase these risks compared to a normal situation, since outdoor temperatures are not optimal during those seasons. Flooding has been associated with an increase in carbon monoxide poisoning before and during the event and even in the recovery phase (Waite et al., 2014). In addition, a lack of air conditioning due to a power outage could increase heat exposure during periods of intense heat.
3.10.3
Populations at Increased Risk to Floods, Coastal Flooding, and Coastal Erosion
Share
3.10.3.1 Age
Children and adolescents are also likely to experience symptoms of post-traumatic stress after a disaster, although it is unclear how much more affected they are than adults (Furr et al., 2010; Garcia & Sheehan, 2016; Lai et al., 2017). Based on two literature reviews, the risk appears to be higher for young girls than for young boys and for children and adolescents who lack social support (Garcia & Sheehan, 2016; Lai et al., 2017). Most related studies show that children tolerate low levels of post-traumatic stress over a long period of time (Lai et al., 2017). They seem to be less likely than adults to have post-traumatic stress symptoms worsen after an extreme event. In any case, this stress may have a significant impact on the child’s long-term development. Post-traumatic stress disorders in children have been associated with cognitive impairments, alcohol and drug problems, immunodeficiency, asthma, as well as learning, sleep, and behavioural problems (Garcia & Sheehan, 2016). Prenatal stress from flooding has also been associated with weight status in children (Dancause et al., 2015).
Seniors over 65 affected by a flood disproportionately experience symptoms of anxiety, depression and post-traumatic stress compared to prime-age adults (Leyva et al., 2017; Decent, 2018). Based on a systematic review, the risk of mortality and morbidity during and after a flood is particularly high among adolescents and young adults (aged 10 to 29) and among those over the age of 60 (Lowe et al., 2013).
3.10.3.2 Sex and Gender
After a flood, women appear to have an increased risk of experiencing psychological impacts, while men seem to be more likely to experience physical impacts, such as cardiac events (Lowe et al., 2013). Following the 2011 Calgary floods, new prescriptions for anti-anxiety medications and sleep aids increased by a factor of 1.64 and 2.32, respectively, among women (Sahni et al., 2016). In addition, women are more likely to experience domestic violence as a result of extreme events such as flooding, and women who experience post-flood violence are more likely to report depression (First et al., 2017).
3.10.3.3 Presence of Pre-Existing Diseases
People with pre-existing health problems are more susceptible to the effects of flooding (Lowe et al., 2013). During the 2011 flooding of the Richelieu River in Quebec, people with a history of cardiovascular disease were 70% more likely to experience a cardiac event following flooding, compared with 25% for all those affected (Vanasse et al., 2016a). Individuals taking medications are also at greater risk because access to them could be compromised during significant social disruptions such as flooding (Gaskin et al., 2017). Access to essential care for people with pre-existing physical or mental health problems could also be problematic. For post-traumatic stress, people with high levels of anxiety are more likely to experience high levels after extreme weather events, as seen after the 2011 floods in Calgary (Hetherington et al., 2018).
3.10.3.4 Indigenous Populations
First Nations and Métis peoples are particularly vulnerable to extreme events such as flooding, as they often live in isolated areas, with infrastructure in poor condition, and in low socio-economic settings (see Chapter 2: Climate Change and Indigenous Peoples’ Health in Canada). For example, between 2006 and 2016, nearly 67 First Nations communities experienced close to 100 flood events, causing substantial property and infrastructure damage, community service failures, and individual health and wellness impacts.
3.10.3.5 Rural Living and Low Socio-Economic Status
Municipalities with combined sewers (e.g., sewers that deliver both wastewater and storm water to a sewage treatment plant) are at increased risk of regular and wastewater overflows (Fortier, 2013). Areas affected by coastal erosion are also often remote or rural communities with low socio-economic status. These communities do not always have the financial or human resources to adapt to coastal hazards and therefore need external support (Chouinard et al., 2008). The proportion of seniors is also generally higher, and the current rural exodus and the aging population will continue to challenge the resilience of these communities (Manuel et al., 2015; Rapaport et al., 2015), while higher social cohesion and the ability to cope may lessen the psychological effects of flooding (Greene et al., 2015). In addition to residents, volunteers and emergency responders are also at risk to flood health effects during the recovery phase (Johanning et al., 2014).
3.10.3.6 Insurance
People without insurance are more likely to experience the psychosocial impacts of floods (Tunstall et al., 2006; Mulchandani et al., 2019). People without specific flood insurance often have a higher economic deprivation profile, given the costs of flood protection (Poussin et al., 2015; Koerth et al., 2017). The time it takes to contact insurance companies can also increase stress among people whose homes have been flooded (Maltais, 2006).
3.10.4
Floods, Coastal Flooding, and Coastal Erosion Adaptation Measures
Share
3.10.4.1 Individual Adaptation Measures
Adaptation Behaviours
At the individual level, infrastructure adaptation measures to protect against the consequences of floods include elevation of the house (e.g., electricity meter, doors, furniture, baseboards and electrical outlets), moving objects from the basement to upper levels, and waterproofing foundations in the home (Poussin et al., 2015; Koerth et al., 2017; Valois et al., 2020a). However, it is important to choose measures adapted to the characteristics of the home and its environment to avoid unintended consequences and damage (e.g., uplift during very significant floods due to waterproofing of foundations). Staying informed about whether one’s home is in a flood zone, and about flooding-related consequences and adaptation measures, taking stock of assets, and obtaining flood insurance are non-infrastructure measures that can be beneficial. According to a nationwide survey, however, only 6% of people were aware they are living in flood-risk area, while 30% have implemented measures to protect their property from flooding (Thistlethwaite et al., 2017). Insured individuals may feel they can engage in more risky behaviours or take fewer actions to protect themselves less from insured hazards. Insurance is also an unaffordable option for some low-income households. Making insurance premiums dependent on implementation of protection measures would provide an incentive for insured individuals to protect themselves further (Botzen et al., 2009). In any case, financial incentives are essential to encourage individual adaptation measures because exposed individuals may be aware of the risk without having means to adapt to it (Wachinger et al., 2013; Poussin et al., 2014). Support programs should be tailored to reduce the financial burden on low socio-economic and at-risk households.
Risk Perception
Several factors associated with individual perceptions can also influence the adoption of adaptation measures for coastal hazards. These include risk perception, the perceived effectiveness of an adaptation measure, the perception of control over implementing that measure, the estimated cost of implementing that measure, and the perceived individual responsibility for taking action (Bubeck et al., 2012; Kellens et al., 2013; Poussin et al., 2014; Valois et al., 2020a). The number of floods an individual has experienced in the past, factual knowledge of risks and adaptation measures, status as a homeowner, residing in a single-family home, and living permanently in a house increase an individual’s likelihood of adopting adaptation measures in a coastal environment (Koerth et al., 2017; Valois et al., 2019; Valois et al., 2020a). A sense of belonging to a living environment also intensifies risk perception for relatively frequent events (Bonaiuto et al., 2016). On the other hand, such a sense decreases the likelihood that an individual will move or evacuate, in addition to exacerbating any psychosocial impacts that might occur. Some people will also accept exposure to a risk because of habituation to the risk, or because they feel that the benefits of living in an at-risk nearshore area outweigh potential costs (Wachinger et al., 2013; Poussin et al., 2014; Koerth et al., 2017). A flood adaptation index is available that that can measure the extent of adaptation by linking pre- and post-flood adaptation and variables such as income, household type, and perception (Valois et al., 2019).
3.10.4.2 Public Adaptation Measures
Evacuations
Evacuations are often mandated by public authorities when flooding is expected or occurs. However, similar to other hazards discussed in this chapter, evacuations are not always an appropriate adaptation measure: several studies show adverse effects for evacuees compared to those who remained in place. In the United Kingdom, flood-affected people who remained at home were at lower risk of depression than evacuees (Munro et al., 2017). Evacuees had higher rates of depression, anxiety, and post-traumatic stress. The intensity of mental health effects varies with the duration of separation from the living environment and with income — low-income individuals were at higher risk (Lowe et al., 2013; Lamond et al., 2015; Munro et al., 2017). It is more difficult for people with reduced mobility or sensory and cognitive disabilities to evacuate or to prepare for and cope with flooding. As a result, there is a significant risk of injury and mortality among seniors during or after evacuation (Gamble et al., 2013; Thompson et al., 2017; Willoughby et al., 2017). These health consequences should be taken into account when public authorities make decisions about whether evacuation is the optimal solution. If evacuations are necessary, issuing an evacuation notice at least 12 hours in advance appears to reduce the psychosocial impacts of flooding. A study showed that people who did not receive a warning or who received one less than 12 hours’ notice before the event had a higher level of psychological distress (Munro et al., 2017).
Permanent evacuation, or relocation, may also be considered as a preventive measure. The health impacts of voluntary or forced relocation outside of an at-risk area are more significant for people with a strong sense of belonging to the area and community or with a strong local social network (Uscher‐Pines, 2009; Lowe et al., 2013; Munro et al., 2017). Employment stability and the costs associated with moving are important issues related to the vulnerability of lower-income individuals. A move within the same community limits effects on social connections, while public financial support for low-income people mitigates the consequences for this segment of the population. In the La Mitis region of Quebec, which was affected by major flooding in 2011, the government covered the costs of moving residents in areas at risk of coastal flooding or erosion to a nearby area specially built for that purpose, with a citizens’ support program managed by local authorities (Radio-Canada, 2018).
Preparation and Action Plan
Public weather alerts and other tools are available for individuals and public health authorities in Canada to use to prepare and plan for storms and floods (Government of Canada, 2019b). In terms of response, front-line and emergency management workers can increase their awareness of the relationships between domestic violence and disasters and of how to take action to help victims, including children (First et al., 2017). For people with physical or mental disabilities, involvement in emergency planning and response through organizations working with these groups increases their ability to adapt (Gaskin et al., 2017). Health services in municipalities at flood risk should have disaster contingency plans and strategies, particularly for flooding (Burton et al., 2016). These plans should include measures to train staff, anticipate patients’ medical needs during a disaster, a decision-making process that considers evacuations as a last resort, and systematic evaluation of disaster response effectiveness (Pierce et al., 2017). Social workers and other psychosocial health professionals should also be better trained to better respond to feelings of loss and grief caused by weather events (Fulton & Drolet, 2018). In addition, increased monitoring of infectious diseases by public health authorities during and after flooding would also be beneficial (McMichael, 2015; Burton et al., 2016).
3.10.4.3 Infrastructural Adaptation Measures
Regular updating of maps of flood-prone areas, flood-vulnerable areas, and coastal erosion zones is key to managing these risks. Alterations to the built environment can reduce the risks of floods and overflows. Rainwater management measures such as retention ponds and making the urban environment more permeable to runoff can decrease these risks by reducing the burden on water treatment systems and encouraging the absorption of rainwater, thereby decreasing the risk of overflows (Houghton & Castillo-Salgado, 2017). Requirements for such measures are found in some green building or neighbourhood development certifications, such as LEED, but not always. One study found that scenarios of moderately and intensely impervious urban surfaces can increase the risk of flooding two-fold and the risk of overflows four-fold, before taking climate change into account (Zimmermann et al., 2016). Making soil more permeable via green infrastructure are among the measures that could stabilize or reduce these risks (Farrugia et al., 2013; Lennon et al., 2014; Zimmermann et al., 2016). Increasing riparian planting by 20% to 40% can also reduce river peak flow levels by up to 19%, while increasing planting by 10% to 15% can reduce levels by up to 6% (Dixon et al., 2016) and reduce erosion as well as the loss of property values (Moudrak et al., 2018). Prohibiting building in at-risk coastal areas through zoning bylaws or other legal means could progressively reduce exposure to coastal hazards, with the gradual loss of acquired rights and mitigation of urban expansion into high-risk areas. Green infrastructure is also an effective measure to prevent or slow coastal erosion (Keesstra et al., 2018).
3.10.4.4 Evaluation of Floods, Coastal Flooding, and Coastal Erosion Adaptation Measures
Unfortunately, the effectiveness of floods, coastal flooding, and coastal erosion adaptation measures on health has not been assessed in the Canadian context and has undergone very limited assessment internationally (Burton et al., 2016). Actions taken by municipalities and provinces are still largely reactive rather than proactive, although a reverse trend is beginning to emerge (Manuel et al., 2015; Burton et al., 2016; Hurlbert & Gupta, 2016). Some adaptation measures may not be advantageous to implement in that their costs may exceed the benefits, especially in areas where the potential damage and likelihood of occurrence are relatively low. To be better able to assess costs and benefits, programs like the Flood Ready platform, the National Disaster Mitigation Program and organizations like FloodSmart Canada (http://floodsmartcanada.ca) are gathering detailed information to assist individuals, businesses, and the public sector to optimize investments in coastal hazard adaptation measures (Government of Canada, 2019a; Public Safety Canada, 2019). Assessing, mapping, and updating coastal risks to account for climate trends is also essential to better focus interventions. In Canada, this mapping predates the turn of the century and would benefit from an update (Henstra & Thistlethwaite, 2018). In Quebec, a number of impact and cost-benefit studies of coastal adaptation options led the provincial government and municipalities to implement a relevant adaptation program for the entire St. Lawrence River, Gulf, and Estuary (Bernatchez et al., 2015; Circé et al., 2016). This program includes stricter regulations and construction standards, along with compensation and relocation measures.
3.11
Landslides, Avalanches, and Thawing Permafrost
Share
3.11.1
Impacts of Climate Change on Landslides, Avalanches, and Thawing Permafrost — Trends and Projections
Share
A warmer, wetter climate generally increases the occurrence of landslides (Gariano & Guzzetti, 2016). Studies in Canada on the effects of climate change on landslides have mainly been conducted in British Columbia and seem to confirm that warming temperatures and increased precipitation have increased the frequency and magnitude of landslides over the past century (Jakob & Lambert, 2009; Geertsema, 2013; Gariano & Guzzetti, 2016).
The net effect of climate change on avalanches in Canada is unclear. Between 1981 and 2011, the number of avalanches reportedly decreased in Western Canada, while there does not appear to be a trend in Southern Quebec (Hetu et al., 2015; Sinickas et al., 2016). Warming temperatures, snow accumulation, freezing rain, wind strength, and the formation of a layer of frost or ice crystals at the beginning of the season affect the likelihood of avalanches and their intensity, which complicates projections of future impacts (Germain et al., 2009; Bellaire et al., 2016; Sinickas et al., 2016).
Permafrost covers nearly 40% of Canada’s land mass and extends under the Arctic Ocean. Projected warming of ground temperatures is expected to promote thawing of permafrost over large areas — up to 20% in Northern regions by 2090 (compared to 1990) (Derksen et al., 2019). A few regional observations indicate that permafrost temperature has increased by 0.1°C to 1°C per decade, with warming being greater in Arctic Canada than in sub-Arctic regions. Thermokarst7 formation has also been observed over large areas in Northern Canada, an environment characterized by subsidence due to thawing permafrost. The land area supported by permafrost in Canada could decrease by 16% to 20% under low-to-moderate GHG emission scenarios (IPCC AR4 scenarios A2 and B2, used in 2007) compared to 1990, with some estimates being even more pessimistic (Derksen et al., 2019). The circumpolar Northern region of permafrost contains carbon reserves equivalent to the total amount of carbon already in the atmosphere (Derksen et al., 2019). The projected thawing of permafrost could release massive amounts of GHGs into the atmosphere, contributing to the acceleration of climate change and its consequences.
3.11.2
Effects of Landslides, Avalanches, and Thawing Permafrost on Health
Share
3.11.2.1 Impacts of Landslides on Health
The risk of dying from a landslide is quite low in Canada and has decreased over the years while landslides seem to be increasing in number. From 1990 to 2018, 23 landslides caused fatalities across Canada, resulting in a total of 39 deaths, with an average of one to two deaths per year (Blais-Stevens et al., 2018). The probability of death is greater when landslides develop rapidly and when they affect people inside a building (Kennedy et al., 2015). Landslides can also result in some physical injuries and trauma, including cuts, bruises, concussions, and fractures. Some studies conducted outside of Canada (Italy, Greece, Puerto Rico, etc.) have also associated landslide exposure with an increased incidence of post-traumatic stress and deterioration of social cohesion up to two years after the event (Kennedy et al., 2015). However, these effects are generally observed during large-scale landslides, which are rare in Canada.
3.11.2.2 Impacts of Avalanches on Health
Physical Health
Avalanche-related health risks are primarily associated with the injuries and deaths they can cause. Across Canada, 123 people died as a result of an avalanche from 2009 to 2018 (Avalanche Canada, 2018). Avalanches pose a particular risk in Western Canada, with 102 of those 123 deaths occurring in British Columbia and 16 in Alberta, because mountain slopes in Western Canada are much steeper than the rest of the country. Asphyxia, severe trauma, and hypothermia account for the bulk of avalanche-related deaths (Boyd et al., 2009; Kornhall & Martens-Nielsen, 2016). In fact, one study found that avalanches were lethal in 23% of cases, with a 50% mortality rate when the victim was completely covered by snow (Kornhall & Martens-Nielsen, 2016).
Psychosocial Health
Avalanches can also have short- and long-term effects on the psychosocial health of affected people. A study in Iceland considered the psychosocial impacts on populations in two villages affected by deadly avalanches (Thordardottir et al., 2015). Some 16% of villagers affected by avalanches directly or indirectly had symptoms of post-traumatic stress related to the event 16 years after the event. Villagers were also at higher risk for sleep disorders and post-traumatic hyper-reactivity compared to a similar, unexposed population.
3.11.2.3 Effects of Thawing Permafrost on Health
Thawing permafrost is a hazard specific to Northern environments. The related health risks are more indirect than for avalanches and landslides — hazards that develop rapidly. Thawing permafrost is compromising the integrity of houses, public buildings, roads, and other infrastructures and Northern communities, such as many First Nations and Inuit communities, are already lacking infrastructure. They also depend on air transport to bring in food and essential goods such as medicine (Allard et al., 2012; Ford et al., 2014; Durkalec et al., 2015). In addition, thawing permafrost could affect the risk of waterborne disease by releasing infectious agents and significant concentrations of heavy metals such as mercury (Moquin & Wrona, 2015; Vonk et al., 2015; Schuster et al., 2018) (see Chapter 6: Infectious Diseases and Chapter 8: Food Safety and Security).
Across Canada, many Indigenous communities face serious water safety challenges due to inadequate water and wastewater systems, a lack of trained staff, and higher exposure to pollutants or environmental contaminants and many face short- and long-term boil water advisories (Wright et al., 2018; Indigenous Services Canada, 2020a; Indigenous Services Canada, 2020b). Thawing permafrost can increase exposure to health risks from contaminated water by further weakening water supply systems or water sources (Neegan Burnside Ltd., 2011). Finally, thawing permafrost can compromise the food security of Arctic communities, which use ice cellars dug from permafrost to safely store food, such as in the community of Inupiat, Alaska (U.S. Climate Resilience Toolkit, 2017). Biodiversity, and thus access to traditional food, will also be negatively affected by thawing permafrost, which may further affect local populations (Berteaux et al., 2016).
3.11.3
Populations at Increased Risk to Landslides, Avalanches, and Thawing Permafrost
Share
People living on clay soil or near steep slopes are at increased risk of landslides (Porter & Morgenstern, 2013; Macciotta & Lefsrud, 2018). Some international studies have also shown that women are more likely to experience symptoms of post-traumatic stress following a major landslide (Kennedy et al., 2015). People who practice snowmobiling, skiing, snowshoeing, winter hiking, and any other winter activities on mountainous terrain are the most exposed to avalanches (Boyd et al., 2009). Almost half of all avalanche deaths between 2009 and 2018 involved snowmobilers, and just over one-third involved skiers (Avalanche Canada, 2018); 88% of fatalities were males, a situation similar to most countries with snow (Page et al., 1999; Jamieson et al., 2010; Berlin et al., 2019).
For thawing permafrost, Northern and Indigenous populations are at increased risk given their highly exposed infrastructure (such as roads, drinking water systems, buildings, pipelines) and limited access to some essential resources due to remoteness. In particular, Indigenous Peoples living in areas vulnerable to thawing permafrost are at increased risk of negative health and social impacts, given existing social and health inequities, such as poverty, poor quality of housing and infrastructure, and disproportionate burden of disease (see Chapter 2: Climate Change and Indigenous Peoples’ Health in Canada). In addition, their proximity to nature and close connection to the land means that these climate change impacts affect their way of life and can destroy places that have cultural significance (Government of Nunavut, 2012). For example, in Inuit Nunangat,8 natural disturbances such as thawing permafrost, melting or thinning ice, and changes in sea level exacerbated the loss of Indigenous knowledge and skills related to hunting, road transportation, weather forecasting, and wildlife movement. These changes increase the risk of unintentional injury or death and the need for search-and-rescue missions, reduced access to traditional food, and impacts on mental health.
3.11.4
Landslides, Avalanches, and Thawing Permafrost Adaptation Measures
Share
One of the first adaptation measures for landslides, avalanches, and permafrost melt is the production and updating of risk and vulnerability maps. Monitoring these events (e.g., avalanche) is also critical (Canadian Space Agency, 2016; Avalanche Canada, 2018; MFFP, 2019).
3.11.4.1 Landslide Adaptation Measures
Given the low risk of death from landslides, major adaptation measures such as relocation would only be warranted in the most at-risk areas (Macciotta & Lefsrud, 2018). Natural Resources Canada offers a best-practices guide for assessing landslide risks based on physical, legal, economic, and risk acceptance criteria (Porter & Morgenstern, 2013). In addition, preventive warning systems that take account of the hydrological and physical properties of soils and precipitation forecasts have been developed in other countries and may be an option for limiting the exposure of populations to this risk in some cases (Chae et al., 2017).
3.11.4.2 Avalanches Adaptation Measures
The assessment of avalanche risk areas and the consequent adaptation of land-use planning have significantly reduced the number of deaths inside buildings (Hetu et al., 2015; Germain, 2016). In addition to choosing building locations strategically, the reforestation of the slopes is another management measure that reduces the risk of avalanche by obstructing the wind and avalanche corridor (Hetu et al., 2015). A downward trend in the risk of mortality has also been observed since avalanche-related weather monitoring organizations were created to raise public awareness of avalanche-related risks and provide mountain safety training (Avalanche Canada, 2018). Avalanches can be activated pre-emptively in a controlled manner before they become a threat, or when the risk becomes too high, as in Glacier National Park in the Canadian Rockies (Parks Canada, 2018).
3.11.4.3 Thawing Permafrost Adaptation Measures
Work by Natural Resources Canada has made it possible to characterize and determine temperature thresholds for thawing permafrost (Labbé et al., 2017). Adaptation measures such as using surfaces with high albedo, placing ventilation ducts or heat sinks below infrastructure, installing adjacent air convection levees or thermosyphons, and building an overhead solar shelter can cool the soil and thereby mitigate infrastructure damage (Calmels et al., 2016; Doré et al., 2016). Many of these measures have been implemented in Northern Canadian communities, although there is no national adaptation strategy to direct such activities (Labbé et al., 2017). The Alaska Highway in the Yukon is a well-documented example of risk characterization and subsequent infrastructure stabilization through adaptation (Stephani et al., 2014; Calmels et al., 2016). Characterizing permafrost-related risks can also better inform land-use planning. In Arviat, Nunavut, for example, an assessment has increased decision makers’ awareness of the risks posed by thawing permafrost and facilitated adaptation cooperation among stakeholders (Flynn et al., 2018). The ArcticNet Network of Centres of Excellence of Canada has been conducting a major research program on these impacts and applicable solutions for the past 15 years (ArcticNet, 2021). For example, a 2013 mapping of discontinuous permafrost areas in Nunavik allowed for risk-informed planning for infrastructure and health facilities for all levels of government involved (L’Hérault et al., 2013).
3.12
Gaps in the Literature and Uncertainty of Scientific Evidence Related to the Impacts on Health of Natural Hazards Influenced by Climate Change
Share
This section details the main gaps in the scientific literature and the uncertainties that remain about the impacts of natural hazards on health, individuals most at risk, and how they can protect themselves as the climate continues to warm in Canada.
3.12.1
Health and Natural Hazards Data
Share
Several uncertainties persist in the literature about the impacts on health of natural hazards influenced by climate change. The projected health effects are highly dependent on GHG emission scenarios, demographic changes, and the future levels of adaptation by individuals, communities, and institutions, for example, health systems and facilities (see Chapter 10: Adaptation and Health System Resilience). These projections must therefore be interpreted with caution, since significant variability is to be expected, based on these factors. The literature also contains some conflictual findings regarding natural hazard impacts on health in the context of climate change. They are included in this chapter when applicable. The processes leading to health effects are also often indirect and complex. Some effects may not be evident or explored in studies because of the large number of variables and their complex interactions. Experimental (e.g., clinical studies) or quasi-experimental9 designs are particularly difficult — and in some cases impossible — to implement to assess the effects of climate change. Designs are often observational or cross-sectional and are therefore offer slightly less robust evidence, although still acceptable for understanding risks and adaptation planning. In contrast, several rigorous meta-analyses and literature reviews have been documented. There exists an imbalance in researched topics and in the quality of documented studies, and a number of gaps remain. Nevertheless, the number of studies available for most natural hazards influenced by climate change is substantial and for the most part sufficient to provide a clear characterization of current health impacts in the short term.
However, climate impact models do not yet, or rarely, take health into account in their impact simulations, leading to uncertainty about projected global impacts (Gosling et al., 2017). In addition, these models do not take adaptation measures into account, resulting in additional uncertainty (Gosling et al., 2017).
3.12.2
Type of Natural Hazards Considered
Share
There are a number of gaps in the scientific literature regarding the health effects of natural hazards in Canada. First, a number of natural hazards are under-represented. Health effects not directly associated with temperature, infectious diseases, or air quality are generally less well studied. Research on droughts, coastal erosion, coastal flooding, landslides, and thawing permafrost typically focuses on assessment methods or economic and ecological damage, and not on health impacts. The small size of the affected populations also makes health impact and vulnerability studies more difficult to conduct methodologically.
3.12.3
Direct and Indirect Impacts on Health
Share
Most of the direct, but especially indirect, effects of these hazards on health, as described in this chapter, should be analyzed in more detail and for their specific characteristics. Although mental health impacts (post-traumatic stress, depression, etc.) are being studied more and more, the impacts of various hazards on social cohesion, environmental degradation, population movements, and financial insecurity are unknown and remain to be discovered. It is important to assess these psychosocial health effects, as they indirectly affect the physical health and adaptive capacity of affected individuals (see Chapter 4: Mental Health and Well-Being).
3.12.4
Impacts of Combined Natural Hazard Events
Share
In Canada, very few studies have focused on the effect of combined natural hazards occurring simultaneously or successively on population health. Assessing the health and social impacts associated with the repeated exposure to extreme events on the same populations is rare and should be prioritized given that climate change is expected to increase the frequency of many extreme weather events and disasters, thereby increasing the probability of combined and/or successive events. Examples of past events in Canada include the successive exposure to floods (2017 and 2019) and tornadoes or high winds (2018) in the Gatineau/Ottawa area (CRC, 2020a), and wildfires (2016) and floods (2020) in Fort McMurray, Alberta (CRC, 2020b). The successive extreme heat events that struck Eastern Canada in 2020 are another example. Not only are more studies of the health effects of such combined events needed, but expected future trends also need to be projected. Traditional risk assessment assesses one danger/hazard at a time, which can lead to an underestimated risk for natural hazards events that often depend on each other (e.g., extreme heat and wildfires), are fed by the same hydro-meteorological variables (Zscheischler et al., 2018), or combine to overwhelm adaptive capacities that protect health. Climate projections would also benefit from the analysis of compound events, such as combined (or repeated) extreme heat event projections, which are expected to be amplified (Baldwin et al., 2019).
3.12.5
Cascading Impacts of Hazards and Health System Impacts
Share
Little research has yet been conducted on the cumulative impacts of natural hazards that can affect health, such as the likelihood of a power outage causing a water or medication shortage or road accidents due to a traffic light outage. Assessing the health system’s ability to cope with natural hazards is also essential, albeit poorly documented, to avoid disrupting services or overloading equipment or staff, particularly in areas that are rural or remote from urban centres. A health system that is itself vulnerable to natural hazards could exacerbate the health effects of at risk populations by being unable to meet the demand for care, medication, and social services (see Chapter 10: Adaptation and Health System Resilience). The current COVID-19 pandemic also illustrates a situation in which an already overloaded health system may have to simultaneously deal with the effects of a hurricane or extreme heat events.
3.12.6
Behaviours and Lifestyle
Share
The effects of climate change on behaviour and lifestyle should require further study. For example, an analysis of the effects of heat and precipitation on physical activity, outdoor activity, travel habits, eating, social interactions, criminal behaviour, emotional strain, cognitive ability, and choice of living area are essential for a full and representative assessment of the consequences of climate change, but little related data are available for Canada and elsewhere in the world.
3.12.7
Assessment of Adaptation Measures
Share
Retrospective assessment of the health effects of measures to adapt to natural hazards is also lacking, with the exception of greening. The scientific literature focuses more on health effects based on exposure and vulnerability to hazards. In the absence of a more accurate assessment, health effects must be inferred from the impacts of adaptation measures on the frequency, location, intensity, and timing of the natural hazards, which have been studied more extensively. Even in this literature, studies rarely control for implemented adaptation measures and individual or social adaptive abilities, or else do so indirectly through socio-economic factors, such as income and education. Individuals respond in one way or another to extreme heat, intense cold, smog episodes, humidity, and precipitation by reducing their time outdoors, for example, which influences observed health effects.
3.12.8
Economic Impacts of Health Effects and Adaptation and Mitigation Measures
Share
Although there are cost-benefit analyses for select climate change adaptation and mitigation measures, they fail to take into account health benefits associated with them. Estimates of the monetary value of the health benefits of proposed measures, including avoided health care costs, could help justify their adoption and implementation. Decision makers require information about whether costly adaptation measures would have sufficient economic payback, for example, the benefits of reducing fossil fuel combustion (less GHGs, less air pollution) compared to the costs of building infrastructure (bicycle path, tram) or setting up a monitoring system for health impacts. As well, there are very few studies that highlight the level of climate change adaptation and preparedness, and effectiveness of specific measures, whether at the municipal, provincial, or national level; yet these preparations and adaptations can greatly reduce the medical costs associated with natural disasters, in particular.
3.12.9
Relative Importance of Vulnerability and Protection Factors
Share
Although vulnerability is central to the literature on the health impacts of natural hazards and adaptation to climate change, further research is needed to better understand and rank vulnerability factors in order to effectively prioritize adaptation measures. The assessment of the interactions between these factors and their cumulative effects on health outcomes in a climate change context is also lacking. The same applies to protective factors and their interactions with vulnerability factors. Currently, the way vulnerability is conceptualized is misunderstood, especially regarding social cohesion, sense of belonging, education, and certain cultural or cognitive factors.
3.12.10
Equitable Representation in the Literature
Share
Some populations at higher risk from the health effects of natural hazards are studied less than others, particularly those already experiencing health inequities (see Chapter 9: Climate Change and Health Equity). People experiencing homelessness, people who have pre-existing chronic diseases or mental illness, people with reduced mobility, racialized populations, and socially isolated individuals are less represented in the literature compared to men, women, low-income individuals, children, workers, and seniors.
Sex is often included in impact studies,10 and each sex may have different vulnerability factors, but it is not clear whether one particular sex is more vulnerable overall. Consideration for gender11 and 2SLGBTQQIA+ populations are almost completely absent from the scientific literature on climate change (see Chapter 9: Climate Change and Health Equity).
3.12.11
Indigenous Populations
Share
The literature on how climate change will impact Indigenous populations living in Canada is uneven in terms of population and geographic focus. Most research is on Inuit populations and the Canadian Arctic, while studies of people living in Southern Canadian or urban areas, and of Métis peoples across Canada, are sparse. While there is more research on Northern Indigenous populations, they are less documented than the general populations living in Southern Canada. In addition, significant research gaps exist about climate change impacts on the health of First Nations communities in the Prairies and the Atlantic provinces.
The vulnerability factors that increase risks of health impacts of First Nations, Inuit, and Métis peoples and the impacts of hazards may differ in important aspects from non-Indigenous populations (e.g., pervasive health inequalities, inequities, and determinants of health, including a shared history of colonization) and require more research, as do the factors on the determinants of adaptive capacity needed to build greater resilience to future impacts. Furthermore, research on Indigenous communities is seldom Indigenous-led, which can contribute to a sometimes biased interpretation of research findings on impacts or vulnerability to natural hazards.
3.12.12
Factors Supporting Adaptation
Share
Political, societal, and structural factors that support effective adaptation to natural hazards, although studied elsewhere, have not been thoroughly assessed in a Canadian context. Factors influencing whether and how decision makers within and outside the health sector implement climate change adaptation measures are not well documented in a Canadian context. Legal and administrative organization, strategic planning, communication between different sectors and departments, resource allocation, windows of opportunity, the role of public opinion, as well as assessment and prioritization methods, are all relevant topics that should be studied more in-depth to facilitate adaptation to climate change and encourage optimal governance.
3.12.13
Communication on Climate Change
Share
Strategies and measures to communicate climate change also requires further study in Canada. Knowledge of risk and adaptation measures influences the adoption of preventive behaviours. Thus, the use of the most effective communication tools and messages to reach populations at increased risk, who generally have less means to adapt, and the tailoring of messages according to each subpopulation are essential. Communication efforts related to climate change and health are not currently being assessed in Canada. Evaluation of such efforts would make it possible to optimize the impacts of awareness campaigns. Social marketing approaches and techniques are a potentially powerful tool to improve the effectiveness of climate change and health communication, but are not currently being widely utilized (Daignault et al., 2018). A better understanding of the psychological processes that lead individuals to adopt adaptation measures would help in efforts by public health officials to better tailor messages such as, for example, framing the issue to emphasize opportunities and benefits to encourage action. Several social psychology models, such as the theory of planned behaviour or the protection motivation theory, can be used for this purpose.
In summary, analysis of the impacts of natural hazards on health, risk factors, and vulnerability factors, as well as adaptation measures, need to successfully plan for climate change, is still piecemeal in Canada, despite more than 15 years of work and growing interest in this area. More research should be undertaken to fill these gaps.
3.13
Conclusion
Share
This chapter discusses the impacts of natural hazards influenced by climate change on the health of Canadians with a special focus on populations at increased risk. All of the natural hazards identified already have significant impacts on people’s health, some major, and these impacts are expected to become more intense in the coming years in the absence of further adaptation measures.
A few years ago, an external assessment noted that, while several provinces have adopted climate change action plans that recognize the impacts of climate change on population health, most remained in the early stages of adapting to the health impacts of climate change, with responses that are fragmented or focused on a limited number of hazards, particularly heat (Austin et al., 2015). Moreover, a provincial and federal auditors general report in 2018 criticized the limited progress on risk assessment and the lack of detailed adaptation plans across the country, despite some tangible successes (Office of the Auditor General of Canada, 2018). As extreme meteorological events constitute the most important element of climate change risks, this conclusion remains relevant for natural hazards.
Several adaptation measures do exist and some are being implemented by health authorities; they can be adopted more widely to reduce the effects of hazards on the health of Canadians, as this chapter has shown. However, monitoring and evaluation of these measures as they are implemented should be undertaken in the coming years to gain more evidence of their effectiveness and efficiency in diverse contexts and populations. Documenting and evaluating on a regular basis our health system risk levels and preparedness for natural hazards events should thus become a top priority, along with monitoring the implementation of preventive measures to reduce risks, especially for vulnerable populations. Preparing detailed adaptation plans, region by region throughout the country, would constitute an important first step towards improved preparedness.
A very similar conclusion emerged from a recent international review that suggested inclusion of vulnerable subpopulations is low across all actions and diffusion of adaptation across sectors remains underdeveloped (Berrang-Ford et al., 2019). These authors also argue that an important disconnection exists between adaptation goals and the instruments and means proposed for implementation and reporting, including in Canada. Typically, preliminary actions (scenarios, conceptual tools, guides, assessment of potential impacts, etc.) far outweigh the systematic implementation of practical measures (financial support, technology, assessment of measures, etc.) by health authorities (Lesnikowski et al., 2015; Lesnikowski et al., 2016). Furthermore, significant regional differences exist in efforts to understand and adapt to the health impacts of national hazards in Canada.
At the municipal level, an assessment of the climate change plans for the 63 most-populated cities in Canada found that GHG mitigation rather than adaptation measures were being prioritized, while the assessment of both types of measures in the plans, their implementation, and the involvement of a variety of stakeholders were lacking (Guyadeen et al., 2019). Ultimately, the current pace of implementation of adaptation measures to reduce the health impacts of natural hazards may be insufficient to substantially mitigate the future effects of climate change, as highlighted by recent dramatic events such as the 2021 summer extreme heat and severe wildfires in Western Canada, and their effects. Redoubling efforts to prepare for climate change is therefore essential to ensure sustainable health in all Canadian communities and regions.
Excess mortality is defined in this study as all-cause mortality due to non-optimal temperatures, with optimal temperature considered the temperature at which the minimum mortality is observed.
↩
Albedo is the ability to reflect light energy; it is measured on a unitless scale ranging from 0 (total energy absorption, such as black surfaces) to 1 (total reflection, such as a mirror).
↩
The stratosphere is the second layer of the atmosphere and contains the ozone layer, which is different from ground-level or tropospheric ozone — a source of air pollution in the lower atmosphere.
↩
PM2.5 is particulate matter (PM) with a median diameter of 2.5 microns or less. PM2.5 can penetrate deeply into human lungs.
↩
Overflows of raw, untreated sewage into rivers and other possible sources of potable water can occur when extreme rainfall causes the capacity of combined sewers — sewers that transport both sewage and stormwater — to be exceeded (Ottawa Riverkeeper, 2020).
↩
Thermokarst refers to irregular topographies related to ice-rich thawing permafrost (Derksen et al., 2019).
↩
Inuit Nunangat is the Inuit homeland in Canada and is comprised for four regions: the Inuvialuit Settlement Region (northern Northwest Territories), Nunavut, Nunavik (northern Quebec) and Nunatsiavut (northern Labrador).
↩
A quasi-experimental design describes pre-post, non-randomized studies (i.e., participants were not assigned randomized treatments, for example, unlike clinical studies).
↩
In Western science, sex is typically considered binary (male and female), which overlooks intersex individuals.
↩
Gender refers to the socially constructed roles assigned to men and women. In Western science, gender is commonly conflated with sex, and presented as binary (man and woman), overlooking non-binary individuals.
↩
References
Abbasi, S. (2014). Adaptation to drought in Saskatchewan rural communities : A case study of Kindersley and Maidstone, Saskatchewan [Master’s Thesis, University of Saskatchewan]. University of Saskatchewan. Retrieved from http://hdl.handle.net/10388/ETD-2014-01-1385 ↩
Achakulwisut, P., Mickley, L., & Anenberg, S. (2018). Drought-sensitivity of fine dust in the US Southwest : Implications for air quality and public health under future climate change. Environmental Research Letters, 13(5), 054025.
↩
Acharya, P., Boggess, B., & Zhang, K. (2018). Assessing heat stress and health among construction workers in a changing climate : A review. International Journal of Environmental Research and Public Health, 15(2). https://doi.org/10.3390/ijerph15020247 ↩
Adam-Poupart, A., Smargiassi, A., Busque, M.-A., Duguay, P., Fournier, M., Zayed, J., & Labreche, F. (2014). Summer outdoor temperature and occupational heat-related illnesses in Quebec (Canada). Environmental Research, 134, 339‑344. https://doi.org/10.1016/j.envres.2014.07.018 ↩
Adam-Poupart, A., Smargiassi, A., Busque, M.-A., Duguay, P., Fournier, M., Zayed, J., & Labrèche, F. (2015). Effect of summer outdoor temperatures on work-related injuries in Quebec (Canada). Occupational & Environmental Medicine, 72(5), 338‑345.
↩
Adam-Poupart, A., Nicolakakis, N., Anassour Laouan Sidi, E., Berry, P., Campagna, C., Chaumont, D., Hamel, D., Labrèche, F., Sassine, M.-P., Smargiassi, A., Zayed, J. (2021). Climate change and heat vulnerabilities of Canadian workers: Focus on the Central and Western provinces of Canada. Institut national de santé publique du Québec.
↩
Adetona, O., Reinhardt, T. E., Domitrovich, J., Broyles, G., Adetona, A. M., Kleinman, M. T., Ottmar, R. D., & Naeher, L. P. (2016). Review of the health effects of wildland fire smoke on wildland firefighters and the public. Inhalation Toxicology, 28(3), 95‑139.
↩
Advisory Committee on Homelessness. (2018). Final Report of the Advisory Committee on Homelessness on the Homelessness Partnering Strategy. Employment and Social Development Canada.
↩
Agyapong, V. I. O., Hrabok, M., Juhas, M., Omeje, J., Denga, E., Nwaka, B., Akinjise, I., Corbett, S. E., Moosavi, S., Brown, M., Chue, P., Greenshaw, A. J., & Li, X.-M. (2018). Prevalence rates and predictors of generalized anxiety disorder symptoms in residents of Fort McMurray six months after a wildfire. Frontiers in Psychiatry, 9, 345. https://doi.org/10.3389/fpsyt.2018.00345 ↩
Alberini, A., Gans, W., Alhassan, M. (2011). Individual and public-program adaptation : Coping with heat waves in five cities in Canada. International Journal of Environmental Research and Public Health, 8(12), 4679‑4701. https://doi.org/10.3390/ijerph8124679 ↩
Albert-Green, A., Dean, C. B., Martell, D. L., & Woolford, D. G. (2013). A methodology for investigating trends in changes in the timing of the fire season with applications to lightning-caused forest fires in Alberta and Ontario, Canada. Canadian Journal of Forest Research, 43(1), 39‑45. https://doi.org/10.1139/cjfr-2011-0432 ↩
Ali, A. M., & Willett, K. (2015). What is the effect of the weather on trauma workload? A systematic review of the literature. Injury, 46(6), 945‑953. https://doi.org/10.1016/j.injury.2015.03.016 ↩
Allard, M., Lemay, M., Barrette, C., L’Hérault, E., Sarrazin, D., Bell, T., & Doré, G. (2012). Permafrost and climate change in Nunavik and Nunatsiavut : Importance for municipal and transportation infrastructures. In M. Allard, & M. Lemay (Eds.), Nunavik and Nunatsiavut: From science to policy. An Integrated Regional Impact Study (IRIS) of climate change and modernization, 171‑197. Quebec City, QC.
↩
Almendra, R., Santana, P., & Vasconcelos, J. (2017). Evidence of social deprivation on the spatial patterns of excess winter mortality. International Journal of Public Health, 62(8), 849‑856.
↩
Arbuthnott, K., Hajat, S., Heaviside, C., & Vardoulakis, S. (2016). Changes in population susceptibility to heat and cold over time : Assessing adaptation to climate change. Environmental Health, 15(1), S33.
↩
Askew, A. E., & Bowker, J. M. (2018). Impacts of climate change on outdoor recreation participation : Outlook to 2060. Journal of Park & Recreation Administration, 36(2), 97‑120.
↩
Astell-Burt, T., Feng, X., & Kolt, G. S. (2014). Neighbourhood green space and the odds of having skin cancer : Multilevel evidence of survey data from 267072 Australians. Journal of Epidemiology and Community Health, 68(4), 370‑374. https://doi.org/10.1136/jech-2013-203043 ↩
Audinet, P., Amado, J.-C., & Rabb, B. (2014). Climate risk management approaches in the electricity sector : Lessons from early adapters. In A. Troccoli, L. Dubus, & S. E. Haupt (Eds.), Weather Matters for Energy (p. 17‑64). New York, NY: Springer. https://doi.org/10.1007/978-1-4614-9221-4_2 ↩
Auger, N., Bilodeau-Bertrand, M., Labesse, M. E., & Kosatsky, T. (2017a). Association of elevated ambient temperature with death from cocaine overdose. Drug and Alcohol Dependence, 178, 101‑105. https://doi.org/10.1016/j.drugalcdep.2017.04.019 ↩
Auger, N., Fraser, W. D., Arbour, L., Bilodeau-Bertrand, M., & Kosatsky, T. (2017b). Elevated ambient temperatures and risk of neural tube defects. Occupational and Environmental Medicine, 74(5), 315‑320. https://doi.org/10.1136/oemed-2016-103956 ↩
Auger, N., Fraser, W. D., Sauvé, R., Bilodeau-Bertrand, M., & Kosatsky, T. (2017c). Risk of congenital heart defects after ambient heat exposure early in pregnancy. Environmental Health Perspectives, 125(1), 8‑14. https://doi.org/10.1289/EHP171 ↩
Auger, N., Fraser, W. D., Smargiassi, A., Bilodeau-Bertrand, M., & Kosatsky, T. (2017d). Elevated outdoor temperatures and risk of stillbirth. International Journal of Epidemiology, 46(1), 200‑208. https://doi.org/10.1093/ije/dyw077 ↩
Auger, N., Fraser, W. D., Smargiassi, A., & Kosatsky, T. (2015). Ambient heat and sudden infant death : A case-crossover study spanning 30 years in Montreal, Canada. Environmental Health Perspectives, 123(7), 712‑716. https://doi.org/10.1289/ehp.1307960 ↩
Auger, N., Naimi, A. I., Smargiassi, A., Lo, E., & Kosatsky, T. (2014). Extreme heat and risk of early delivery among preterm and term pregnancies. Epidemiology, 25(3), 344. https://doi.org/10.1097/EDE.0000000000000074 ↩
Auger, N., Potter, B. J., Smargiassi, A., Bilodeau-Bertrand, M., Paris, C., & Kosatsky, T. (2017e). Association between quantity and duration of snowfall and risk of myocardial infarction. CMAJ: Canadian Medical Association Journal, 189(6), E235‑E242. https://doi.org/10.1503/cmaj.161064 ↩
Auger, N., Rhéaume, M.-A., Bilodeau-Bertrand, M., Tang, T., & Kosatsky, T. (2017f). Climate and the eye : Case-crossover analysis of retinal detachment after exposure to ambient heat. Environmental Research, 157, 103‑109. https://doi.org/10.1016/j.envres.2017.05.017 ↩
Austin, S. E., Ford, J. D., Berrang-Ford, L., Araos, M., Parker, S., & Fleury, M. D. (2015). Public health adaptation to climate change in Canadian jurisdictions. International Journal of Environmental Research and Public Health, 12(1), 623‑651. https://doi.org/10.3390/ijerph120100623 ↩
Azuma, K., Ikeda, K., Kagi, N., Yanagi, U., Hasegawa, K., & Osawa, H. (2014). Effects of water-damaged homes after flooding : Health status of the residents and the environmental risk factors. International Journal of Environmental Health Research, 24(2), 158‑175. https://doi.org/10.1080/09603123.2013.800964 ↩
Baert, V., Gorus, E., Mets, T., Geerts, C., & Bautmans, I. (2011). Motivators and barriers for physical activity in the oldest old : A systematic review. Ageing Research Reviews, 10(4), 464‑474. https://doi.org/10.1016/j.arr.2011.04.001 ↩
Bai, L., Li, Q., Wang, J., Lavigne, É., Gasparrini, A., Copes, R., Yagouti, A., Burnett, R. T., Goldberg, M. S. & Cakmak, S. (2017). Increased coronary heart disease and stroke hospitalizations from ambient temperatures in Ontario. Heart, 104(8), 673‑679.
↩
Bai, L., Li, Q., Wang, J., Lavigne, E., Gasparrini, A., Copes, R., Yagouti, A., Burnett, R. T., Goldberg, M. S., Villeneuve, P. J., Cakmak, S., & Chen, H. (2016). Hospitalizations from hypertensive diseases, diabetes, and arrhythmia in relation to low and high temperatures : Population-based study. Scientific Reports, 6, 30283. https://doi.org/10.1038/srep30283 ↩
Bais, A. F., Lucas, R. M., Bornman, J. F., Williamson, C. E., Sulzberger, B., Austin, A. T., Wilson, S. R., Andrady, A. L., Bernhard, G., & McKenzie, R. L. (2018). Environmental effects of ozone depletion, UV radiation and interactions with climate change : UNEP Environmental Effects Assessment Panel, update 2017. Photochemical & Photobiological Sciences, 17(2), 127‑179.
↩
Bais, A. F., McKenzie, R., Bernhard, G., Aucamp, P., Ilyas, M., Madronich, S., & Tourpali, K. (2015). Ozone depletion and climate change : Impacts on UV radiation. Photochemical & Photobiological Sciences, 14(1), 19‑52.
↩
Baldwin, J. W., Dessy, J. B., Vecchi, G. A., & Oppenheimer, M. (2019). Temporally compound heat wave events and global warming: An emerging hazard. Earth’s Future, 7(4), 411-427.
↩
Barn, P. (2014). Evidence review: Home and community clean air shelters to protect public health during wildfire smoke events (C. Elliott, & K. Rideout, eds). BC Centre for Disease Control.
↩
Barnett, A. G., Tong, S., & Clements, A. (2010). What measure of temperature is the best predictor of mortality? Environmental research, 110(6), 604‑611. https://doi.org/10.1016/j.envres.2010.05.006 ↩
Barreca, A. I. (2012). Climate change, humidity, and mortality in the United States. Journal of Environmental Economics and Management, 63(1), 19‑34. https://doi.org/10.1016/j.jeem.2011.07.004 ↩
Bartholdson, S., & von Schreeb, J. (2018). Natural Disasters and Injuries: What Does a Surgeon Need to Know? Current Trauma Reports, 4(2), 103–108. https://doi.org/10.1007/s40719-018-0125-3 ↩
Basu, R., Pearson, D., Malig, B., Broadwin, R., & Green, R. (2012). The effect of high ambient temperature on emergency room visits. Epidemiology, 23(6), 813. https://doi.org/10.1097/EDE.0b013e31826b7f97 ↩
Bayentin, L., El Adlouni, S., Ouarda, T. B., Gosselin, P., Doyon, B., & Chebana, F. (2010). Spatial variability of climate effects on ischemic heart disease hospitalization rates for the period 1989-2006 in Quebec, Canada. International Journal of Health Geographics, 9, 5. https://doi.org/10.1186/1476-072X-9-5 ↩
Bayntun, C., Rockenschaub, G., & Murray, V. (2012). Developing a health system approach to disaster management: A qualitative analysis of the core literature to complement the WHO Toolkit for assessing health-system capacity for crisis management. PLoS Currents, 4, e5028b6037259a. https://doi.org/10.1371/5028b6037259a ↩
Beaudoin, M., & Gosselin, P. (2016). An effective public health program to reduce urban heat islands in Québec, Canada. Revista Panamericana de Salud Publica = Pan American Journal of Public Health, 40(3), 160–166.
↩
Beaudoin, M., & Levasseur, M.-È. (2017). Verdir les villes pour la santé de la population. Institut national de santé publique du Québec.
↩
Beelen, R., Raaschou-Nielsen, O., Stafoggia, M., Andersen, Z. J., Weinmayr, G., Hoffmann, B., Wolf, K., Samoli, E., Fischer, P., Nieuwenhuijsen, M., Vineis, P., Xun, W. W., Katsouyanni, K., Dimakopoulou, K., Oudin, A., Forsberg, B., Modig, L., Havulinna, A. S., Lanki, T., … Hoek, G. (2014). Effects of long-term exposure to air pollution on natural-cause mortality : An analysis of 22 European cohorts within the multicentre ESCAPE project. The Lancet, 383(9919), 785‑795. https://doi.org/10.1016/S0140-6736(13)62158-3 ↩
Bélanger, D., Abdous, B., Valois, P., Gosselin, P., & Sidi, E. (2016). A multilevel analysis to explain self-reported adverse health effects and adaptation to urban heat: a cross-sectional survey in the deprived areas of 9 Canadian cities. BMC public health, 16, 144. https://doi.org/10.1186/s12889-016-2749-y ↩
Bélanger, D., Gosselin, P., Valois, P., & Abdous, B. (2014). Perceived adverse health effects of heat and their determinants in deprived neighbourhoods : A cross-sectional survey of nine cities in Canada. International Journal of Environmental Research and Public Health, 11(11), 11028‑11053. https://doi.org/10.3390/ijerph111111028 ↩
Bélanger, D., Gosselin, P., Valois, P., & Abdous, B. (2015). Caractéristiques et perceptions du quartier et du logement associées aux impacts sanitaires néfastes autorapportés lorsqu’il fait très chaud et humide en été dans les secteurs urbains les plus défavorisés : Étude transversale dans 9 villes du Québec. INRS, Institut National de Santé Publique, & Centre Eau Terre Environnement.
↩
Bélanger, D., Gosselin, P., Bustinza., R., & Campagna, C. (2019). Changements climatiques et santé : prévenir, soigner et s’adapter. Québec, QC: Presses de l’Université Laval.
↩
Bell, S. A., Abir, M., Choi, H., Cooke, C., & Iwashyna, T. (2018). All-cause hospital admissions among older adults after a natural disaster. Annals of Emergency Medicine, 71(6), 746‑754.
↩
Bellaire, S., Jamieson, B., Thumlert, S., Goodrich, J., & Statham, G. (2016). Analysis of long-term weather, snow and avalanche data at Glacier National Park, B.C., Canada. Cold Regions Science and Technology, 121, 118‑125. https://doi.org/10.1016/j.coldregions.2015.10.010 ↩
Benmarhnia, T., Bailey, Z., Kaiser, D., Auger, N., King, N., & Kaufman, J. S. (2016). A difference-in-differences approach to assess the effect of a heat action plan on heat-related mortality, and differences in effectiveness according to sex, age, and socioeconomic status (Montreal, Quebec). Environmental Health Perspectives, 124(11), 1694‑1699. https://doi.org/10.1289/EHP203 ↩
Benmarhnia, T., Deguen, S., Kaufman, J. S., & Smargiassi, A. (2015). Review article : Vulnerability to heat-related mortality – a systematic review, meta-analysis, and meta-regression analysis. Epidemiology, 26(6), 781. https://doi.org/10.1097/EDE.0000000000000375 ↩
Berardi, U., & Jafarpur, P. (2020). Assessing the impact of climate change on building heating and cooling energy demand in Canada. Renewable and Sustainable Energy Reviews, 121, 109681. https://doi.org/10.1016/j.rser.2019.109681 ↩
Berlin, C., Techel, F., Moor, B. K., Zwahlen, M., Hasler, R. M., & Swiss National Cohort study group. (2019). Snow avalanche deaths in Switzerland from 1995 to 2014—Results of a nation-wide linkage study. PloS One, 14(12), e0225735.
↩
Berman, J. D., Ebisu, K., Peng, R. D., Dominici, F., & Bell, M. L. (2017). Drought and the risk of hospital admissions and mortality in older adults in western USA from 2000 to 2013 : A retrospective study. The Lancet Planetary Health, 1(1), e17‑e25. https://doi.org/10.1016/S2542-5196(17)30002-5 ↩
Berrang-Ford, L., Biesbroek, R., Ford, J. D., Lesnikowski, A., Tanabe, A., Wang, F. M., Chen, C., Hsu, A., Hellmann, J. J., Pringle, P., Grecequet, M., Amado, J. C., Huq, S., Lwasa, S. & Heymann, S. J. (2019). Tracking global climate change adaptation among governments. Nature Climate Change, 9(6), 440-449.
↩
Berry, H. L., Hogan, A., Owen, J., Rickwood, D., & Fragar, L. (2011). Climate change and farmers’ mental health : Risks and responses. Asia Pacific Journal of Public Health, 23(2 Suppl), 119S-132S. https://doi.org/10.1177/1010539510392556 ↩
Berteaux, D., Gauthier, G., Domine, F., Ims, R. A., Lamoureux, S. F., Lévesque, E., & Yoccoz, N. (2016). Effects of changing permafrost and snow conditions on tundra wildlife: critical places and times. Arctic Science, 3(2), 65-90. https://doi.org/10.1016/j.etap.2017.08.022 ↩
Black, C., Tesfaigzi, Y., Bassein, J. A., & Miller, L. A. (2017). Wildfire smoke exposure and human health : Significant gaps in research for a growing public health issue. Environmental Toxicology and Pharmacology, 55, 186‑195. https://doi.org/10.1016/j.etap.2017.08.022 ↩
Blais-Stevens, A., Behnia, O., & Castagner, A. (2018). Historical landslides that have resulted in fatalities in Canada (1771-2018). Natural Resources Canada.
↩
Bobb, J. F., Peng, R. D., Bell, M. L., & Dominici, F. (2014). Heat-related mortality and adaptation to heat in the United States. Environmental Health Perspectives, 122(8), 811‑816.
↩
Boeckmann, M., & Rohn, I. (2014). Is planned adaptation to heat reducing heat-related mortality and illness? A systematic review. BMC Public Health, 14, 1112. https://doi.org/10.1186/1471-2458-14-1112 ↩
Bolitho, A., & Miller, F. (2017). Heat as emergency, heat as chronic stress : Policy and institutional responses to vulnerability to extreme heat. Local Environment, 22(6), 682‑698.
↩
Bonaiuto, M., Alves, S., De Dominicis, S., & Petruccelli, I. (2016). Place attachment and natural hazard risk : Research review and agenda. Journal of Environmental Psychology, 48, 33‑53.
↩
Bonsal, B. R., Peters, D. L., Seglenieks, F., Rivera, A., & Berg, A. (2019). Changes in freshwater availability across Canada. In E. Bush, & D. S. Lemmen (Eds.), Canada’s Changing Climate Report. Ottawa, ON: Government of Canada.
↩
Bonsal, B. R., Wheaton, E. E., Chipanshi, A. C., Lin, C., Sauchyn, D. J., & Wen, L. (2011). Drought research in Canada : A review. Atmosphere-Ocean, 49(4), 303‑319. https://doi.org/10.1080/07055900.2011.555103 ↩
Botzen, W. J. W., Aerts, J. C. J. H., & van den Bergh, J. C. J. M. (2009). Willingness of homeowners to mitigate climate risk through insurance. Ecological Economics, 68(8), 2265‑2277. https://doi.org/10.1016/j.ecolecon.2009.02.019 ↩
Boyd, J., Haegeli, P., Abu-Laban, R. B., Shuster, M., & Butt, J. C. (2009). Patterns of death among avalanche fatalities : A 21-year review. Canadian Medical Association Journal, 180(5), 507‑512. https://doi.org/10.1503/cmaj.081327 ↩
Boyer, T. A., Melstrom, R. T., & Sanders, L. D. (2017). Effects of climate variation and water levels on reservoir recreation. Lake and Reservoir Management, 33(3), 223‑233. https://doi.org/10.1080/10402381.2017.1285375 ↩
Bränström, R., Kasparian, N. A., Chang, Y., Affleck, P., Tibben, A., Aspinwall, L. G., Azizi, E., Baron-Epel, O., Battistuzzi, L., Bergman, W., Bruno, W., Chan, M., Cuellar, F., Dębniak, T., Pjanova, D., Ertmański, S., Figl, A., Gonzalez, M., Hayward, N. K., … Brandberg, Y. (2010). Predictors of sun protection behaviors and severe sunburn in an international online study. Cancer Epidemiology and Prevention Biomarkers, 19(9), 2199‑2210. https://doi.org/10.1158/1055-9965.EPI-10-0196 ↩
Brimelow, J. C., Burrows, W. R., & Hanesiak, J. M. (2017). The changing hail threat over North America in response to anthropogenic climate change. Nature Climate Change, 7(7), 516-522.
↩
Brown, L., & Murray, V. (2013). Examining the relationship between infectious diseases and flooding in Europe. Disaster Health, 1(2), 117‑127. https://doi.org/10.4161/dish.25216 ↩
Brown, M., Agyapong, V., Greenshaw, A. J., Cribben, I., Brett-MacLean, P., Drolet, J., McDonald-Harker, C., Omeje, J., Mankowsi, M., Noble, S., Kitching, D., & Silverstone, P. H. (2019). After the Fort McMurray wildfire there are significant increases in mental health symptoms in grade 7-12 students compared to controls. BMC Psychiatry, 19(1), 18. https://doi.org/10.1186/s12888-018-2007-1 ↩
Bruce, M., Zulz, T., & Koch, A. (2016). Surveillance of infectious diseases in the Arctic. Public health, 137, 5‑12.
↩
Bubeck, P., Botzen, W. J., & Aerts, J. C. (2012). A review of risk perceptions and other factors that influence flood mitigation behavior. Risk Analysis: An International Journal, 32(9), 1481‑1495.
↩
Bunker, A., Wildenhain, J., Vandenbergh, A., Henschke, N., Rocklöv, J., Hajat, S., & Sauerborn, R. (2016). Effects of air temperature on climate-sensitive mortality and morbidity outcomes in the elderly; a systematic review and meta-analysis of epidemiological evidence. EBioMedicine, 6, 258‑268. https://doi.org/10.1016/j.ebiom.2016.02.034 ↩
Burnett, M. E., & Wang, S. Q. (2011). Current sunscreen controversies : A critical review. Photodermatology, Photoimmunology & Photomedicine, 27(2), 58‑67. https://doi.org/10.1111/j.1600-0781.2011.00557.x ↩
Burton, H., Rabito, F., Danielson, L., & Takaro, T. K. (2016). Health effects of flooding in Canada : A 2015 review and description of gaps in research. Canadian Water Resources Journal = Revue canadienne des ressources hydriques, 41(1‑2), 238‑249. https://doi.org/10.1080/07011784.2015.1128854 ↩
Bush, E. & Lemmen, D. S. (Eds.). (2019). Canada’s Changing Climate Report. Ottawa, ON: Government of Canada. Retrieved from https://changingclimate.ca/CCCR2019 ↩
Bustinza, R., Lebe,l G., Gosselin, P., Bélanger, D., & Chebana, F. (2013). Health impacts of the July 2010 heat wave in Québec, Canada. BMC Public Health, 13, 56. https://doi.org/10.1186/1471-2458-13-56 ↩
Buters, J. T. M., Antunes, C., Galveias, A., Bergmann, K. C., Thibaudon, M., Galán, C., Schmidt-Weber, C., & Oteros, J. (2018). Pollen and spore monitoring in the world. Clinical and Translational Allergy, 8(1), 9. https://doi.org/10.1186/s13601-018-0197-8 ↩
Cabrera, S. E., Mindell, J. S., Toledo, M., Alvo, M., & Ferro, C. J. (2016). Associations of Blood Pressure With Geographical Latitude, Solar Radiation, and Ambient Temperature : Results From the Chilean Health Survey, 2009–2010. American Journal of Epidemiology, 183(11), 1071‑1073. https://doi.org/10.1093/aje/kww037 ↩
Calmels, F., Doré, G., Kong, X., & Roy, L. P. (2016). Vulnerability of the north Alaska Highway to permafrost thaw : Design options and climate change adaptation. Whitehorse, YT: Northern Climate ExChange, Yukon Research Centre.
↩
Canadian Council of Ministers of the Environment. (2016). Summary of Integrated Watershed Management Approaches Across Canada. Retrieved from https://ccme.ca ↩
Cann, K., Thomas, D. R., Salmon, R., Wyn-Jones, A., & Kay, D. (2013). Extreme water-related weather events and waterborne disease. Epidemiology & Infection, 141(4), 671‑686.
↩
Canuel, M., Gosselin, P., Duhoux, A., Brunet, A. & Lesage, A. (2019). Surveillance and Prevention of the Impacts of Extreme Meteorological Events on Public Health System (SUPREME). In Post-Disaster Mental Health Impacts Surveillance Toolkit. Institut national de santé publique du Québec. Retrieved from https://www.inspq.qc.ca/en/publications/2676 ↩
Carnie, T.-L., Berry, H. L., Blinkhorn, S. A., & Hart, C. R. (2011). In their own words : Young people’s mental health in drought-affected rural and remote NSW. Australian Journal of Rural Health, 19(5), 244‑248. https://doi.org/10.1111/j.1440-1584.2011.01224.x ↩
Cassell, K., Gacek, P., Warren, J. L., Raymond, P. A., Cartter, M., & Weinberger, D. M. (2018). Association Between Sporadic Legionellosis and River Systems in Connecticut. The Journal of Infectious Diseases, 217(2), 179‑187. https://doi.org/10.1093/infdis/jix531 ↩
Chae, B.-G., Park, H.-J., Catani, F., Simoni, A., & Berti, M. (2017). Landslide prediction, monitoring and early warning : A concise review of state-of-the-art. Geosciences Journal, 21(6), 1033‑1070. https://doi.org/10.1007/s12303-017-0034-4 ↩
Chan, C. B., Ryan, D. A., & Tudor-Locke, C. (2006). Relationship between objective measures of physical activity and weather : A longitudinal study. International Journal of Behavioral Nutrition and Physical Activity, 3(1), 21. https://doi.org/10.1186/1479-5868-3-21 ↩
Chapra, S. C., Boehlert, B., Fant, C., Bierman, V. J., Henderson, J., Mills, D., Mas, D. M. L., Rennels, L., Jantarasami, L., Martinich, J., Strzepek, K. M., & Paerl, H. W. (2017). Climate change impacts on harmful algal blooms in US freshwaters : A screening-level assessment. Environmental Science & Technology, 51(16), 8933‑8943. https://doi.org/10.1021/acs.est.7b01498 ↩
Charrois, J. W. (2010). Private drinking water supplies : Challenges for public health. Canadian Medical Association Journal, 182(10), 1061‑1064.
↩
Chen, H., Wang, J., Li, Q., Yagouti, A., Lavigne, E., Foty, R., Burnett, R. T., Villeneuve, P. J., Cakmak, S., & Copes, R. (2016). Assessment of the effect of cold and hot temperatures on mortality in Ontario, Canada : A population-based study. CMAJ Open, 4(1), E48‑E58. https://doi.org/10.9778/cmajo.20150111 ↩
Chen, J., Anderson, K., Pavlovic, R., Moran, M. D., Englefield, P., Thompson, D. K., Munoz-Alpizar, R., Landry, H. (2019). The FireWork v2. 0 air quality forecast system with biomass burning emissions from the Canadian Forest Fire Emissions Prediction System v2.03. Geoscientific Model Development, 12(7), 3283-310. https://doi.org/10.5194/gmd-12-3283-2019 ↩
Cheng, J., Xu, Z., Zhu, R., Wang, X., Jin, L., Song, J., & Su, H. (2014). Impact of diurnal temperature range on human health : A systematic review. International Journal of Biometeorology, 58(9), 2011‑2024.
↩
Cherry, N., & Haynes, W. (2017). Effects of the Fort McMurray wildfires on the health of evacuated workers : Follow-up of 2 cohorts. CMAJ Open, 5(3), E638‑E645. https://doi.org/10.9778/cmajo.20170047 ↩
Chhetri, B. K., Takaro, T. K., Balshaw, R., Otterstatter, M., Mak, S., Lem, M., Zubel, M., Lysyshyn, M., Clarkson, L., Edwards, J., Fleury, M. D., Henderson, S. B., & Galanis, E. (2017). Associations between extreme precipitation and acute gastro-intestinal illness due to cryptosporidiosis and giardiasis in an urban Canadian drinking water system (1997–2009). Journal of Water and Health, 15(6), 898‑907. https://doi.org/10.2166/wh.2017.100 ↩
Chouinard, O., Plante, S., & Martin, G. (2008). The community engagement process : A governance approach in adaptation to coastal erosion and flooding in Atlantic Canada. Canadian Journal of Regional Science, 31(3), 507‑520.
↩
Chu, A., Han, L., Roifman, I., Lee, D. S., Green, M. E., Jacklin, K., Walker, J., Sutherland, R., Khan, S., Frymire, E. & Tu, J. V. (2019). Trends in cardiovascular care and event rates among First Nations and other people with diabetes in Ontario, Canada, 1996–2015. CMAJ, 191(47), E1291-E1298.
↩
Circé, M., Da Silva, L., Boyer-Villemaire, U., Duff, G., Desjarlais, C., & Morneau, F. (2016). Analyse couts-avantages des options d’adaptation en zone côtière au Québec. Ouranos.
↩
Clark, D. G., Ford, J. D., Berrang-Ford, L., Pearce, T., Kowal, S., & Gough, W. A. (2016a). The role of environmental factors in search and rescue incidents in Nunavut, Canada. Public Health, 137, 44‑49. https://doi.org/10.1016/j.puhe.2016.06.003 ↩
Clark, D. G., Ford, J. D., Pearce, T., & Berrang-Ford, L. (2016b). Vulnerability to unintentional injuries associated with land-use activities and search and rescue in Nunavut, Canada. Social Science & Medicine, 169, 18‑26. https://doi.org/10.1016/j.socscimed.2016.09.026 ↩
Conlon, K. C., Rajkovich, N. B., White-Newsome, J. L., Larsen, L., & Neill, M. S. O. (2011). Preventing cold-related morbidity and mortality in a changing climate. Maturitas, 69(3), 197‑202. https://doi.org/10.1016/j.maturitas.2011.04.004 ↩
Correia, A., Azevedo, M., Gondim, F., & Bandeira, F. (2014). Ethnic aspects of vitamin D deficiency. Arquivos Brasileiros de Endocrinologia e Metabologia, 58(5), 540–544. https://doi.org/10.1590/0004-2730000003320 ↩
Crnek-Georgeson, K. T., Wilson, L. A., & Page, A. (2017). Factors influencing suicide in older rural males : A review of Australian studies. Rural & Remote Health, 17(4), 1‑11.
↩
Crouse, D. L., Pinault, L., Balram, A., Hystad, P., Peters, P. A., Chen, H., van Donkelaar, A., Martin, R. V., Ménard, R., Robichaud, A., & Villeneuve, P. J. (2017). Urban greenness and mortality in Canada’s largest cities : A national cohort study. The Lancet Planetary Health, 1(7), e289‑e297. https://doi.org/10.1016/S2542-5196(17)30118-3 ↩
Cunsolo Willox, A., Stephenson, E., Allen, J., Bourque, F., Drossos, A., Elgarøy, S., Kral, M. J., Mauro, I., Moses, J., Pearce, T., MacDonald, J. P., & Wexler, L. (2015). Examining relationships between climate change and mental health in the Circumpolar North. Regional Environmental Change, 15(1), 169-82.
↩
Curtis, S., Fair, A., Wistow, J., Val, D. V., & Oven, K. (2017). Impact of extreme weather events and climate change for health and social care systems. Environmental Health, 16(1), 128.
↩
Cusack, L., van Loon, A., Kralik, D., Arbon, P., & Gilbert, S. (2013). Extreme weather-related health needs of people who are homeless. Australian Journal of Primary Health, 19(3), 250‑255. https://doi.org/10.1071/PY12048 ↩
Dadlani, C., & Orlow, S. J. (2008). Planning for a brighter future : A review of sun protection and barriers to behavioral change in children and adolescents. Dermatology Online Journal, 14(9). https://escholarship.org/uc/item/6vs1r0r9 ↩
D’Amato, G., Cecchi, L., & Annesi-Maesano, I. (2012). A trans-disciplinary overview of case reports of thunderstorm-related asthma outbreaks and relapse. European Respiratory Review, 21(124), 82‑87. https://doi.org/10.1183/09059180.00001712 ↩
Dancause, K. N., Laplante, D. P., Hart, K. J., O’Hara, M. W., Elgbeili, G., Brunet, A., & King, S. (2015). Prenatal stress due to a natural disaster predicts adiposity in childhood : The Iowa Flood Study. Journal of Obesity, 2015, 570541‑570541. https://doi.org/10.1155/2015/570541 ↩
Darques, R. (2015). Mediterranean cities under fire. A critical approach to the wildland–urban interface. Applied Geography, 59, 10‑21.
↩
Davis, R. E., McGregor, G. R., & Enfield, K. B. (2016). Humidity : A review and primer on atmospheric moisture and human health. Environmental Research, 144, 106‑116. https://doi.org/10.1016/j.envres.2015.10.014 ↩
Dean, J. G., & Stain, H. J. (2010). Mental health impact for adolescents living with prolonged drought. Australian Journal of Rural Health, 18(1), 32‑37.
↩
Decent, D. (2018). The mental and physical human health impacts of residential basement Flooding and associated financial costs : Interviews with households in Southern Ontario, Canada. UWSpace. Retrieved from http://hdl.handle.net/10012/13366 ↩
Delic, N. C., Lyons, J. G., Di Girolamo, N., & Halliday, G. M. (2017). Damaging Effects of Ultraviolet Radiation on the Cornea. Photochemistry and Photobiology, 93(4), 920‑929. https://doi.org/10.1111/php.12686 ↩
de Munck, C., Pigeon, G., Masson, V., Meunier, F., Bousquet, P., Tréméac, B., Merchat, M., Poeuf, P., & Marchadier, C. (2013). How much can air conditioning increase air temperatures for a city like Paris, France? International Journal of Climatology, 33(1), 210‑227. https://doi.org/10.1002/joc.3415 ↩
Derksen, C., Burgess, D., Duguay, C., Howell, S., Mudryk, L., Smith, S., Thackeray, C., & Kirchmeier-Young, M. (2019). Changes in snow, ice, and permafrost across Canada. In E. Bush, & D.S. Lemmen (Eds.), Canada’s Changing Climate Report. Ottawa, ON: Government of Canada.
↩
Diaz, H., Hurlbert, M., & Warren, J. (2016). Vulnerability and adaptation to drought : The Canadian Prairies and South America. University of Calgary.
↩
Dix-Cooper, L., Johnston, F., Hasselback, P., & Rideout, K. (2014). Evidence review : Reducing time outdoors during wildfire smoke events : Advice to stay indoors, advice to reduce outdoor physical activity and cancelling. BC Centre for Disease Control.
↩
Dixon, S. J., Sear, D. A., Odoni, N. A., Sykes, T., & Lane, S. N. (2016). The effects of river restoration on catchment scale flood risk and flood hydrology. Earth Surface Processes and Landforms, 41(7), 997‑1008. https://doi.org/10.1002/esp.3919 ↩
Dodd, W., Howard, C., Rose, C., Scott, C., Scott, P., Cunsolo, A., & Orbinski, J. (2018a). The summer of smoke : Ecosocial and health impacts of a record wildfire season in the Northwest Territories, Canada. The Lancet Global Health, 6, S30. https://doi.org/10.1016/S2214-109X(18)30159-1 ↩
Dodd, W., Scott, P., Howard, C., Scott, C., Rose, C., Cunsolo, A., & Orbinski, J. (2018b). Lived experience of a record wildfire season in the Northwest Territories, Canada. Canadian Journal of Public Health = Revue Canadienne de Sante Publique, 109(3), 327–337. https://doi.org/10.17269/s41997-018-0070-5 ↩
Doede, A., & Davis, R. (2018). Use of airborne PM10 concentrations at air quality monitoring sites in Imperial County, California, as an indication of geographical influences on lung health during drought periods : A time-series analysis. The Lancet Planetary Health, 2, S10.
↩
Doré, G., Niu, F., & Brooks, H. (2016). Adaptation methods for transportation infrastructure built on degrading permafrost. Permafrost and Periglacial Processes, 27(4), 352‑364. https://doi.org/10.1002/ppp.1919 ↩
Doyon, B., Bélanger, D., & Gosselin, P. (2006). Effets du climat sur la mortalité au Québec méridional de 1981 à 1999 et simulations pour des scénarios climatiques futures. Institut national de santé publique Québec.
↩
Doyon, B., Belanger, D., & Gosselin, P. (2008). The potential impact of climate change on annual and seasonal mortality for three cities in Quebec, Canada. International Journal of Health Geographics, 7, 23. https://doi.org/10.1186/1476-072X-7-23 ↩
Drejza, S., Friesinger, S., & Bernatchez, P. (2015). Vulnérabilité des infrastructures routières de l’Est du Québec à l’érosion et à la submersion côtière dans un contexte de changements climatiques : Développement d’une approche et d’un indice pour quantifier la vulnérabilité des infrastructures routières à l’érosion et à la submersion côtière dans un contexte de changements climatiques sur 9 sites témoins. Volume III. Projet X008.1. Laboratoire de dynamique et de gestion intégrée des zones côtières, Université du Québec à Rimouski.
↩
Du, W., FitzGerald, G. J., Clark, M., & Hou, X.-Y. (2010). Health impacts of floods. Prehospital and Disaster Medicine, 25(3), 265‑272. https://doi.org/10.1017/S1049023X00008141 ↩
Duchesne, A., Liu, A., Jones, S. L., Laplante, D. P., & King, S. (2017). Childhood body mass index at 5.5 years mediates the effect of prenatal maternal stress on daughters’ age at menarche : Project Ice Storm. Journal of Developmental Origins of Health and Disease, 8(2), 168‑177. https://doi.org/10.1017/S2040174416000726 ↩
Durkalec, A., Furgal, C., Skinner, M. W., & Sheldon, T. (2014). Investigating Environmental Determinants of Injury and Trauma in the Canadian North. International Journal of Environmental Research and Public Health, 11(2), 1536‑1548. https://doi.org/10.3390/ijerph110201536 ↩
Durkalec, A., Furgal, C., Skinner, M. W., & Sheldon, T. (2015). Climate change influences on environment as a determinant of Indigenous health : Relationships to place, sea ice, and health in an Inuit community. Social Science and Medicine, 136, 17‑26. https://doi.org/10.1016/j.socscimed.2015.04.026 ↩
Edwards, B., Gray, M., & Hunter, B. (2015). The impact of drought on mental health in rural and regional Australia. Social Indicators Research, 121(1), 177‑194.
↩
Enright, N. J., & Fontaine, J. B. (2014). Climate change and the management of fire-prone vegetation in southwest and southeast Australia. Geographical Research, 52(1), 34‑44. https://doi.org/10.1111/1745-5871.12026 ↩
Environment and Climate Change Canada. (2019b). Canada’s Wildfire Smoke Prediction System (FireWork). Retrieved from https://weather.gc.ca/firework/ ↩
Fann, N., Alman, B., Broome, R. A., Morgan, G. G., Johnston, F. H., Pouliot, G., & Rappold, A. G. (2018). The health impacts and economic value of wildland fire episodes in the U.S. : 2008–2012. The Science of the Total Environment, 610‑611, 802‑809. https://doi.org/10.1016/j.scitotenv.2017.08.024 ↩
Farrugia, S., Hudson, M. D., & McCulloch, L. (2013). An evaluation of flood control and urban cooling ecosystem services delivered by urban green infrastructure. International Journal of Biodiversity Science, Ecosystem Services & Management, 9(2), 136‑145. https://doi.org/10.1080/21513732.2013.782342 ↩
Fartasch, M., Diepgen, T. L., Schmitt, J., & Drexler, H. (2012). The relationship between occupational sun exposure and non-melanoma skin cancer : Clinical basics, epidemiology, occupational disease evaluation, and prevention. Deutsches Ärzteblatt International, 109(43), 715.
↩
Febriani, Y., Levallois, P., Gingras, S., Gosselin, P., Majowicz, S. E., & Fleury, M. D. (2010). The association between farming activities, precipitation, and the risk of acute gastrointestinal illness in rural municipalities of Quebec, Canada : A cross-sectional study. BMC Public Health, 10(1), 48. https://doi.org/10.1186/1471-2458-10-48 ↩
Felix, E., Afifi, T., Kia-Keating, M., Brown, L., Afifi, W., & Reyes, G. (2015). Family functioning and posttraumatic growth among parents and youth following wildfire disasters. American Journal of Orthopsychiatry, 85(2), 191.
↩
Fernandes, P. M. (2013). Fire-smart management of forest landscapes in the Mediterranean basin under global change. Landscape and Urban Planning, 110, 175‑182. https://doi.org/10.1016/j.landurbplan.2012.10.014 ↩
Fernandez, A., Black, J., Jones, M., Wilson, L., Salvador-Carulla, L., Astell-Burt, T., & Black, D. (2015). Flooding and mental health : A systematic mapping review. PLOS ONE, 10(4), e0119929. https://doi.org/10.1371/journal.pone.0119929 ↩
Findlay, L. C., Arim, R., & Kohen, D. (2020). Understanding the perceived mental health of Canadians during the COVTD-19 pandemic. Health reports, 31(4), 22-27. (disponible en français également)
↩
Finlay, S. E., Moffat, A., Gazzard, R., Baker, D., & Murray, V. (2012). Health impacts of wildfires. PLoS Currents, 4, e4f959951cce2c. https://doi.org/10.1371/4f959951cce2c ↩
Fioletov, V., Kerr, J. B., & Fergusson, A. (2010). The UV Index : Definition, distribution and factors affecting It. Canadian Journal of Public Health, 101(4), I5‑I9. https://doi.org/10.1007/BF03405303 ↩
First, J. M., First, N. L., & Houston, J. B. (2017). Intimate partner violence and disasters : A framework for empowering women experiencing violence in disaster settings. Affilia, 32(3), 390‑403.
↩
Fisk, W. J. (2015). Review of some effects of climate change on indoor environmental quality and health and associated no-regrets mitigation measures. Building and Environment, 86, 70‑80. https://doi.org/10.1016/j.buildenv.2014.12.024 ↩
Flannigan, M. D., Krawchuk, M. A., Groot, W. J. de, Wotton, B. M., & Gowman, L. M. (2009). Implications of changing climate for global wildland fire. International Journal of Wildland Fire, 18(5), 483‑507. https://doi.org/10.1071/WF08187 ↩
Flannigan, M. D., Logan, K. A., Amiro, B. D., Skinner, W. R., & Stocks, B. J. (2005). Future area burned in Canada. Climatic Change, 72(1), 1‑16. https://doi.org/10.1007/s10584-005-5935-y ↩
Flannigan, M. D., Wotton, B. M., Marshall, G. A., de Groot, W. J., Johnston, J., Jurko, N., & Cantin, A. S. (2016). Fuel moisture sensitivity to temperature and precipitation : Climate change implications. Climatic Change, 134(1), 59‑71. https://doi.org/10.1007/s10584-015-1521-0 ↩
Flynn, M., Ford, J. D., Labbé, J., Schrott, L., & Tagalik, S. (2018). Evaluating the effectiveness of hazard mapping as climate change adaptation for community planning in degrading permafrost terrain. Sustainability Science, 14(4), 1041–1056. https://doi.org/10.1007/s11625-018-0614-x ↩
Ford, B., Val Martin, M., Zelasky, S., Fischer, E., Anenberg, S., Heald, C., & Pierce, J. (2018). Future fire impacts on smoke concentrations, visibility, and health in the contiguous United States. GeoHealth, 2(8), 229‑247.
↩
Ford, J. D., Willox, A. C., Chatwood, S., Furgal, C., Harper, S., Mauro, I., & Pearce, T. (2014). Adapting to the Effects of Climate Change on Inuit Health. American Journal of Public Health, 104(S3), e9‑e17. https://doi.org/10.2105/AJPH.2013.301724 ↩
Fortier, C. (2013). Impact des changements climatiques sur les débordements des réseaux d’égouts unitaires. Institut national de la recherche scientifique.
↩
Fortune, M., Mustard, C., & Brown, P. (2014). The use of Bayesian inference to inform the surveillance of temperature-related occupational morbidity in Ontario, Canada, 2004-2010. Environmental Research, 132, 449‑456. https://doi.org/10.1016/j.envres.2014.04.022 ↩
Freedman, D. M., Kitahara, C. M., Linet, M. S., Alexander, B. H., Neta, G., Little, M. P., & Cahoon, E. K. (2015). Ambient temperature and risk of first primary basal cell carcinoma : A nationwide United States cohort study. Journal of Photochemistry and Photobiology B: Biology, 148, 284‑289. https://doi.org/10.1016/j.jphotobiol.2015.04.025 ↩
French, C. E., Waite, T. D., Armstrong, B., Rubin, G. J., Group, E. N. S. of F. and H. S., Beck, C. R., & Oliver, I. (2019). Impact of repeat flooding on mental health and health-related quality of life : A cross-sectional analysis of the English National Study of Flooding and Health. BMJ Open, 9(11). https://doi.org/10.1136/bmjopen-2019-031562 ↩
Friel, S., Berry, H., Dinh, H., O’Brien, L., & Walls, H. L. (2014). The impact of drought on the association between food security and mental health in a nationally representative Australian sample. BMC Public Health, 14(1), 1102.
↩
Fulton, A. E., & Drolet, J. (2018). Responding to disaster-related loss and grief : Recovering from the 2013 flood in Southern Alberta, Canada. Journal of Loss & Trauma, 23(2), 140‑158. https://doi.org/10.1080/15325024.2018.1423873 ↩
Funari, E., Manganelli, M., & Sinisi, L. (2012). Impact of climate change on waterborne diseases. Annali dell’Istituto superiore di sanita, 48, 473‑487.
↩
Furr, J. M., Corner, J. S., Edmunds, J. M., & Kendall, P. C. (2010). Disasters and youth : A meta-analytic examination of posttraumatic stress. Journal of Consulting and Clinical Psychology, 78(6), 765‑780. https://doi.org/10.1037/a0021482 ↩
Gabbe, B. J., Veitch, W., Curtis, K., Martin, K., Gomez, D., Civil, I., … & Fitzgerald, M. (2020). Survey of major trauma centre preparedness for mass casualty incidents in Australia, Canada, England and New Zealand. EClinicalMedicine, 21, 100322. https://doi.org/10.1016/j.eclinm.2020.100322 ↩
Gabriel, K. M., & Endlicher, W. R. (2011). Urban and rural mortality rates during heat waves in Berlin and Brandenburg, Germany. Environmental Pollution, 159(8‑9), 2044‑2050.
↩
Gachon, P., Bussières, L., Gosselin, P., Raphoz, M., Bustinza, R., Martin, P., Dueymes, G., Gosselin, D., Labrecque, S., Jeffers, S., & Yagouti, A. (2016). Guide to identifying alert thresholds for heat waves in Canada based on evidence. Université du Québec à Montréal, Environment and Climate Change Canada, Institut National de Santé Publique du Québec, and Health Canada. Retrieved from https://archipel.uqam.ca/9073/1/Gachon_et_al_2016_Guide_Heat_Waves_EN.pdf ↩
Gagnon, D., Romero, S. A., Cramer, M. N., Jay, O., & Crandall, C. G. (2016). Cardiac and thermal strain of elderly adults exposed to extreme heat and humidity with and without electric fan use. JAMA, 316(9), 989‑991. https://doi.org/10.1001/jama.2016.10550 ↩
Gamble, J. L., Hurley, B. J., Schultz, P. A., Jaglom, W. S., Krishnan, N., & Harris, M. (2013). Climate change and older Americans : State of the science. Environmental Health Perspectives, 121(1), 15.
↩
Garcia, D. M., & Sheehan, M. C. (2016). Extreme weather-driven disasters and children’s health. International Journal of Health Services, 46(1), 79‑105. doi :10.1177/0020731415625254
↩
Gaskin, C. J., Taylor, D., Kinnear, S., Mann, J., Hillman, W., & Moran, M. (2017). Factors associated with the climate change vulnerability and the adaptive capacity of people with disability : A systematic review. Weather, Climate, and Society, 9(4), 801‑814.
↩
Gasparrini, A., Guo, Y., Hashizume, M., Lavigne, E., Zanobetti, A., Schwartz, J., Tobias, A., Tong, S., Rocklöv, J., Forsberg, B., Leone, M., De Sario, M., Bell, M. L., Guo, Y.-L. L., Wu, C., Kan, H., Yi, S.-M., de Sousa Zanotti Stagliorio Coelho, M., Saldiva, P. H. N., … Armstrong, B. (2015). Mortality risk attributable to high and low ambient temperature : A multicountry observational study. The Lancet, 386(9991), 369‑375. https://doi.org/10.1016/S0140-6736(14)62114-0 ↩
Gasparrini, A., Guo, Y., Sera, F., Vicedo-Cabrera, A. M., Huber, V., Tong, S., de Sousa Zanotti Stagliorio Coelho, M., Nascimento Saldiva, P. H., Lavigne, E., Matus Correa, P., Valdes Ortega, N., Kan, H., Osorio, S., Kyselý, J., Urban, A., Jaakkola, J. J. K., Ryti, N. R. I., Pascal, M., Goodman, P. G., … Armstrong, B. (2017). Projections of temperature-related excess mortality under climate change scenarios. The Lancet Planetary Health, 1(9), e360‑e367. https://doi.org/10.1016/S2542-5196(17)30156-0 ↩
Geertsema, M. (2013). Quick clay landslides, landscape evolution, and climate change : A perspective from British Columbia. In C. Margottini, P. Canuti, & K. Sassa (Eds.), Landslide Science and Practice : Volume 4 : Global Environmental Change (p. 115‑120). Springer Berlin Heidelberg. https://doi.org/10.1007/978-3-642-31337-0_15 ↩
Georgakakos, A., Yao, H., Kistenmacher, M., Georgakakos, K., Graham, N., Cheng, F.-Y., Spencer, C., & Shamir, E. (2012). Value of adaptive water resources management in Northern California under climatic variability and change : Reservoir management. Journal of Hydrology, 412, 34‑46.
↩
Germain, D. (2016). Snow avalanche hazard assessment and risk management in northern Quebec, eastern Canada. Natural Hazards, 80(2), 1303‑1321. https://doi.org/10.1007/s11069-015-2024-z ↩
Germain, D., Filion, L., & Hétu, B. (2009). Snow avalanche regime and climatic conditions in the Chic-Choc Range, eastern Canada. Climatic Change, 92(1), 141‑167. https://doi.org/10.1007/s10584-008-9439-4 ↩
Ghazani, M., FitzGerald, G., Hu, W., & Xu, Z. (2018). Temperature variability and gastrointestinal infections : A review of impacts and future perspectives. International Journal of Environmental Research and Public Health, 15(4), 766. https://doi.org/10.3390/ijerph15040766 ↩
Gill, R. S., Hambridge, H. L., Schneider, E. B., Hanff, T., Tamargo, R. J., & Nyquist, P. (2013). Falling temperature and colder weather are associated with an increased risk of aneurysmal subarachnoid hemorrhage. World Neurosurgery, 79(1), 136‑142.
↩
Gillett, N. P., Weaver, A. J., Zwiers, F. W., & Flannigan, M. D. (2004). Detecting the effect of climate change on Canadian forest fires. Geophysical Research Letters, 31(18). https://doi.org/10.1029/2004GL020876 ↩
Goldberg, M. S., Gasparrini, A., Armstrong, B., & Valois, M.-F. (2011). The short-term influence of temperature on daily mortality in the temperate climate of Montreal, Canada. Environmental research, 111(6), 853‑860.
↩
Goldman, A., Eggen, B., Golding, B., & Murray, V. (2014). The health impacts of windstorms : A systematic literature review. Public health, 128(1), 3‑28.
↩
Gomez, D., Haas, B., Ahmed, N., Tien, H., & Nathens, A. (2011). Disaster preparedness of Canadian trauma centres: the perspective of medical directors of trauma. Canadian Journal of Surgery, 54(1), 9.
↩
Gorman, S., Lucas, R. M., Allen-Hall, A., Fleury, N., & Feelisch, M. (2017). Ultraviolet radiation, vitamin D and the development of obesity, metabolic syndrome and type-2 diabetes. Photochemical & Photobiological Sciences, 16(3), 362‑373. https://doi.org/10.1039/c6pp00274a ↩
Gorman, S., McGlade, J. P., Lambert, M. J., Strickland, D. H., Thomas, J. A., & Hart, P. H. (2010). UV exposure and protection against allergic airways disease. Photochemical & Photobiological Sciences, 9(4), 571‑577.
↩
Gosling, S. N., Hondula, D. M., Bunker, A., Ibarreta, D., Liu, J., Zhang, X., & Sauerborn, R. (2017). Adaptation to climate change: a comparative analysis of modeling methods for heat-related mortality. Environmental health perspectives, 125(8), 087008.
↩
Graham, D. A., Vanos, J. K., Kenny, N. A., & Brown, R. D. (2016). The relationship between neighbourhood tree canopy cover and heat-related ambulance calls during extreme heat events in Toronto, Canada. Urban Forestry & Urban Greening, 20, 180‑186. https://doi.org/10.1016/j.ufug.2016.08.005 ↩
Graham, H., White, P., Cotton, J., & McManus, S. (2019). Flood- and weather-damaged homes and mental health : An analysis using England’s mental health survey. International Journal of Environmental Research and Public Health, 16(18), 3256. https://doi.org/10.3390/ijerph16183256 ↩
Greenan, B. J. W., James, T. S., Loder, J. W., Pepin, P., Azetsu-Scott, K., Ianson, D., Hamme, R. C., Gilbert, D., Tremblay, J.-É., Wang, X. L., & Perrie, W. (2019). Changes in oceans surrounding Canada. In E. Bush & D.S. Lemmen (Eds.), Canada’s Changing Climate Report. Ottawa, ON: Government of Canada.
↩
Greene, C. S., Robinson, P. J., & Millward, A. A. (2018). Canopy of advantage: Who benefits most from city trees? Journal of Environmental Management, 208(15), 24-35. https://doi.org/10.1016/j.jenvman.2017.12.015 ↩
Greene, G., Paranjothy, S., & Palmer, S. R. (2015). Resilience and vulnerability to the psychological harm from flooding : The role of social cohesion. American Journal of Public Health, 105(9), 1792‑1795. https://doi.org/10.2105/AJPH.2015.302709 ↩
Gronlund, C. J. (2014). Racial and socioeconomic disparities in heat-related health effects and their mechanisms : A review. Current Epidemiology Reports, 1(3), 165‑173. https://doi.org/10.1007/s40471-014-0014-4 ↩
Guiney, R. (2012). Farming suicides during the Victorian drought : 2001–2007. Australian journal of rural health, 20(1), 11‑15.
↩
Gunn, K. M., Kettler, L. J., Skaczkowski, G. L., & Turnbull, D. A. (2012). Farmers’ stress and coping in a time of drought. Rural & Remote Health, 12(4).
↩
Guo, Y., Gasparrini, A., Li, S., Sera, F., Vicedo-Cabrera, A. M., Coelho, M. de S. Z. S., Saldiva, P. H. N., Lavigne, E., Tawatsupa, B., & Punnasiri, K. (2018). Quantifying excess deaths related to heatwaves under climate change scenarios : A multicountry time series modelling study. PLoS Medicine, 15(7), e1002629.
↩
Gupta, S., Carmichael, C., Simpson, C., Clarke, M. J., Allen, C., Gao, Y., Chan, E. Y., & Murray, V. (2012). Electric fans for reducing adverse health impacts in heatwaves. The Cochrane Database of Systematic Reviews, 2012(7), CD009888. https://doi.org/10.1002/14651858.CD009888.pub2 ↩
Guyadeen, D., Thistlethwaite, J., & Henstra, D. (2019). Evaluating the quality of municipal climate change plans in Canada. Climatic Change, 152(1), 121‑143. https://doi.org/10.1007/s10584-018-2312-1 ↩
Haider, A., Mamdani, M., & Shear, N. H. (2007). Socioeconomic status and the prevalence of melanoma in Ontario, Canada. Journal of Cutaneous Medicine and Surgery, 11(1), 1–3. https://doi.org/10.2310/7750.2007.00001 ↩
Hajat, S. (2017). Health effects of milder winters : A review of evidence from the United Kingdom. Environmental Health, 16(1), 109.
↩
Hajat, S., Haines, A., Sarran, C., Sharma, A., Bates, C., & Fleming, L. E. (2017). The effect of ambient temperature on type-2-diabetes: case-crossover analysis of 4+ million GP consultations across England. Environmental Health : A Global Access Science Source, 16(1), 73. https://doi.org/10.1186/s12940-017-0284-7 ↩
Halliday, G. M., & Byrne, S. N. (2014). An unexpected role : UVA-induced release of nitric oxide from skin may have unexpected health benefits. Journal of Investigative Dermatology, 134(7), 1791‑1794. https://doi.org/10.1038/jid.2014.33 ↩
Hambly, D., Andrey, J., Mills, B., & Fletcher, C. (2013). Projected implications of climate change for road safety in Greater Vancouver, Canada. Climatic Change, 116(3‑4), 613‑629. https://doi.org/10.1007/s10584-012-0499-0 ↩
Hanes, C. C., Wang, X., Jain, P., Parisien, M.-A., Little, J. M., & Flannigan, M. D. (2019). Fire-regime changes in Canada over the last half century. Canadian Journal of Forest Research, 49(3), 256‑269. https://doi.org/10.1139/cjfr-2018-0293 ↩
Hanigan, I. C., Butler, C. D., Kokic, P. N., & Hutchinson, M. F. (2012). Suicide and drought in New South Wales, Australia, 1970–2007. Proceedings of the National Academy of Sciences, 109(35), 13950‑13955. https://doi.org/10.1073/pnas.1112965109 ↩
Harrison, F., van Sluijs, E. M., Corder, K., Ekelund, U., & Jones, A. (2015). The changing relationship between rainfall and children’s physical activity in spring and summer: a longitudinal study. The International Journal of Behavioral Nutrition and Physical Activity, 12, 41. https://doi.org/10.1186/s12966-015-0202-8 ↩
Hart, C. R., Berry, H. L., & Tonna, A. M. (2011). Improving the mental health of rural New South Wales communities facing drought and other adversities. Australian Journal of Rural Health, 19(5), 231‑238. https://doi.org/10.1111/j.1440-1584.2011.01225.x ↩
Hart, P. H., & Norval, M. (2018). Ultraviolet radiation-induced immunosuppression and its relevance for skin carcinogenesis. Photochemical & Photobiological Sciences, 17(12), 1872-1884. doi: 10.1039/C7PP00312A
↩
Hattis, D., Ogneva-Himmelberger, Y., & Ratick, S. (2012). The spatial variability of heat-related mortality in Massachusetts. Applied Geography, 33, 45‑52. https://doi.org/10.1016/j.apgeog.2011.07.008 ↩
He, S., Kosatsky, T., Smargiassi, A., Bilodeau-Bertrand, M., & Auger, N. (2018). Heat and pregnancy-related emergencies : Risk of placental abruption during hot weather. Environment International, 111, 295‑300. https://doi.org/10.1016/j.envint.2017.11.004 ↩
Health Canada. (2020a). Extreme heat and COVID-19 : Considerations for Heat Health Programing in the Context of COVID-19. Advice for Public Health Officials.
↩
Hedlund, C., Blomstedt, Y., & Schumann, B. (2014). Association of climatic factors with infectious diseases in the Arctic and subarctic region—A systematic review. Global Health Action, 7, 1‑16. https://doi.org/10.3402/gha.v7.24161 ↩
Henderson, S. B., Brauer, M., MacNab, Y. C., & Kennedy, S. M. (2011). Three measures of forest fire smoke exposure and their associations with respiratory and cardiovascular health outcomes in a population-based cohort. Environmental Health Perspectives, 119(9), 1266‑1271.
↩
Henderson, S. B., & Johnston, F. H. (2012). Measures of forest fire smoke exposure and their associations with respiratory health outcomes. Current Opinion in Allergy and Clinical Immunology, 12(3), 221‑227.
↩
Henderson, S. B., Wan, V., & Kosatsky, T. (2013). Differences in heat-related mortality across four ecological regions with diverse urban, rural, and remote populations in British Columbia, Canada. Health & Place, 23, 48‑53.
↩
Herrador, B. R. G., De Blasio, B. F., MacDonald, E., Nichols, G., Sudre, B., Vold, L., Semenza, J. C., & Nygård, K. (2015). Analytical studies assessing the association between extreme precipitation or temperature and drinking water-related waterborne infections : A review. Environmental Health, 14(1), 29.
↩
Hetherington, E., McDonald, S., Wu, M., & Tough, S. (2018). Risk and protective factors for mental health and community cohesion after the 2013 Calgary flood. Disaster Medicine and Public Health Preparedness, 12(4), 470‑477. https://doi.org/10.1017/dmp.2017.91 ↩
Hetu, B., Fortin, G., & Brown, K. (2015). Winter climate, land settlement and avalanche dynamics in southern Quebec : An analysis from the known accidents since 1825. Canadian Journal of Earth Sciences, 52(5), 307‑321. https://doi.org/10.1139/cjes-2014-0205 ↩
Hicks, L. A., Rose, C. E., Fields, B. S., Drees, M. L., Engel, J. P., Jenkins, P. R., Rouse, B. S., Blythe, D., Khalifah, A. P., Feikin, D. R., & Whitney, C. G. (2007). Increased rainfall is associated with increased risk for legionellosis. Epidemiology & Infection, 135(5), 811‑817. https://doi.org/10.1017/S0950268806007552 ↩
Ho, H. C., Knudby, A., Xu, Y., Hodul, M., & Aminipouri, M. (2016). A comparison of urban heat islands mapped using skin temperature, air temperature, and apparent temperature (Humidex), for the greater Vancouver area. The Science of the Total Environment, 544, 929‑938.
↩
Holman, D. M., Kapelos, G. T., Shoemaker, M., & Watson, M. (2018). Shade as an environmental design tool for skin cancer prevention. American Journal of Public Health, 108(12), 1607‑1612. https://doi.org/10.2105/AJPH.2018.304700 ↩
Holmer, I. (2009). Evaluation of cold workplaces : An overview of standards for assessment of cold stress. Industrial Health, 47(3), 228‑234.
↩
Holmes, E. A., Xiang, F., & Lucas, R. M. (2015). Variation in incidence of pediatric Crohn’s disease in relation to latitude and ambient ultraviolet radiation : A systematic review and analysis. Inflammatory Bowel Diseases, 21(4), 809‑817. https://doi.org/10.1097/MIB.0000000000000320 ↩
Houghton, A., & Castillo-Salgado, C. (2017). Health Co-Benefits of Green Building Design Strategies and Community Resilience to Urban Flooding: A Systematic Review of the Evidence. International Journal of Environmental Research and Public Health, 14(12), 1519. https://doi.org/10.3390/ijerph14121519 ↩
Howden-Chapman, P., Viggers, H., Chapman, R., O’Sullivan, K., Telfar Barnard, L., & Lloyd, B. (2012). Tackling cold housing and fuel poverty in New Zealand : A review of policies, research, and health impacts. Energy Policy, 49, 134‑142. https://doi.org/10.1016/j.enpol.2011.09.044 ↩
Hsu, A., Sheriff, G., Chakraborty, T., & Manya, D. (2021). Disproportionate exposure to urban heat island intensity across major US cities. Nature Communications, 12(1), 1-11.
↩
Hu, X. F., Singh, K., Kenny, T. A., & Chan, H. M. (2019). Prevalence of heart attack and stroke and associated risk factors among Inuit in Canada: A comparison with the general Canadian population. International Journal of Hygiene and Environmental Health, 222(2), 319-326.
↩
Huang, C., Barnett, A. G., Wang, X., Vaneckova, P., FitzGerald, G., & Tong, S. (2011). Projecting future heat-related mortality under climate change scenarios : A systematic review. Environmental Health Perspectives, 119(12), 1681‑1690. https://doi.org/10.1289/ehp.1103456 ↩
Hung, L.-S., Wang, C., & Yarnal, B. (2016). Vulnerability of families and households to natural hazards : A case study of storm surge flooding in Sarasota County, Florida. Applied Geography, 76, 184‑197. https://doi.org/10.1016/j.apgeog.2016.09.021 ↩
Hurlbert, M., & Gupta, J. (2016). Adaptive governance, uncertainty, and risk : Policy framing and responses to climate change, drought, and flood. Risk Analysis, 36(2), 339‑356.
↩
Huynen, M. M., & Martens, P. (2015). Climate change effects on heat-and cold-related mortality in the Netherlands : A scenario-based integrated environmental health impact assessment. International Journal of Environmental Research and Public Health, 12(10), 13295‑13320.
↩
Ivanov, I. V., Mappes, T., Schaupp, P., Lappe, C., & Wahl, S. (2018). Ultraviolet radiation oxidative stress affects eye health. Journal of Biophotonics, 11(7), e201700377. https://doi.org/10.1002/jbio.201700377 ↩
Jablonski, N. G., & Chaplin, G. (2012). Human skin pigmentation, migration and disease susceptibility. Philosophical Transactions of the Royal Society B, 367(1590), 785‑792.
↩
Jakob, M., & Lambert, S. (2009). Climate change effects on landslides along the southwest coast of British Columbia. Geomorphology, 107(3), 275‑284. https://doi.org/10.1016/j.geomorph.2008.12.009 ↩
Jalliffier-Verne, I., Leconte, R., Huaringa-Alvarez, U., Heniche, M., Madoux-Humery, A.-S., Autixier, L., Galarneau, M., Servais, P., Prevost, M., & Dorner, S. (2017). Modelling the impacts of global change on concentrations of Escherichia coli in an urban river. Advances in Water Resources, 108, 450‑460. https://doi.org/10.1016/j.advwatres.2016.10.001 ↩
Jamieson, J. B., Haegeli, P. & Gauthier, D. (2010). Avalanche Accidents in Canada (Volume 5, 1996-2007). Canadian Avalanche Association. Retrieved from http://www.avalancheassociation.ca ↩
Jay, O., Cramer, M. N., Ravanelli, N. M., & Hodder, S. G. (2015). Should electric fans be used during a heat wave? Applied ergonomics, 46, 137‑143.
↩
Jeong, D. I., Sushama, L., Diro, G. T., Khaliq, M. N., Beltrami, H., & Caya, D. (2016). Projected changes to high temperature events for Canada based on a regional climate model ensemble. Climate Dynamics, 46(9‑10), 3163‑3180.
↩
Jermacane, D., Waite, T. D., Beck, C. R., Bone, A., Amlôt, R., Reacher, M., Kovats, S., Armstrong, B., Leonardi, G., James Rubin, G., & Oliver, I. (2018). The English National Cohort Study of Flooding and Health : The change in the prevalence of psychological morbidity at year two. BMC Public Health, 18(1), 330. https://doi.org/10.1186/s12889-018-5236-9 ↩
Jerrett, M., Arain, A., Kanaroglou, P., Beckerman, B., Potoglou, D., Sahsuvaroglu, T., Morrison, J., & Giovis, C. (2005). A review and evaluation of intraurban air pollution exposure models. Journal of Exposure Science and Environmental Epidemiology, 15(2), 185‑204. https://doi.org/10.1038/sj.jea.7500388 ↩
Johal, S., & Mounsey, Z. (2016). A research-based primer on the potential psychosocial impacts of flooding. Disaster Prevention and Management, 25(1), 104‑110. https://doi.org/10.1108/DPM-09-2015-0206 ↩
Johanning, E., Auger, P., Morey, P. R., Yang, C. S., & Olmsted, E. (2014). Review of health hazards and prevention measures for response and recovery workers and volunteers after natural disasters, flooding, and water damage : Mold and dampness. Environmental Health and Preventive Medicine, 19(2), 93‑99. https://doi.org/10.1007/s12199-013-0368-0 ↩
Johnson-Arbor, K. K., Quental, A. S., & Li, D. (2014). A comparison of carbon monoxide exposures after snowstorms and power outages. American Journal of Preventive Medicine, 46(5), 481‑486. https://doi.org/10.1016/j.amepre.2014.01.006 ↩
Joshua, A. M. (2012). Melanoma prevention : Are we doing enough? A Canadian perspective. Current Oncology, 19(6), e462‑e467. https://doi.org/10.3747/co.19.1222 ↩
Juzeniene, A., & Moan, J. (2012). Beneficial effects of UV radiation other than via vitamin D production. Dermato-Endocrinology, 4(2), 109‑117. https://doi.org/10.4161/derm.20013 ↩
Kaffenberger, B. H., Shetlar, D., Norton, S. A., & Rosenbach, M. (2017). The effect of climate change on skin disease in North America. Journal of the American Academy of Dermatology, 76(1), 140‑147. https://doi.org/10.1016/j.jaad.2016.08.014 ↩
Kampe, E. O. I., Kovats, S., & Hajat, S. (2016). Impact of high ambient temperature on unintentional injuries in high-income countries : A narrative systematic literature review. BMJ Open, 6(2), e010399. https://doi.org/10.1136/bmjopen-2015-010399 ↩
Kapelos, G. T., & Patterson, M. R. S. (2014). Health, planning, design, and shade : A critical review. Journal of Architectural and Planning Research, 31(2), 91‑111. https://www.jstor.org/stable/43031028 ↩
Keesstra, S., Nunes, J., Novara, A., Finger, D., Avelar, D., Kalantari, Z., & Cerdà, A. (2018). The superior effect of nature based solutions in land management for enhancing ecosystem services. The Science of the Total Environment, 610, 997-1009.
↩
Kellens, W., Terpstra, T., & Maeyer, P. D. (2013). Perception and communication of flood risks : A systematic review of empirical research. Risk Analysis, 33(1), 24‑49. https://doi.org/10.1111/j.1539-6924.2012.01844.x ↩
Khabarov, N., Krasovskii, A., Obersteiner, M., Swart, R., Dosio, A., San-Miguel-Ayanz, J., Durrant, T., Camia, A., & Migliavacca, M. (2016). Forest fires and adaptation options in Europe. Regional Environmental Change, 16(1), 21‑30. https://doi.org/10.1007/s10113-014-0621-0 ↩
Khan, S. J., Deere, D., Leusch, F. D. L., Humpage, A., Jenkins, M., & Cunliffe, D. (2015). Extreme weather events : Should drinking water quality management systems adapt to changing risk profiles? Water Research, 85, 124‑136. https://doi.org/10.1016/j.watres.2015.08.018 ↩
Kim, K.-H., Kabir, E., & Kabir, S. (2015). A review on the human health impact of airborne particulate matter. Environment International, 74, 136‑143. https://doi.org/10.1016/j.envint.2014.10.005 ↩
Kim, Y., Kim, H., Gasparrini, A., Armstrong, B., Honda, Y., Chung, Y., Ng, C. F. S., Tobias, A., Íñiguez, C., & Lavigne, E. (2019). Suicide and ambient temperature : A multi-country multi-city study. Environmental Health Perspectives, 127(11), 117007.
↩
Kimeswenger, S., Schwarz, A., Födinger, D., Müller, S., Pehamberger, H., Schwarz, T., & Jantschitsch, C. (2016). Infrared A radiation promotes survival of human melanocytes carrying ultraviolet radiation-induced DNA damage. Experimental Dermatology, 25(6), 447‑452. https://doi.org/10.1111/exd.12968 ↩
Kinney, P. L., Schwartz, J., Pascal, M., Petkova, E., Le Tertre, A., Medina, S., & Vautard, R. (2015). Winter season mortality : Will climate warming bring benefits? Environmental Research Letters, 10(6), 064016.
↩
Kirchmeier‐Young, M. C., Gillett, N. P., Zwiers, F. W., Cannon, A. J., & Anslow, F. S. (2019). Attribution of the influence of human-induced climate change on an extreme fire season. Earth’s Future, 7(1), 2‑10. https://doi.org/10.1029/2018EF001050 ↩
Kirchmeier-Young, M. C., Zwiers, F. W., Gillett, N. P., & Cannon, A. J. (2017). Attributing extreme fire risk in Western Canada to human emissions. Climatic Change, 144(2), 365‑379. https://doi.org/10.1007/s10584-017-2030-0 ↩
Koerth, J., Vafeidis, A. T., & Hinkel, J. (2017). Household-level coastal adaptation and its drivers : A systematic case study review. Risk Analysis, 37(4), 629‑646. https://doi.org/10.1111/risa.12663 ↩
Koetse, M. J., & Rietveld, P. (2009). The impact of climate change and weather on transport : An overview of empirical findings. Transportation Research Part D: Transport and Environment, 14(3), 205‑221. https://doi.org/10.1016/j.trd.2008.12.004 ↩
Kornhall, D. K., & Martens-Nielsen, J. (2016). The prehospital management of avalanche victims. Journal of the Royal Army Medical Corps, 162(6), 406‑412. https://doi.org/10.1136/jramc-2015-000441 ↩
Kosatsky, T., Dufresne, J., Richard, L., Renouf, A., Giannetti, N., Bourbeau, J., Julien, M., Braidy, J., & Sauvé, C. (2009). Heat awareness and response among Montreal residents with chronic cardiac and pulmonary disease. Canadian Journal of Public Health = Revue Canadienne de Sante Publique, 100(3), 237–240. https://doi.org/10.1007/BF03405548 ↩
Kosatsky, T., Henderson, S. B., & Pollock, S. L. (2012). Shifts in mortality during a hot weather event in Vancouver, British Columbia : Rapid assessment with case-only analysis. American journal of public health, 102(12), 2367‑2371.
↩
Kramer, D. M., Tenkate, T., Strahlendorf, P., Kushner, R., Gardner, A., & Holness, D. L. (2015). Sun Safety at Work Canada : A multiple case-study protocol to develop sun safety and heat protection programs and policies for outdoor workers. Implementation Science, 10(1), 97. https://doi.org/10.1186/s13012-015-0277-2 ↩
Laaidi, K., Economopoulou, A., Wagner, V., Pascal, M., Empereur-Bissonnet, P., Verrier, A., & Beaudeau, P. (2013). Cold spells and health : Prevention and warning. Public Health, 127(5), 492‑499. https://doi.org/10.1016/j.puhe.2013.02.011 ↩
Labbé, J., Ford, J. D., Araos, M., & Flynn, M. (2017). The government-led climate change adaptation landscape in Nunavut, Canada. Environmental Reviews, 25(1), 12‑25. doi:10.1139/er-2016-0032
↩
Lai, B. S., Lewis, R., Livings, M. S., La Greca, A. M., & Esnard, A. (2017). Posttraumatic stress symptom trajectories among children after disaster exposure : A review. Journal of Traumatic Stress, 30(6), 571‑582.
↩
Lamond, J. E., Joseph, R. D., & Proverbs, D. G. (2015). An exploration of factors affecting the long term psychological impact and deterioration of mental health in flooded households. Environmental Research, 140, 325‑334. https://doi.org/10.1016/j.envres.2015.04.008 ↩
Lane, K., Charles-Guzman, K., Wheeler, K., Abid, Z., Graber, N., & Matte, T. (2013). Health effects of coastal storms and flooding in urban areas : A review and vulnerability assessment. Journal of Environmental and Public Health, 2013(913064), 13. https://doi.org/10.1155/2013/913064 ↩
Laverdière, É., Généreux, M., Gaudreau, P., Morais, J. A., Shatenstein, B., & Payette, H. (2015). Prevalence of risk and protective factors associated with heat-related outcomes in Southern Quebec : A secondary analysis of the NuAge study. Canadian Journal of Public Health, 106(5), e315‑e321. https://doi.org/10.17269/cjph.106.5029 ↩
Laverdière, É., Payette, H., Gaudreau, P., Morais, J. A., Shatenstein, B., & Généreux, M. (2016). Risk and protective factors for heat-related events among older adults of Southern Quebec (Canada) : The NuAge study. Canadian Journal of Public Health-Revue Canadienne De Sante Publique, 107(3), E258‑E265. https://doi.org/10.17269/CJPH.107.5599 ↩
Lavigne, E., Gasparrini, A., Wang, X., Chen, H., Yagouti, A., Fleury, M. D., & Cakmak, S. (2014). Extreme ambient temperatures and cardiorespiratory emergency room visits : Assessing risk by comorbid health conditions in a time series study. Environmental Health, 13(1), 5. https://doi.org/10.1186/1476-069X-13-5 ↩
Lavigne, E. (2020). Temperature-related mortality under climate change scenarios in health regions of Canada [Video]. Air Health Science Division of Health Canada. Presented at the NOAA-ECCC webinar. Retrieved from https://www.youtube.com/watch?v=JD-3rVL_5lY ↩
Le, G., Breysse, P., McDermott, A., Eftim, S., Geyh, A., Berman, J., & Curriero, F. (2014). Canadian forest fires and the effects of long-range transboundary air pollution on hospitalizations among the elderly. ISPRS International Journal of Geo-Information, 3(2), 713‑731.
↩
Lebel, G., Dubé, M. & Bustinza, R. (2015). Évaluation du Fichier hebdomadaire des décès pour l’estimation des impacts des vagues de chaleur: rapport. Institut national de santé publique du Québec. Retrieved from https://www.inspq.qc.ca/publications/1962 ↩
Lebel, G., Dubé, M. & Bustinza, R. (2017). Analyse des impacts des vagues régionales de chaleur extrême sur la santé au Québec de 2010 à 2015. Institut national de santé publique du Québec. Retrieved from https://www.inspq.qc.ca/publications/2221 ↩
Lennon, M., Scott, M., & O’Neill, E. (2014). Urban design and adapting to flood risk : The role of green infrastructure. Journal of Urban Design, 19(5), 745‑758. https://doi.org/10.1080/13574809.2014.944113 ↩
Lesnikowski, A., Ford, J., Berrang-Ford, L., Barrera, M., & Heymann, J. (2015). How are we adapting to climate change ? A global assessment. Mitigation and Adaptation Strategies for Global Change, 20(2), 277‑293.
↩
Lesnikowski, A., Ford, J., Biesbroek, R., Berrang-Ford, L., & Heymann, S. J. (2016). National-level progress on adaptation. Nature Climate Change, 6(3), 261‑264. https://doi.org/10.1038/nclimate2863 ↩
Lévesque, B., Gervais, M.-C., Chevalier, P., Gauvin, D., Anassour-Laouan-Sidi, E., Gingras, S., Fortin, N., Brisson, G., Greer, C., & Bird, D. (2014). Prospective study of acute health effects in relation to exposure to cyanobacteria. The Science of the Total Environment, 466‑467, 397‑403. https://doi.org/10.1016/j.scitotenv.2013.07.045 ↩
Levi, M., Kjellstrom, T., & Baldasseroni, A. (2018). Impact of climate change on occupational health and productivity : A systematic literature review focusing on workplace heat. Medicina Del Lavoro, 109(3), 163‑179. https://doi.org/10.23749/mdl.v109i3.6851 ↩
Levy, K., Woster, A. P., Goldstein, R. S., & Carlton, E. J. (2016). Untangling the impacts of climate change on waterborne diseases : A systematic review of relationships between diarrheal diseases and temperature, rainfall, flooding, and drought. Environmental Science & Technology, 50(10), 4905‑4922.
↩
Leyva, E. W. A., Beaman, A., & Davidson, P. M. (2017). Health impact of climate change in older people : An integrative review and implications for nursing. Journal of Nursing Scholarship, 49(6), 670‑678. https://doi.org/10.1111/jnu.12346 ↩
L’Hérault, E., Allard, M., Fortier, D., Carbonneau, A., Doyon-Robitaille, J., Lachance, M. P., Ducharme, M.A., Larrivée, K., Grandmont, K., & Lemieux, C. (2013). Production de cartes des caractéristiques du pergélisol afin de guider le développement de l’environnement bâti pour quatre communautés du Nunavik. Centre d’études nordiques, Université Laval. Montréal, QC.
↩
Liddell, C., Morris, C., Thomson, H., & Guiney, C. (2016). Excess winter deaths in 30 European countries 1980-2013 : A critical review of methods. Journal of Public Health, 38(4), 806‑814. https://doi.org/10.1093/pubmed/fdv184 ↩
Lim, Y.-H., Hong, Y.-C., & Kim, H. (2012). Effects of diurnal temperature range on cardiovascular and respiratory hospital admissions in Korea. The Science of the Total Environment, 417‑418, 55‑60. https://doi.org/10.1016/j.scitotenv.2011.12.048 ↩
Lim, Y.-H., So, R., Lee, C., Hong, Y.-C., Park, M., Kim, L., & Yoon, H.-J. (2018). Ambient temperature and hospital admissions for acute kidney injury : A time-series analysis. The Science of the Total Environment, 616, 1134‑1138.
↩
Lin, S., Lawrence, W. R., Lin, Z., DiRienzo, S., Lipton, K., Dong, G.-H., Leung, R., Lauper, U., Nasca, P., & Stuart, N. (2018). Are the current thresholds, indicators, and time window for cold warning effective enough to protect cardiovascular health? The Science of the Total Environment, 639, 860‑867.
↩
Linos, E., Keiser, E., Kanzler, M., Sainani, K. L., Lee, W., Vittinghoff, E., Chren, M.-M., & Tang, J. Y. (2012). Sun protective behaviors and vitamin D levels in the US population : NHANES 2003–2006. Cancer Causes & Control, 23(1), 133‑140. https://doi.org/10.1007/s10552-011-9862-0 ↩
Liotta, G., Inzerilli, M. C., Palombi, L., Madaro, O., Orlando, S., Scarcella, P., Betti, D., & Marazzi, M. C. (2018). Social interventions to prevent heat-related mortality in the older adult in Rome, Italy : A quasi-experimental study. International Journal of Environmental Research and Public Health, 15(4), 715. https://doi.org/10.3390/ijerph15040715 ↩
Liu, D., Fernandez, B. O., Hamilton, A., Lang, N. N., Gallagher, J. M. C., Newby, D. E., Feelisch, M., & Weller, R. B. (2014). UVA irradiation of human skin vasodilates arterial vasculature and lowers blood pressure independently of nitric oxide synthase. Journal of Investigative Dermatology, 134(7), 1839‑1846. https://doi.org/10.1038/jid.2014.27 ↩
Liu, G. T., Dancause, K. N., Elgbeili, G., Laplante, D. P., & King, S. (2016a). Disaster-related prenatal maternal stress explains increasing amounts of variance in body composition through childhood and adolescence : Project Ice Storm. Environmental Research, 150, 1‑7. https://doi.org/10.1016/j.envres.2016.04.039 ↩
Liu, J. C., Mickley, L. J., Sulprizio, M. P., Yue, X., Peng, R. D., Dominici, F., & Bell, M. L. (2016b). Future respiratory hospital admissions from wildfire smoke under climate change in the Western US. Environmental Research Letters, 11(12), 124018.
↩
Liu, J. C., Wilson, A., Mickley, L. J., Ebisu, K., Sulprizio, M. P., Wang, Y., Peng, R. D., Yue, X., Dominici, F., & Bell, M. L. (2017). Who among the elderly is most vulnerable to exposure to and health risks of fine particulate matter from wildfire smoke? American Journal of Epidemiology, 186(6), 730‑735. https://doi.org/10.1093/aje/kwx141 ↩
Lowe, D., Ebi, K. L., & Forsberg, B. (2013). Factors increasing vulnerability to health effects before, during and after floods. International Journal of Environmental Research and Public Health, 10(12), 7015‑7067. https://doi.org/10.3390/ijerph10127015 ↩
Lu, C., Yang, J., Yu, W., Li, D., Xiang, Z., Lin, Y., & Yu, C. (2015). Association between 25(OH)D level, ultraviolet exposure, geographical location, and inflammatory bowel disease activity : A systematic review and meta-analysis. Plos One, 10(7), e0132036. https://doi.org/10.1371/journal.pone.0132036 ↩
Lucas, R. (2010). Solar ultraviolet radiation : Assessing the environmental burden of disease at national and local levels. Organisation mondiale de la Santé.
↩
Lucas, R. M., Byrne, S. N., Correale, J., Ilschner, S., & Hart, P. H. (2015). Ultraviolet radiation, vitamin D and multiple sclerosis. Neurodegenerative Disease Management, 5(5), 413‑424. https://doi.org/10.2217/nmt.15.33 ↩
Lundgren Kownacki, K., Gao, C., Kuklane, K., & Wierzbicka, A. (2019). Heat stress in indoor environments of Scandinavian urban areas : A literature review. International Journal of Environmental Research and Public Health, 16(4). https://doi.org/10.3390/ijerph16040560 ↩
Lutsch, E., Dammers, E., Conway, S., & Strong, K. (2016). Long-range transport of NH3, CO, HCN, and C2H6 from the 2014 Canadian wildfires. Geophysical Research Letters, 43(15), 8286‑8297. https://doi.org/10.1002/2016GL070114 ↩
Macciotta, R., & Lefsrud, L. (2018). Framework for developing risk to life evaluation criteria associated with landslides in Canada. Geoenvironmental Disasters, 5(1), 10.
↩
Mak, P. W., & Singleton, J. (2017). Burning questions : Exploring the impact of natural disasters on community pharmacies. Research in Social and Administrative Pharmacy, 13(1), 162‑171.
↩
Mäkinen, T. M., Juvonen, R., Jokelainen, J., Harju, T. H., Peitso, A., Bloigu, A., Silvennoinen-Kassinen, S., Leinonen, M., & Hassi, J. (2009). Cold temperature and low humidity are associated with increased occurrence of respiratory tract infections. Respiratory Medicine, 103(3), 456‑462. https://doi.org/10.1016/j.rmed.2008.09.011 ↩
Maltais, D. (2006). Impact of the July 1996 floods on older persons in Quebec’s Saguenay region. Université du Québec à Chicoutimi.
↩
Manning, C., & Clayton, S. (2018). Threats to mental health and wellbeing associated with climate change. In S. Clayton & C. Manning (Eds.), Psychology and Climate change: Human perceptions, impacts and responses (pp. 217-44). Amsterdam, Netherlands: Academic Press.
↩
Manuel, P., Rapaport, E., Keefe, J., & Krawchenko, T. (2015). Coastal climate change and aging communities in Atlantic Canada : A methodological overview of community asset and social vulnerability mapping. The Canadian Geographer = Le Géographe Canadien, 59(4), 433‑446. https://doi.org/10.1111/cag.12203 ↩
Mares, D. (2013). Climate change and levels of violence in socially disadvantaged neighborhood groups. Journal of Urban Health, 90(4), 768‑783. https://doi.org/10.1007/s11524-013-9791-1 ↩
Martel, B., Ouarda, T. B., Vanasse, A., Chebana, F., Orzanco, M. G., Charron, C., Courteau, J., Asghari, S., & Gosselin, P. (2010). Modélisation des fractures de la hanche en fonction de variables météorologiques à l’aide du modèle GAM dans deux régions métropolitaines du Québec, Canada. INRS, Centre Eau, Terre et Environnement.
↩
Martin, S. L., Cakmak, S., Hebbern, C. A., Avramescu, M.-L., & Tremblay, N. (2012). Climate change and future temperature-related mortality in 15 Canadian cities. International Journal of Biometeorology, 56(4), 605‑619. https://doi.org/10.1007/s00484-011-0449-y ↩
Martinez Garcia, D., & Sheehan, M. C. (2016). Extreme weather-driven disasters and children’s health. International Journal of Health Services, 46(1), 79‑105. https://doi.org/10.1177/0020731415625254 ↩
Matz, C. J., Egyed, M., Xi, G., Racine, J., Pavlovic, R., Rittmaster, R., Henderson, S. B., & Stieb, D. M. (2020). Health impact analysis of PM2.5 from wildfire smoke in Canada (2013-2015, 2017-2018). The Science of the Total Environment, 725, 138506. https://doi.org/10.1016/j.scitotenv.2020.138506 ↩
Mavrogianni, A., Wilkinson, P., Davies, M., Biddulph, P., & Oikonomou, E. (2012). Building characteristics as determinants of propensity to high indoor summer temperatures in London dwellings. Building and Environment, 55, 117‑130.
↩
Mayer-Jouanjean, I., & Bleau, N. (2018). Historique des sinistres d’inondations et d’étiages et des conditions météorologiques associées. Ouranos.
↩
McClelland, E., Amlôt, R., Rogers, M. B., Rubin, G. J., Tesh, J., & Pearce, J. M. (2017). Psychological and physical impacts of extreme events on older adults : Implications for communications. Disaster Medicine and Public Health Preparedness, 11(1), 127‑134.
↩
McIntyre, K. M., Setzkorn, C., Hepworth, P. J., Morand, S., Morse, A. P., & Baylis, M. (2017). Systematic assessment of the climate sensitivity of important human and domestic animals pathogens in Europe. Scientific reports, 7(1), 7134.
↩
McKinley, A., Janda, M., Auster, J., & Kimlin, M. (2011). In vitro model of vitamin D synthesis by UV radiation in an Australian urban environment. Photochemistry and Photobiology, 87(2), 447‑451. https://doi.org/10.1111/j.1751-1097.2010.00865.x ↩
McLean, K., Yao, J., & Henderson, S. (2015). An evaluation of the British Columbia Asthma Monitoring System (BCAMS) and PM2.5 exposure metrics during the 2014 forest fire season. International Journal of Environmental Research and Public Health, 12(6), 6710‑6724. https://doi.org/10.3390/ijerph120606710 ↩
McMartin, D. W., Merino, B. H. H., Bonsal, B., Hurlbert, M., Villalba, R., Ocampo, O. L., Upegui, J. J. V., Poveda, G., & Sauchyn, D. J. (2018). Limitations of water resources infrastructure for reducing community vulnerabilities to extremes and uncertainty of flood and drought. Environmental Management, 62, 1038-1047.
↩
Medina, A., Akbar, A., Baazeem, A., Rodriguez, A. & Magan, N. (2017). Climate change, food security and mycotoxins: do we know enough? Fungal Biology Reviews, 31(3), 143‑154. doi:10.1016/j.fbr.2017.04.002
↩
Mehiriz, K., & Gosselin, P. (2016). Municipalities’ Preparedness for Weather Hazards and Response to Weather Warnings. PLOS ONE, 11(9), e0163390. https://doi.org/10.1371/journal.pone.0163390 ↩
Mehiriz, K., & Gosselin, P. (2017). Évaluation du projet pilote d’alertes téléphoniques automatisées pour les personnes vulnérables à la chaleur et au smog. Institut national de la recherche scientifique, Centre Eau Terre Environnement. Retrieved from http://espace.inrs.ca/6285/ ↩
Mehiriz, K., Gosselin, P., Tardif, I., Lemieux, M.-A., Mehiriz, K., Gosselin, P., Tardif, I., & Lemieux, M.-A. (2018). The effect of an automated phone warning and health advisory system on adaptation to high heat episodes and health services use in vulnerable groups—Evidence from a randomized controlled study. International Journal of Environmental Research and Public Health, 15(8), 1581. https://doi.org/10.3390/ijerph15081581 ↩
Modarres, R., Ouarda, T. B., Vanasse, A., Orzanco, M. G., & Gosselin, P. (2014). Modeling climate effects on hip fracture rate by the multivariate GARCH model in Montreal region, Canada. International Journal of Biometeorology, 58(5), 921‑930.
↩
Modenese, A., Korpinen, L., & Gobba, F. (2018). Solar radiation exposure and outdoor work : An underestimated occupational risk. International Journal of Environmental Research and Public Health, 15(10), 2063. https://doi.org/10.3390/ijerph15102063 ↩
Moghadamnia, M. T., Ardalan, A., Mesdaghinia, A., Keshtkar, A., Naddafi, K., & Yekaninejad, M. S. (2017). Ambient temperature and cardiovascular mortality : A systematic review and meta-analysis. Peerj, 5, e3574. https://doi.org/10.7717/peerj.3574 ↩
Monteiro, A. F., Rato, M., & Martins, C. (2016). Drug-induced photosensitivity : Photoallergic and phototoxic reactions. Clinics in Dermatology, 34(5), 571‑581. https://doi.org/10.1016/j.clindermatol.2016.05.006 ↩
Moquin, P. A., & Wrona, F. J. (2015). Effects of permafrost degradation on water and sediment quality and heterotrophic bacterial production of Arctic tundra lakes : An experimental approach. Limnology and Oceanography, 60(5), 1484‑1497. https://doi.org/10.1002/lno.10110 ↩
Morency, P., Voyer, C., Burrows, S., & Goudreau, S. (2012). Outdoor falls in an urban context: winter weather impacts and geographical variations. Canadian Journal of Public Health = Revue Canadienne de Sante Publique, 103(3), 218–222. https://doi.org/10.1007/BF03403816 ↩
Moritz, M. A., Batllori, E., Bradstock, R. A., Gill, A. M., Handmer, J., Hessburg, P. F., Leonard, J., McCaffrey, S., Odion, D. C., Schoennagel, T., & Syphard, A. D. (2014). Learning to coexist with wildfire. Nature, 515(7525), 58‑66. https://doi.org/10.1038/nature13946 ↩
Moudrak, N., Feltmate, B., Venema, H., & Osman, H. (2018). Combatting Canada’s rising flood costs : Natural infrastructure is an underutilized option. Insurance Bureau of Canada, University of Waterloo, Intact Centre on Climate Adaptation, and International Institute for Sustainable Development. Retrieved from http://www.ibc.ca/ab/resources/studies/natural-infrastructure-is-an-underutilized-option ↩
Mulchandani, R., Smith, M., Armstrong, B., English National Study of Flooding and Health Study Group, Beck, C. R., & Oliver, I. (2019). Effect of insurance-related factors on the association between flooding and mental health outcomes. International Journal of Environmental Research and Public Health, 16(7), 1174. https://doi.org/10.3390/ijerph16071174 ↩
Munro, A., Kovats, R. S., Rubin, G. J., Waite, T. D., Bone, A., & Armstrong, B. (2017). Effect of evacuation and displacement on the association between flooding and mental health outcomes : A cross-sectional analysis of UK survey data. The Lancet. Planetary Health, 1(4), e134‑e141. https://doi.org/10.1016/S2542-5196(17)30047-5 ↩
Murphy, H. M., Thomas, M. K., Schmidt, P. J., Medeiros, D. T., McFadyen, S., & Pintar, K. D. (2016). Estimating the burden of acute gastrointestinal illness due to Giardia, Cryptosporidium, Campylobacter, E. coli O157 and norovirus associated with private wells and small water systems in Canada. Epidemiology and infection, 144(7), 1355–1370. https://doi.org/10.1017/S0950268815002071 ↩
Na, H. R., Heisler, G. M., Nowak, D. J., & Grant, R. H. (2014). Modeling of urban trees’ effects on reducing human exposure to UV radiation in Seoul, Korea. Urban Forestry & Urban Greening, 13(4), 785‑792. https://doi.org/10.1016/j.ufug.2014.05.009 ↩
Navarro, K. M., Schweizer, D., Balmes, J. R., & Cisneros, R. (2018). A review of community smoke exposure from wildfire compared to prescribed fire in the United States. Atmosphere, 9(5), 185.
↩
Neale, R. E., Barnes, P. W., Robson, T. M., Neale, P. J., Williamson, C. E., Zepp, R. G., … & Zhu, M. (2021). Environmental effects of stratospheric ozone depletion, UV radiation, and interactions with climate change: UNEP Environmental Effects Assessment Panel, Update 2020. Photochemical & Photobiological Sciences, 20(1), 1-67. https://doi.org/10.1007/s43630-020-00001-x ↩
Ng, F., Wilson, L., & Veitch, C. (2015). Climate adversity and resilience : The voice of rural Australia. Rural and Remote Health, 15(4), 1‑12.
↩
Ngom, R., Gosselin, P., & Blais, C. (2016). Reduction of disparities in access to green spaces : Their geographic insertion and recreational functions matter. Applied Geography, 66, 35‑51. https://doi.org/10.1016/j.apgeog.2015.11.008 ↩
Nordio, F., Zanobetti, A., Colicino, E., Kloog, I., & Schwartz, J. (2015). Changing patterns of the temperature-mortality association by time and location in the US, and implications for climate change. Environment International, 81, 80‑86. https://doi.org/10.1016/j.envint.2015.04.009 ↩
Nowak, D. J., Hirabayashi, S., Bodine, A., & Hoehn, R. (2013). Modeled PM2.5 removal by trees in ten U.S. cities and associated health effects. Environmental Pollution, 178, 395‑402. https://doi.org/10.1016/j.envpol.2013.03.050 ↩
OBrien, L., Berry, H., Coleman, C., & Hanigan, I. (2014). Drought as a mental health exposure. Environmental Research, 131, 181‑187.
↩
Office of the Auditor General of Canada. (2018). Perspectives on Climate Change Action in Canada—A Collaborative Report from Auditors General. Commissioner of the Environment and Sustainable Development from the Office of the Auditor General of Canada, and auditors general of provinces and territories. Retrieved from https://www.oag-bvg.gc.ca/internet/English/parl_otp_201803_e_42883.html ↩
Ordon, M., Welk, B., Li, Q., Wang, J., Lavigne, E., Yagouti, A., Copes, R., Cakmak, S., & Chen, H. (2016). Ambient temperature and the risk of renal colic : A population-based study of the impact of demographics and comorbidity. Journal of Endourology, 30(10), 1138‑1143. https://doi.org/10.1089/end.2016.0374 ↩
Page, C. E., Atkins, D., Shockley, L. W., & Yaron, M. (1999). Avalanche deaths in the United States: a 45-year analysis. Wilderness & Environmental Medicine, 10(3), 146-151.
↩
Page, L. A., Hajat, S., Kovats, R. S., & Howard, L. M. (2012). Temperature-relkated deaths in people with psychosis, dementia and substance misuse. The British Journal of Psychiatry, 200(6), 485‑490. https://doi.org/10.1192/bjp.bp.111.100404 ↩
Parsons, K. (2014). Human thermal environments : The effects of hot, moderate, and cold environments on human health, comfort, and performance. CRC press.
↩
Parsons, N., Odumenya, M., Edwards, A., Lecky, F., & Pattison, G. (2011). Modelling the effects of the weather on admissions to UK trauma units : A cross-sectional study. Emergency Medicine Journal, 28(10), 851‑855.
↩
Patrick, R. J. (2018). Adapting to climate change through source water protection : Case studies from Alberta and Saskatchewan, Canada. The International Indigenous Policy Journal, 9(3), 1.
↩
Pendrey, C. G. A., Carey, M., & Stanley, J. (2014). Impacts of extreme weather on the health and well-being of people who are homeless. Australian Journal of Primary Health, 20(1), 2‑3. https://doi.org/10.1071/PY13136 ↩
Peters, C. E., Nicol, A. M., & Demers, P. A. (2012). Prevalence of exposure to solar ultraviolet radiation (UVR) on the job in Canada. Canadian Journal of Public Health = Revue Canadienne de Sante Publique, 103(3), 223–226. https://doi.org/10.1007/BF03403817 ↩
Phung, D., Thai, P. K., Guo, Y., Morawska, L., Rutherford, S., & Chu, C. (2016). Ambient temperature and risk of cardiovascular hospitalization : An updated systematic review and meta-analysis. The Science of the Total Environment, 550, 1084‑1102. https://doi.org/10.1016/j.scitotenv.2016.01.154 ↩
Pierce, J. R., Morley, S. K., West, T. A., Pentecost, P., Upton, L. A., & Banks, L. (2017). Improving long-term care facility disaster preparedness and response : A literature review. Disaster Medicine and Public Health Preparedness, 11(1), 140‑149.
↩
Pinault, L., Bushnik, T., Fioletov, V., Peters, C. E., King, W. D., & Tjepkema, M. (2017). The risk of melanoma associated with ambient summer ultraviolet radiation. Health reports, 28(5), 3–11.
↩
Pludowski, P., Holick, M. F., Pilz, S., Wagner, C. L., Hollis, B. W., Grant, W. B., Shoenfeld, Y., Lerchbaum, E., Llewellyn, D. J., Kienreich, K., & Soni, M. (2013). Vitamin D effects on musculoskeletal health, immunity, autoimmunity, cardiovascular disease, cancer, fertility, pregnancy, dementia and mortality—A review of recent evidence. Autoimmunity Reviews, 12(10), 976‑989. https://doi.org/10.1016/j.autrev.2013.02.004 ↩
Porcherie, M., Lejeune, M., Gaudel, M., Pommier, J., Faure, E., Heritage, Z., Rican, S., Simos, J., Cantoreggi, N. L., Roué Le Gall, A., Cambon, L., & Regnaux, J.-P. (2018). Urban green spaces and cancer : A protocol for a scoping review. BMJ Open, 8(2). https://doi.org/10.1136/bmjopen-2017-018851 ↩
Porritt, S. M., Cropper, P. C., Shao, L., & Goodier, C. I. (2012). Ranking of interventions to reduce dwelling overheating during heat waves. Energy and Buildings, 55, 16‑27. https://doi.org/10.1016/j.enbuild.2012.01.043 ↩
Porter, M. J., & Morgenstern, N. R. (2013). Landslide risk evaluation—Canadian technical guidelines and best practices related to landslides : A national initiative for loss reduction. Natural Resources Canada.
↩
Poursafa, P., Keikha, M., & Kelishadi, R. (2015). Systematic review on adverse birth outcomes of climate change. Journal of Research in Medical Sciences: The Official Journal of Isfahan University of Medical Sciences, 20(4), 397.
↩
Poussin, J. K., Botzen, W. J. W., & Aerts, J. C. J. H. (2014). Factors of influence on flood damage mitigation behaviour by households. Environmental Science & Policy, 40, 69‑77. https://doi.org/10.1016/j.envsci.2014.01.013 ↩
Poussin, J. K., Wouter Botzen, W. J., & Aerts, J. C. J. H. (2015). Effectiveness of flood damage mitigation measures : Empirical evidence from French flood disasters. Global Environmental Change, 31, 74‑84. https://doi.org/10.1016/j.gloenvcha.2014.12.007 ↩
Powers, J. R., Dobson, A. J., Berry, H. L., Graves, A. M., Hanigan, I. C., & Loxton, D. (2015). Lack of association between drought and mental health in a cohort of 45–61 year old rural Australian women. Australian and New Zealand journal of public health, 39(6), 518‑523.
↩
Prairie Climate Centre. (2019). The Climate Atlas of Canada (version 2, July 10, 2019). Retrieved from https://climateatlas.ca ↩
Preval, N., Keall, M., Telfar-Barnard, L., Grimes, A., & Howden-Chapman, P. (2017). Impact of improved insulation and heating on mortality risk of older cohort members with prior cardiovascular or respiratory hospitalisations. BMJ Open, 7(11), e018079. https://doi.org/10.1136/bmjopen-2017-018079 ↩
Psarros, C., Theleritis, C., Economou, M., Tzavara, C., Kioulos, K. T., Mantonakis, L., Soldatos, C. R., & Bergiannaki, J.-D. (2017). Insomnia and PTSD one month after wildfires : Evidence for an independent role of the “fear of imminent death”. International Journal of Psychiatry in Clinical Practice, 21(2), 137‑141. https://doi.org/10.1080/13651501.2016.1276192 ↩
Psarros, C., Theleritis, C., Kokras, N., Lyrakos, D., Koborozos, A., Kakabakou, O., Tzanoulinos, G., Katsiki, P., & Bergiannaki, J. D. (2018). Personality characteristics and individual factors associated with PTSD in firefighters one month after extended wildfires. Nordic Journal of Psychiatry, 72(1), 17‑23. https://doi.org/10.1080/08039488.2017.1368703 ↩
Rajaram, N., Hohenadel, K., Gattoni, L., Khan, Y., Birk-Urovitz, E., Li, L., & Schwartz, B. (2016). Assessing health impacts of the December 2013 ice storm in Ontario, Canada. BMC Public Health, 16(1), 544.
↩
Raji, B., Tenpierik, M. J., & van den Dobbelsteen, A. (2015). The impact of greening systems on building energy performance : A literature review. Renewable and Sustainable Energy Reviews, 45, 610‑623.
↩
Ramin, B., & Svoboda, T. (2009). Health of the homeless and climate change. Journal of Urban Health-Bulletin of the New York Academy of Medicine, 86(4), 654‑664. https://doi.org/10.1007/s11524-009-9354-7 ↩
Rapaport, E., Manuel, P., Krawchenko, T., & Keefe, J. (2015). How can aging communities adapt to coastal climate change ? Planning for both social and place vulnerability. Canadian Public Policy, 41(2), 166‑177.
↩
Rappold, A. G., Cascio, W. E., Kilaru, V. J., Stone, S. L., Neas, L. M., Devlin, R. B., & Diaz-Sanchez, D. (2012). Cardio-respiratory outcomes associated with exposure to wildfire smoke are modified by measures of community health. Environmental Health, 11(1), 71.
↩
Rappold, A. G., Fann, N. L., Crooks, J., Huang, J., Cascio, W. E., Devlin, R. B., & Diaz-Sanchez, D. (2014). Forecast-based interventions can reduce the health and economic burden of wildfires. Environmental Science & Technology, 48(18), 10571‑10579. https://doi.org/10.1021/es5012725 ↩
Rappold, A. G., Reyes, J., Pouliot, G., Cascio, W. E., & Diaz-Sanchez, D. (2017). Community vulnerability to health impacts of wildland fire smoke exposure. Environmental Science & Technology, 51(12), 6674‑6682. https://doi.org/10.1021/acs.est.6b06200 ↩
Ravanelli, N. M., Hodder, S. G., Havenith, G., & Jay, O. (2015). Heart rate and body temperature responses to extreme heat and humidity with and without electric fans. JAMA, 313(7), 724‑725. https://doi.org/10.1001/jama.2015.153 ↩
Regroupement des organismes de bassins versants du Québec. (2019). Gestion intégrée de l’eau par bassin versant. La gestion intégrée de l’eau par bassin versant – GIEBV. Retrieved from https://robvq.qc.ca/la-giebv/ ↩
Reid, C. E., Brauer, M., Johnston, F. H., Jerrett, M., Balmes, J. R., & Elliott, C. T. (2016). Critical review of health impacts of wildfire smoke exposure. Environmental Health Perspectives, 124(9), 1334.
↩
Remmers, T., Thijs, C., Timperio, A., Salmon, J., Veitch, J., Kremers, S. P. J., & Ridgers, N. D. (2017). Daily weather and children’s physical activity patterns. Medicine & Science in Sports & Exercise, 49(5), 922‑929. https://doi.org/10.1249/MSS.0000000000001181 ↩
Romps, D. M., Seeley, J. T., Vollaro, D., & Molinari, J. (2014). Projected increase in lightning strikes in the United States due to global warming. Science, 346(6211), 851‑854. https://doi.org/10.1126/science.1259100 ↩
Ross, A. C., Manson, J. E., Abrams, S. A., Aloia, J. F., Brannon, P. M., Clinton, S. K., Durazo-Arvizu, R. A., Gallagher, J. C., Gallo, R. L., Jones, G., Kovacs, C. S., Mayne, S. T., Rosen, C. J., & Shapses, S. A. (2011). The 2011 report on dietary reference intakes for calcium and vitamin D from the institute of medicine : What clinicians need to know. The Journal of Clinical Endocrinology & Metabolism, 96(1), 53‑58. https://doi.org/10.1210/jc.2010-2704 ↩
Rouquette, A., Mandereau-Bruno, L., Baffert, E., Laaidi, K., Josseran, L., & Isnard, H. (2011). Surveillance hivernale des effets du froid sur la santé des populations sans-domicile en région Île-de-France : Utilisation des données du réseau d’Organisation de la surveillance coordonnée des urgences (Oscour®). Revue d’épidémiologie et de santé publique, 59(6), 359‑368. https://doi.org/10.1016/j.respe.2011.05.006 ↩
Rucker, D., Allan, J. A., Fick, G. H. & Hanley, D. A. (2002). Vitamin D insufficiency in a population of healthy western Canadians. CMAJ, 166(12), 1517‑1524.
↩
Ryan, B. J., Franklin, R. C., Burkle, F. M., Watt, K., Aitken, P., Smith, E. C., & Leggat, P. (2016). Defining, describing, and categorizing public health infrastructure priorities for tropical cyclone, flood, storm, tornado, and tsunami-related disasters. Disaster Medicine and Public Health Preparedness, 10(4), 598‑610.
↩
Ryti, N. R. I., Guo, Y., & Jaakkola, J. J. K. (2016). Global association of cold spells and adverse health effects : A systematic review and meta-analysis. Environmental Health Perspectives, 124(1), 12‑22. https://doi.org/10.1289/ehp.1408104 ↩
Sahni, V., Scott, A. N., Beliveau, M., Varughese, M., Dover, D. C., & Talbot, J. (2016). Public health surveillance response following the southern Alberta floods, 2013. Canadian Journal of Public Health, 107(2), e142‑e148. https://doi.org/10.17269/cjph.107.5188 ↩
Sakamoto, R. (2015). Legionnaire’s disease, weather and climate. Bulletin of the World Health Organization, 93(6), 435‑436. https://doi.org/10.2471/BLT.14.142299 ↩
Salamanca, F., Georgescu, M., Mahalov, A., Moustaoui, M. & Wang, M. (2014). Anthropogenic heating of the urban environment due to air conditioning. Journal of Geophysical Research: Atmospheres, 119(10), 5949‑5965. doi:10.1002/2013JD021225
↩
Sanborn, M., & Takaro, T. (2013). Recreational water–related illness: Office management and prevention. Canadian Family Physician, 59(5), 491-495.
↩
Sandhu, P. K., Elder, R., Patel, M., Saraiya, M., Holman, D. M., Perna, F., Smith, R. A., Buller, D., Sinclair, C., Reeder, A., Makin, J., McNoe, B., & Glanz, K. (2016). Community-based interventions to prevent skin cancer : Two community guide systematic reviews. American journal of preventive medicine, 51(4), 531‑539. https://doi.org/10.1016/j.amepre.2016.03.020 ↩
Santamouris, M. (2014). Cooling the cities–a review of reflective and green roof mitigation technologies to fight heat island and improve comfort in urban environments. Solar Energy, 103, 682‑703.
↩
Sartini, C., Barry, S. J. E., Wannamethee, S. G., Whincup, P. H., Lennon, L., Ford, I., & Morris, R. W. (2016). Effect of cold spells and their modifiers on cardiovascular disease events : Evidence from two prospective studies. International Journal of Cardiology, 218, 275‑283. https://doi.org/10.1016/j.ijcard.2016.05.012 ↩
Saulnier, D. D., Ribacke, K. B., & von Schreeb, J. (2017). No calm after the storm : A systematic review of human health following flood and storm disasters. Prehospital and Disaster Medicine, 32(5), 568‑579.
↩
Schmeltz, M. T., Sembajwe, G., Marcotullio, P. J., Grassman, J. A., Himmelstein, D. U., & Woolhandler, S. (2015). Identifying individual risk factors and documenting the pattern of heat-related illness through analyses of hospitalization and patterns of household cooling. PLOS ONE, 10(3), e0118958. https://doi.org/10.1371/journal.pone.0118958 ↩
Schmitt, J., Seidler, A., Diepgen, T. l., & Bauer, A. (2011). Occupational ultraviolet light exposure increases the risk for the development of cutaneous squamous cell carcinoma : A systematic review and meta-analysis. British Journal of Dermatology, 164(2), 291‑307. https://doi.org/10.1111/j.1365-2133.2010.10118.x ↩
Schuster, P. F., Schaefer, K. M., Aiken, G. R., Antweiler, R. C., Dewild, J. F., Gryziec, J. D., Gusmeroli, A., Hugelius, G., Jafarov, E., Krabbenhoft, D. P., Liu, L., Herman‐Mercer, N., Mu, C., Roth, D. A., Schaefer, T., Striegl, R. G., Wickland, K. P., & Zhang, T. (2018). Permafrost stores a globally significant amount of mercury. Geophysical Research Letters, 45(3), 1463‑1471. https://doi.org/10.1002/2017GL075571 ↩
Shore-Lorenti, C., Brennan, S. L., Sanders, K. M., Neale, R. E., Lucas, R. M., & Ebeling, P. R. (2014). Shining the light on sunshine : A systematic review of the influence of sun exposure on type 2 diabetes mellitus-related outcomes. Clinical Endocrinology, 81(6), 799‑811. https://doi.org/10.1111/cen.12567 ↩
Sillmann, J., Kharin, V., Zwiers, F., Zhang, X., & Bronaugh, D. (2013). Climate extremes indices in the CMIP5 multimodel ensemble : Part 2. Future climate projections. Journal of Geophysical Research: Atmospheres, 118(6), 2473‑2493.
↩
Silver, A., & Grek-Martin, J. (2015). “Now we understand what community really means” : Reconceptualizing the role of sense of place in the disaster recovery process. Journal of Environmental Psychology, 42, 32‑41. https://doi.org/10.1016/j.jenvp.2015.01.004 ↩
Simpson, S., van der Mei, I., Lucas, R. M., Ponsonby, A.-L., Broadley, S., Blizzard, L., & Taylor, B. (2018). Sun exposure across the life course significantly modulates early multiple sclerosis clinical course. Frontiers in Neurology, 9, 16. https://doi.org/10.3389/fneur.2018.00016 ↩
Sinickas, A., Jamieson, B., & Maes, M. A. (2016). Snow avalanches in western Canada : Investigating change in occurrence rates and implications for risk assessment and mitigation. Structure and Infrastructure Engineering, 12(4), 490‑498. https://doi.org/10.1080/15732479.2015.1020495 ↩
Sloka, J., Pryse-Phillips, W., & Stefanelli, M. (2008). The relation of ultraviolet radiation and multiple sclerosis in Newfoundland. Canadian Journal of Neurological Sciences, 35(1), 69‑74.
↩
Smargiassi, A., Goldberg, M. S., Plante, C., Fournier, M., Baudouin, Y., & Kosatsky, T. (2009). Variation of daily warm season mortality as a function of micro-urban heat islands. Journal of Epidemiology and Community Health, 63(8), 659–664. https://doi.org/10.1136/jech.2008.078147 ↩
Smith, B. A., & Fazil, A. (2019). Increased risk of microbial foodborne diseases with climate change. Canada Communicable Disease Report, 45(4), 108–113. https://doi.org/10.14745/ccdr.v45i04a05 ↩
Smith, H. G., Sheridan, G. J., Lane, P. N., Nyman, P., & Haydon, S. (2011). Wildfire effects on water quality in forest catchments : A review with implications for water supply. Journal of Hydrology, 396(1‑2), 170‑192.
↩
Song, X., Wang, S., Hu, Y., Yue, M., Zhang, T., Liu, Y., Tian, J., & Shang, K. (2017). Impact of ambient temperature on morbidity and mortality : An overview of reviews. The Science of the Total Environment, 586, 241‑254. https://doi.org/10.1016/j.scitotenv.2017.01.212 ↩
Stephani, E., Fortier, D., Shur, Y., Fortier, R., & Doré, G. (2014). A geosystems approach to permafrost investigations for engineering applications, an example from a road stabilization experiment, Beaver Creek, Yukon, Canada. Cold Regions Science and Technology, 100, 20‑35. https://doi.org/10.1016/j.coldregions.2013.12.006 ↩
Sterk, A., Schijven, J., de Nijs, T., & de Roda Husman, A. M. (2013). Direct and indirect effects of climate change on the risk of infection by water-transmitted pathogens. Environmental science & technology, 47(22), 12648–12660. https://doi.org/10.1021/es403549s ↩
St-Hilaire, A., Steiger, H., Liu, A., Laplante, D. P., Thaler, L., Magill, T., & King, S. (2015). A prospective study of effects of prenatal maternal stress on later eating-disorder manifestations in affected offspring : Preliminary indications based on the project ice storm cohort. International Journal of Eating Disorders, 48(5), 512‑516.
↩
Stone, B., Hess, J. J., & Frumkin, H. (2010). Urban form and extreme heat events : Are sprawling cities more vulnerable to climate change than compact cities? Environmental Health Perspectives, 118(10), 1425‑1428. https://doi.org/10.1289/ehp.0901879 ↩
Stone, B., Vargo, J., Liu, P., Habeeb, D., DeLucia, A., Trail, M., Hu, Y., & Russell, A. (2014). Avoided heat-related mortality through climate adaptation strategies in three US cities. Plos One, 9(6), e100852. https://doi.org/10.1371/journal.pone.0100852 ↩
Strand, L. B., Barnett, A. G., & Tong, S. (2011). The influence of season and ambient temperature on birth outcomes : A review of the epidemiological literature. Environmental Research, 111(3), 451‑462. https://doi.org/10.1016/j.envres.2011.01.023 ↩
Sun, Z., Chen, C., Xu, D., & Li, T. (2018). Effects of ambient temperature on myocardial infarction : A systematic review and meta-analysis. Environmental Pollution, 241, 1106‑1114. https://doi.org/10.1016/j.envpol.2018.06.045 ↩
Sutherland, L.-A., & Glendinning, T. (2008). Farm family coping with stress : The impact of the 1998 ice storm. Journal of Comparative Family Studies, 39(4), 527‑543.
↩
Tallis, M., Taylor, G., Sinnett, D., & Freer-Smith, P. (2011). Estimating the removal of atmospheric particulate pollution by the urban tree canopy of London, under current and future environments. Landscape and Urban Planning, 103(2), 129‑138. https://doi.org/10.1016/j.landurbplan.2011.07.003 ↩
Tan, J., Zheng, Y., Tang, X., Guo, C., Li, L., Song, G., Zhen, X., Yuan, D., Kalkstein, A. J., & Li, F. (2010). The urban heat island and its impact on heat waves and human health in Shanghai. International Journal of Biometeorology, 54(1), 75‑84.
↩
Tapsell, S. M., & Tunstall, S. M. (2008). “I wish I’d never heard of Banbury” : The relationship between ‘place’ and the health impacts from flooding. Health & Place, 14(2), 133‑154. https://doi.org/10.1016/j.healthplace.2007.05.006 ↩
Tempark, T., Lueangarun, S., Chatproedprai, S., & Wananukul, S. (2013). Flood-related skin diseases : A literature review. International Journal of Dermatology, 52(10), 1168‑1176. https://doi.org/10.1111/ijd.12064 ↩
Tereszchuk, K. A., Rochon, Y. J., McLinden, C. A., & Vaillancourt, P. A. (2018). Optimizing UV Index determination from broadband irradiances. Geoscientific Model Development, 11(3), 1093‑1113. https://doi.org/10.5194/gmd-11-1093-2018 ↩
Thompson, R., Garfin, D. R., & Silver, R. C. (2017). Evacuation from natural disasters : A systematic review of the literature. Risk Analysis, 37(4), 812‑839.
↩
Thompson, R., Hornigold, R., Page, L., & Waite, T. (2018). Associations between high ambient temperatures and heat waves with mental health outcomes : A systematic review. Public Health, 161, 171‑191. https://doi.org/10.1016/j.puhe.2018.06.008 ↩
Thomson, H., Snell, C., & Bouzarovski, S. (2017). Health, well-being and energy poverty in Europe : A comparative study of 32 European countries. International Journal of Environmental Research and Public Health, 14(6). https://doi.org/10.3390/ijerph14060584 ↩
Thordardottir, E. B., Valdimarsdottir, U. A., Hansdottir, I., Resnick, H., Shipherd, J. C., & Gudmundsdottir, B. (2015). Posttraumatic stress and other health consequences of catastrophic avalanches : A 16-year follow-up of survivors. Journal of Anxiety Disorders, 32, 103‑111. https://doi.org/10.1016/j.janxdis.2015.03.005 ↩
Toloo, G., FitzGerald, G., Aitken, P., Verrall, K., & Tong, S. (2013). Evaluating the effectiveness of heat warning systems : Systematic review of epidemiological evidence. International Journal of Public Health, 58(5), 667‑681. https://doi.org/10.1007/s00038-013-0465-2 ↩
Touchaei, A. G., & Akbari, H. (2015). Evaluation of the seasonal effect of increasing albedo on urban climate and energy consumption of buildings in Montreal. Urban Climate, 14, 278‑289. https://doi.org/10.1016/j.uclim.2015.09.007 ↩
Toutant, S., Gosselin, P., Bélanger, D., Bustinza, R., & Rivest, S. (2011). An open source web application for the surveillance and prevention of the impacts on public health of extreme meteorological events: the SUPREME system. International Journal of Health Geographics, 10, 39. https://doi.org/10.1186/1476-072X-10-39 ↩
Townshend, I., Awosoga, O., Kulig, J., Botey, A. P., Shepard, B., & McFarlane, B. (2015). Impacts of wildfires on school children : A case study of Slave Lake, Alberta, Canada. International Journal of Mass Emergencies & Disasters, 33(2), 148-187.
↩
Tunstall, S., Tapsell, S., Green, C., Floyd, P., & George, C. (2006). The health effects of flooding : Social research results from England and Wales. Journal of Water and Health, 4(3), 365‑380. https://doi.org/10.2166/wh.2006.031 ↩
Turcotte-Tremblay, A. M., Lim, R., Laplante, D. P., Kobzik, L., Brunet, A., & King, S. (2014). Prenatal maternal stress predicts childhood asthma in girls: project ice storm. BioMed Research International, 2014, 201717. https://doi.org/10.1155/2014/201717 ↩
Turner, L., Alderman, K., & Tong, S. (2012a). The 2011 Brisbane floods affected residents’ health. Medical Journal of Australia, 197(4), 214‑216.
↩
Turner, L. R., Barnett, A. G., Connell, D., & Tong, S. (2012b). Ambient temperature and cardiorespiratory morbidity : A systematic review and meta-analysis. Epidemiology, 23(4), 594‑606. https://doi.org/10.1097/EDE.0b013e3182572795 ↩
Vahmani, P., Jones, A. D., & Patricola, C. M. (2019). Interacting implications of climate change, population dynamics, and urban heat mitigation for future exposure to heat extremes. Environmental Research Letters, 14(8), 084051. https://doi.org/10.1088/1748-9326/ab28b0 ↩
Valois, P., Bouchard, D., Talbot, D., Caron, M., Renaud, J. S., Gosselin, P. & Jacob, J. (2020a). Adoption of flood-related preventive behaviours by people having different risks and histories of flooding. Natural Hazards, 102(3), 1155-1173. https://doi.org/10.1007/s11069-020-03950-9 ↩
Valois, P., Caron, M., Gousse-Lessard, A. S., Talbot, D., & Renaud, J. S. (2019). Development and validation of five behavioral indices of flood adaptation. BMC public health, 19(1), 1-17. https://doi.org/10.1186/s12889-019-6564-0 ↩
Valois, P., Talbot, D., Caron, M., Carrier, M.-P., Morin, A. J. S., Renaud, J.-S., Jacob, J. & Gosselin, P. (2017b). Development and Validation of a Behavioural Index for Adaptation to High Summer Temperatures among Urban Dwellers. International Journal of Environmental Research and Public Health, 14(7), 820. https://doi.org/10.3390/ijerph14070820 ↩
Valois, P., Talbot, D., Bouchard, D., Renaud, J. S., Caron, M., Canuel, M. & Arrambourg, N. (2020b). Using the theory of planned behavior to identify key beliefs underlying heat adaptation behaviors in elderly populations. Population and Environment, 41, 480-506. https://doi.org/10.1007/s11111-020-00347-5 ↩
Vanasse, A., Cohen, A., Courteau, J., Bergeron, P., Chebana, F., Gosselin, P., Rochette, L., Blais, C., & Ouarda, T. B. M. J. (2015). Impact des inondations importantes sur la santé cardiovasculaire au Québec : Les cas de Saguenay (1996) et de St-Jean-sur-Richelieu (2011) : Rapport final. INRS, Centre Eau Terre Environnement. Retrieved from http://espace.inrs.ca/2814/ ↩
Vanasse, A., Cohen, A., Courteau, J., Bergeron, P., Dault, R., Gosselin, P., Blais, C., Bélanger, D., Rochette, L., Chebana, F. (2016a). Association between floods and acute cardiovascular diseases : A population-based cohort study using a geographic information system approach. International Journal of Environmental Research and Public Health, 13(2), 168. https://doi.org/10.3390/ijerph13020168 ↩
Vanasse, A., Talbot, D., Chebana, F., Bélanger, D., Gosselin, P., Blais, C., Gamache, P., Giroux, J.-X., & Dault, R. (2016b). Impact des conditions météorologiques sur le délai de survenue des événements d’insuffisance cardiaque chez les personnes âgées de 65 ans et plus diagnostiquées avec cette condition médicale au Québec, de 2001 à 2011 : Rapport final. INRS, Centre Eau Terre Environnement. Retrieved from http://espace.inrs.ca/5789/ ↩
van der Leun, J. C., Piacentini, R. D., & Gruijl, F. R. de. (2008). Climate change and human skin cancer. Photochemical & Photobiological Sciences, 7(6), 730‑733. https://doi.org/10.1039/B719302E ↩
Vanos, J. K. (2015). Children’s health and vulnerability in outdoor microclimates : A comprehensive review. Environment International, 76, 1‑15.
↩
VanStone, N., van Dijk, A., Chisamore, T., Mosley, B., Hall, G., Belanger, P., & Moore, K. M. (2017). Characterizing the effects of extreme cold using real-time syndromic surveillance, Ontario, Canada, 2010-2016. Public Health Reports, 132, 48S-52S. https://doi.org/10.1177/0033354917708354 ↩
Varghese, B. M., Hansen, A., Bi, P., & Pisaniello, D. (2018). Are workers at risk of occupational injuries due to heat exposure? A comprehensive literature review. Safety Science, 110, 380‑392. https://doi.org/10.1016/j.ssci.2018.04.027 ↩
Veru, F., Dancause, K., Laplante, D. P., King, S., & Luheshi, G. (2015). Prenatal maternal stress predicts reductions in CD4+lymphocytes, increases in innate-derived cytokines, and a Th2 shift in adolescents : Project Ice Storm. Physiology & Behavior, 144, 137‑145. https://doi.org/10.1016/j.physbeh.2015.03.016 ↩
Vida, S., Durocher, M., Ouarda, T. B. M. J., & Gosselin, P. (2012). Relationship between ambient temperature and humidity and visits to mental health emergency departments in Québec. Psychiatric Services, 63(11), 1150‑1153. https://doi.org/10.1176/appi.ps.201100485 ↩
Vieth, R., Cole, D. E., Hawker, G. A., Trang, H. M., & Rubin, L. A. (2001). Wintertime vitamin D insufficiency is common in young Canadian women, and their vitamin D intake does not prevent it. European Journal of Clinical Nutrition, 55(12), 1091‑1097. https://doi.org/10.1038/sj.ejcn.1601275 ↩
Vins, H., Bell, J., Saha, S., & Hess, J. J. (2015). The mental health outcomes of drought : A systematic review and causal process diagram. International Journal of Environmental Research and Public health, 12(10), 13251‑13275.
↩
Vodden, K., & Cunsolo, A. (2021). Rural and Remote Communities. In F. J. Warren & N. Lulham (Eds.), Canada in a Changing Climate: National Issues Report. Ottawa, ON: Government of Canada. Retrieved from https://changingclimate.ca/national-issues/ ↩
Vonk, J. E., Tank, S. E., Bowden, W. B., Laurion, I., Vincent, W. F., Alekseychik, P., Amyot, M., Billet, M., Canario, J., & Cory, R. M. (2015). Reviews and syntheses : Effects of permafrost thaw on Arctic aquatic ecosystems. Biogeosciences, 12(23), 7129‑7167.
↩
Vutcovici, M., Goldberg, M. S., & Valois, M.-F. (2014). Effects of diurnal variations in temperature on non-accidental mortality among the elderly population of Montreal, Quebec, 1984–2007. International Journal of Biometeorology, 58(5), 843‑852.
↩
Wachinger, G., Renn, O., Begg, C., & Kuhlicke, C. (2013). The risk perception paradox—Implications for governance and communication of natural hazards. Risk analysis, 33(6), 1049‑1065.
↩
Wai, K.-M., Yu, P. K. N., & Lam, K.-S. (2015). Reduction of solar UV radiation due to urban high-rise buildings – a coupled modelling study. PLoS ONE, 10(8), e0135562. https://doi.org/10.1371/journal.pone.0135562 ↩
Walder, D. J., Laplante, D. R., Sousa-Pires, A., Veru, F., Brunet, A., & King, S. (2014). Prenatal maternal stress predicts autism traits in 61/2 year-old children : Project Ice Storm. Psychiatry Research, 219(2), 353‑360. https://doi.org/10.1016/j.psychres.2014.04.034 ↩
Wang, L., Liu, T., Hu, M., Zeng, W., Zhang, Y., Rutherford, S., Lin, H., Xiao, J., Yin, P., Liu, J., Chu, C., Tong, S., Ma, W., & Zhou, M. (2016a). The impact of cold spells on mortality and effect modification by cold spell characteristics. Scientific Reports, 6, 38380. https://doi.org/10.1038/srep38380 ↩
Wang, X., Lavigne, E., Ouellette-Kuntz, H., & Chen, B. E. (2014). Acute impacts of extreme temperature exposure on emergency room admissions related to mental and behavior disorders in Toronto, Canada. Journal of Affective Disorders, 155, 154‑161.
↩
Wang, Yan., Bobb, J. F., Papi, B., Wang, Y., Kosheleva, A., Di, Q., Schwartz, J. D., & Dominici, F. (2016b). Heat stroke admissions during heat waves in 1,916 US counties for the period from 1999 to 2010 and their effect modifiers. Environmental Health, 15(1), 83. https://doi.org/10.1186/s12940-016-0167-3 ↩
Wang, Yupeng., Berardi, U., & Akbari, H. (2015). Comparing the effects of urban heat island mitigation strategies for Toronto, Canada. Energy and Buildings, 114, 2‑19.
↩
Wang, Yuxuan., Xie, Y., Dong, W., Ming, Y., Wang, J., & Shen, L. (2017). Adverse effects of increasing drought on air quality via natural processes. Atmospheric Chemistry and Physics, 17(20), 12827‑12843. https://doi.org/10.5194/acp-17-12827-2017 ↩
Warren, F. & Lulham, N. (Eds.). (2021). Canada in a Changing Climate: National Issues Report. Ottawa, ON: Government of Canada. Retrieved from http://www.ChangingClimate.ca/National-Issues ↩
Warsini, S., West, C., Ed, G. D., Res Meth, G. C., Mills, J., & Usher, K. (2014). The psychosocial impact of natural disasters among adult survivors : An integrative review. Issues in Mental Health Nursing, 35(6), 420‑436.
↩
Watson, M., Holman, D. M., & Maguire-Eisen, M. (2016). Ultraviolet radiation exposure and its impact on skin cancer risk. Seminars in Oncology Nursing, 32(3), 241‑254. https://doi.org/10.1016/j.soncn.2016.05.005 ↩
Weinstein, J. M., Yarnold, P. R., & Hornung, R. L. (2001). Parental knowledge and practice of primary skin cancer prevention : Gaps and solutions. Pediatric Dermatology, 18(6), 473‑477. https://doi.org/10.1046/j.1525-1470.2001.1861996.x ↩
Weller, R. B. (2017). The health benefits of UV radiation exposure through vitamin D production or non-vitamin D pathways. Blood pressure and cardiovascular disease. Photochemical & Photobiological Sciences, 16(3), 374‑380.
↩
Wheaton, E., Kulshreshtha, S., Wittrock, V., & Koshida, G. (2008). Dry times : Hard lessons from the Canadian drought of 2001 and 2002. The Canadian Geographer = Le Géographe Canadien, 52(2), 241‑262. doi:10.1111/j.1541-0064.2008.00211.x
↩
Williams, S., Hanson-Easey, S., Robinson, G., Pisaniello, D., Newbury, J., Saniotis, A., & Bi, P. (2017). Heat adaptation and place : Experiences in South Australian rural communities. Regional environmental change, 17(1), 273‑283.
↩
Willoughby, M., Kipsaina, C., Ferrah, N., Blau, S., Bugeja, L., Ranson, D., & Ibrahim, J. E. (2017). Mortality in nursing homes following emergency evacuation : A systematic review. Journal of the American Medical Directors Association, 18(8), 664‑670.
↩
Wintermeyer, E., Ihle, C., Ehnert, S., Stöckle, U., Ochs, G., de Zwart, P., Flesch, I., Bahrs, C., & Nussler, A. K. (2016). Crucial Role of Vitamin D in the Musculoskeletal System. Nutrients, 8(6), 319. https://doi.org/10.3390/nu8060319 ↩
Witham, M. D., Donnan, P. T., Vadiveloo, T., Sniehotta, F. F., Crombie, I. K., Feng, Z., & McMurdo, M. E. T. (2014). Association of day length and weather conditions with physical activity levels in older community dwelling people. PLOS ONE, 9(1), e85331. https://doi.org/10.1371/journal.pone.0085331 ↩
World Health Organization. (2013b). Review of the 2012-2013 winter influenza season, northern hemisphere. Weekly Epidemiological Record, 88(22), 225 – 232. https://apps.who.int/iris/handle/10665/242074 ↩
Wotton, B. M., Flannigan, M. D., & Marshall, G. A. (2017). Potential climate change impacts on fire intensity and key wildfire suppression thresholds in Canada. Environmental Research Letters, 12(9), 095003. https://doi.org/10.1088/1748-9326/aa7e6e ↩
Wouters, H., De Ridder, K., Poelmans, L., Willems, P., Brouwers, J., Hosseinzadehtalaei, P., Tabari, H., Vanden Broucke, S., van Lipzig, N. P. M., & Demuzere, M. (2017). Heat stress increase under climate change twice as large in cities as in rural areas : A study for a densely populated midlatitude maritime region. Geophysical Research Letters, 44(17), 8997‑9007. https://doi.org/10.1002/2017GL074889 ↩
Wright, C. J., Sargeant, J. M., Edge, V. L., Ford, J. D., Farahbakhsh, K., RICG, Shiwak, I., Flowers, C., IHACC Research Team, & Harper, S. L. (2018). Water quality and health in northern Canada: stored drinking water and acute gastrointestinal illness in Labrador Inuit. Environmental Science and Pollution Research International, 25(33), 32975–32987. https://doi.org/10.1007/s11356-017-9695-9 ↩
Xiang, J., Bi, P., Pisaniello, D., & Hansen, A. (2014). Health impacts of workplace heat exposure : An epidemiological review. Industrial Health, 52(2), 91‑101. https://doi.org/10.2486/indhealth.2012-0145 ↩
Xu, Z., Etzel, R. A., Su, H., Huang, C., Guo, Y., & Tong, S. (2012). Impact of ambient temperature on children’s health : A systematic review. Environmental Research, 117, 120‑131. https://doi.org/10.1016/j.envres.2012.07.002 ↩
Xu, Z., FitzGerald, G., Guo, Y., Jalaludin, B., & Tong, S. (2016). Impact of heatwave on mortality under different heatwave definitions : A systematic review and meta-analysis. Environment International, 89, 193‑203.
↩
Xu, Z., Liu, Y., Ma, Z., Li, S., Hu, W., & Tong, S. (2014a). Impact of temperature on childhood pneumonia estimated from satellite remote sensing. Environmental Research, 132, 334‑341. https://doi.org/10.1016/j.envres.2014.04.021 ↩
Xu, Z., Sheffield, P. E., Su, H., Wang, X., Bi, Y., & Tong, S. (2014b). The impact of heat waves on children’s health : A systematic review. International Journal of Biometeorology, 58(2), 239‑247. https://doi.org/10.1007/s00484-013-0655-x ↩
Yan, B., Chebana, F., Masselot, P., Campagna, C., Gosselin, P., Ouarda, T. B., & Lavigne, E. (2020). A cold-health watch and warning system, applied to the province of Quebec (Canada). Science of The Total Environment, 741, 140188. 10.1016/j.scitotenv.2020.140188 ↩
Yao, J., Brauer, M., & Henderson, S. B. (2013). Evaluation of a wildfire smoke forecasting system as a tool for public health protection. Environmental health perspectives, 121(10), 1142.
↩
Yao, J., Stieb, D. M., Taylor, E., & Henderson, S. B. (2020). Assessment of the Air Quality Health Index (AQHI) and four alternate AQHI-Plus amendments for wildfire seasons in British Columbia. Canadian Journal of Public Health = Revue Canadienne de Sante Publique, 111(1), 96–106. https://doi.org/10.17269/s41997-019-00237-w ↩
Ye, X., Wolff, R., Yu, W., Vaneckova, P., Pan, X., & Tong, S. (2012). Ambient temperature and morbidity : A review of epidemiological evidence. Environmental Health Perspectives, 120(1), 19‑28. https://doi.org/10.1289/ehp.1003198 ↩
Youl, P. H., Janda, M., & Kimlin, M. (2009). Vitamin D and sun protection : The impact of mixed public health messages in Australia. International Journal of Cancer, 124(8), 1963‑1970. https://doi.org/10.1002/ijc.24154 ↩
Young, I., Smith, B. A., & Fazil, A. (2015). A systematic review and meta-analysis of the effects of extreme weather events and other weather-related variables on Cryptosporidium and Giardia in fresh surface waters. Journal of Water and Health, 13(1), 1‑17.
↩
Youssouf, H., Liousse, C., Roblou, L., Assamoi, E.-M., Salonen, R. O., Maesano, C., Banerjee, S., & Annesi-Maesano, I. (2014). Non-accidental health impacts of wildfire smoke. International Journal of Environmental Research and Public Health, 11(11), 11772‑11804.
↩
Yu, W., Mengersen, K., Wang, X., Ye, X., Guo, Y., Pan, X., & Tong, S. (2012). Daily average temperature and mortality among the elderly : A meta-analysis and systematic review of epidemiological evidence. International Journal of Biometeorology, 56(4), 569‑581. https://doi.org/10.1007/s00484-011-0497-3 ↩
Yusa, A., Berry, P., J. Cheng, J., Ogden, N., Bonsal, B., Stewart, R., & Waldick, R. (2015). Climate change, drought and human health in Canada. International Journal of Environmental Research and Public Health, 12(7), 8359‑8412. https://doi.org/10.3390/ijerph120708359 ↩
Zeng, J., Zhang, X., Yang, J., Bao, J., Xiang, H., Dear, K., Liu, Q., Lin, S., Lawrence, W. R., & Lin, A. (2017). Humidity may modify the relationship between temperature and cardiovascular mortality in Zhejiang Province, China. International Journal of Environmental Research and Public Health, 14(11), 1383.
↩
Zhang, X., Flato, G., Kirchmeier-Young, M., Vincent, L., Wan, H., Wang, X., Rong, R., Fyfe, J., Li, G., & Kharin, V. V. (2019). Changes in temperature and precipitation across Canada. In E. Bush & D.S. Lemmen (Eds.), Canada’s Changing Climate Report. Ottawa, ON: Government of Canada. Retrieved from https://changingclimate.ca/CCCR2019 ↩
Zimmermann, E., Bracalenti, L., Piacentini, R., & Inostroza, L. (2016). Urban flood risk reduction by increasing green areas for adaptation to climate change. Procedia Engineering, 161, 2241‑2246. https://doi.org/10.1016/j.proeng.2016.08.822 ↩
Zivin, J. G., & Neidell, M. (2014). Temperature and the allocation of time : Implications for climate change. Journal of Labor Economics, 32(1), 1‑26. https://doi.org/10.1086/671766 ↩
Zscheischler, J., Westra, S., Van Den Hurk, B. J., Seneviratne, S. I., Ward, P. J., Pitman, A., AghaKouchak, A., Bresch, D.N., Leonard, M., Wahl, T., & Zhang, X. (2018). Future climate risk from compound events. Nature Climate Change, 8(6), 469-477. https://doi.org/10.1038/s41558-018-0156-3 ↩