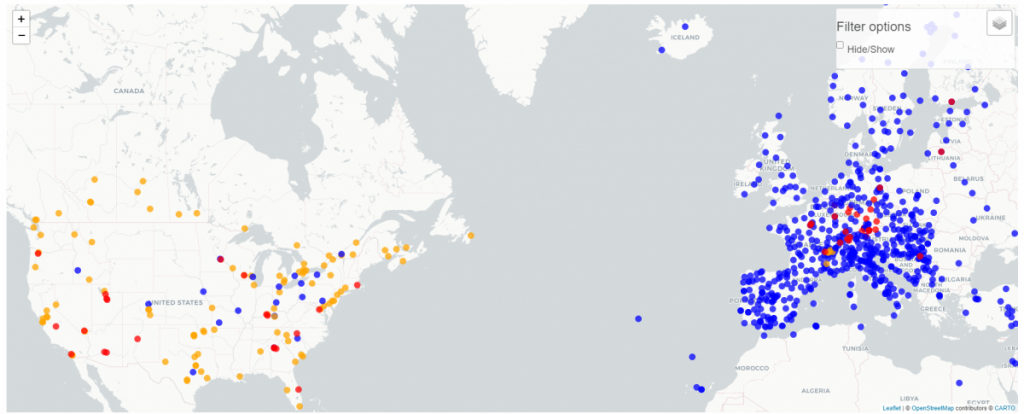
Blue points (Hirst sampling station), red (automatic sampling station), orange (other manual sampling station).
Buters et al., 2018 and https://oteros.shinyapps.io/pollen_map/.