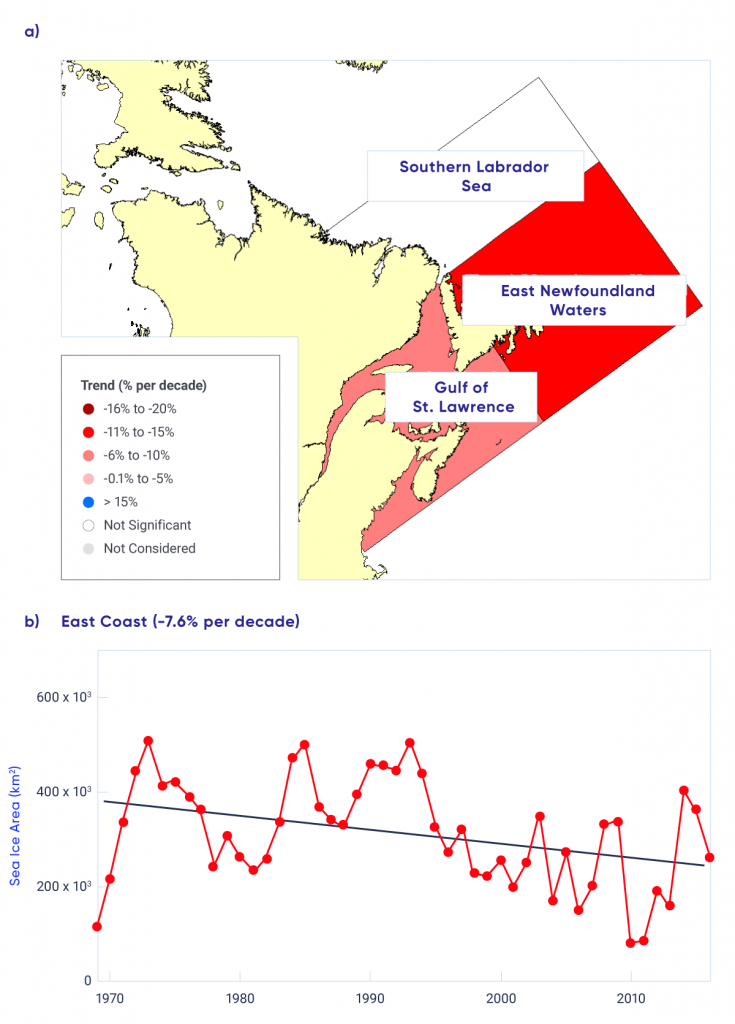
Figure-5.10: East coast winter season sea ice area trends, 1969–2016
(a) Map of average January–March sea ice area trends for subregions of the east coast and (b) time series of average January–March sea ice area trends for the entire region, 1969–2016.