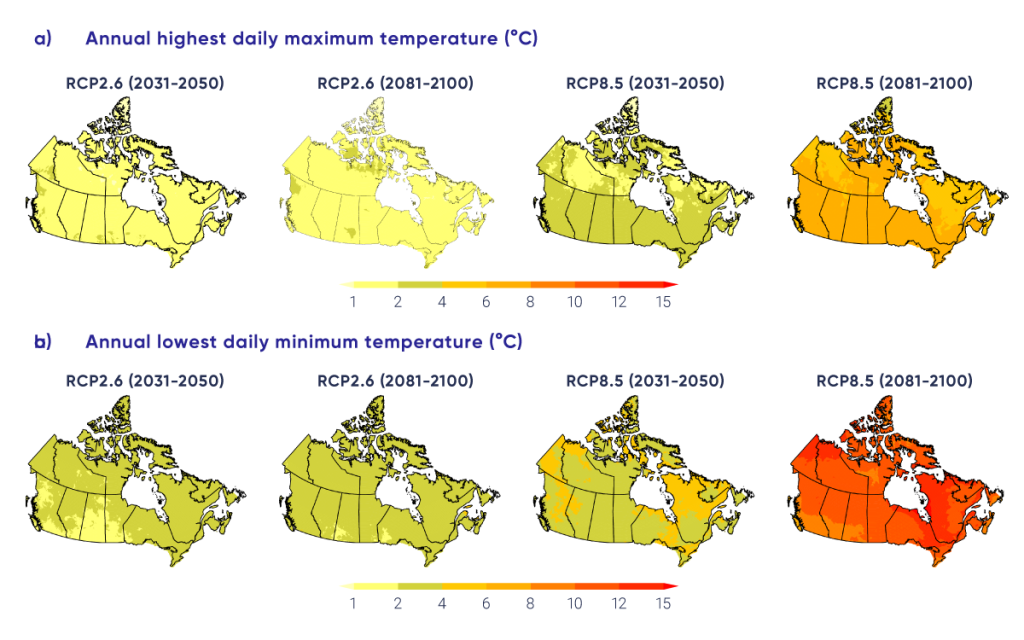
Multi-model median projected changes in (a) annual highest daily maximum temperature, (b) annual lowest daily minimum temperature). All maps are based on statistically downscaled and bias-corrected temperature data from simulations by 24 Earth system models. The two left-hand panels show projections for 2031–2050 and 2081-2100 under a low emission scenario (RCP2.6), while the two right-hand panels show projections for 2031–2050 and 2081–2100 under a high emission scenario (RCP8.5), respectively.