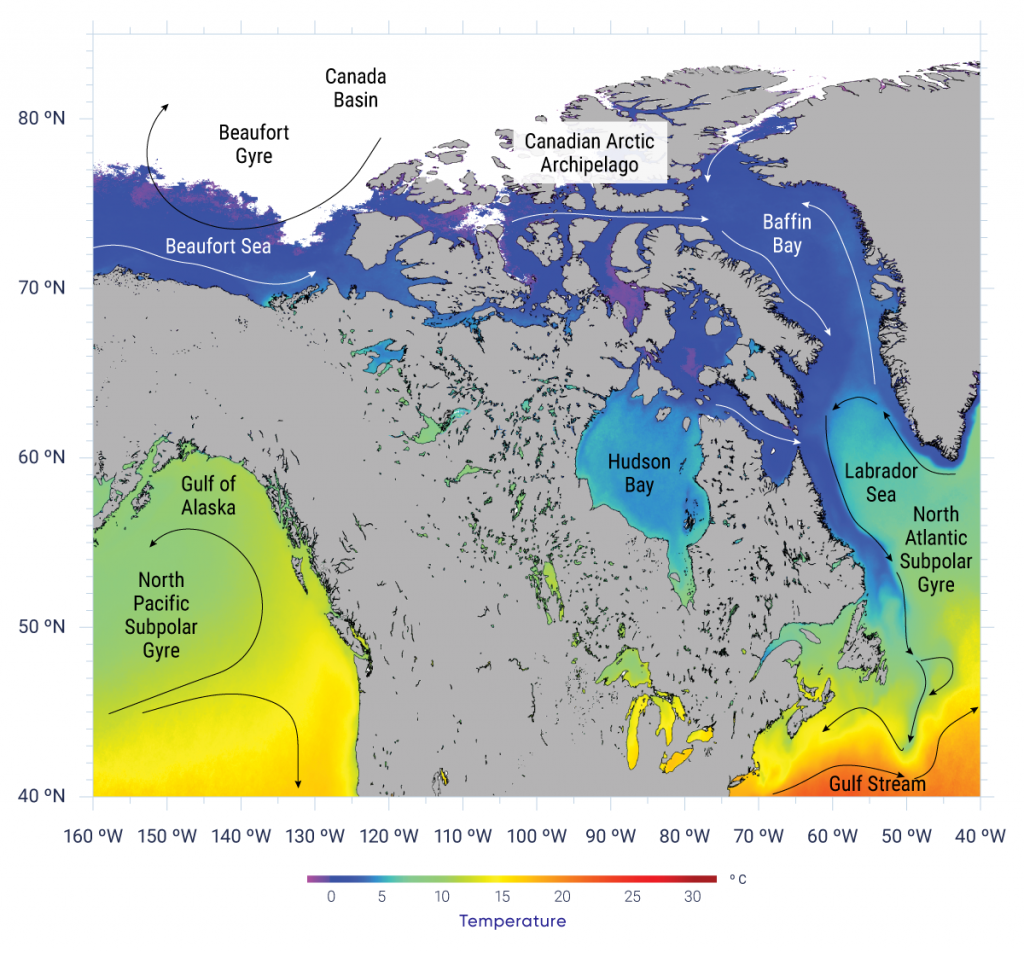
Fall (September–November) average sea surface temperature (1985–2013) in the oceans surrounding Canada, based on advanced very-high-resolution radiometer satellite infrared imagery. The lines (both black and white) with arrowheads represent the general direction of upper-ocean currents. Ice-covered marine areas are coloured white.