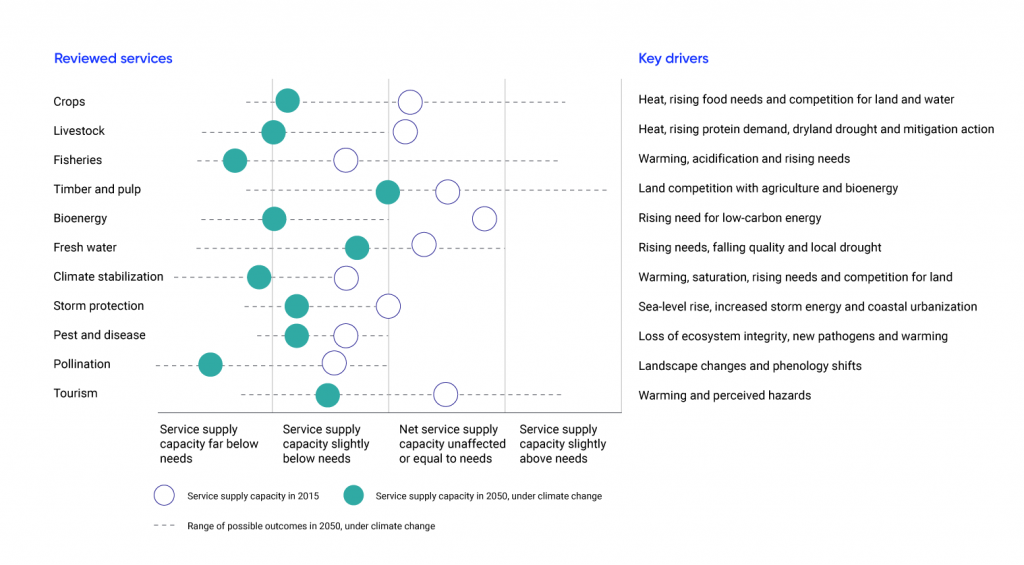
A visual summary of the relationship between supply and demand for the ecosystem services surveyed by Scholes (2016), both at the present time (open circles) and around 2050 (filled circles), under climate change. The range of possible outcomes around the year 2050 is depicted with a horizontal bar.
Source
Adapted from Scholes, 2016.