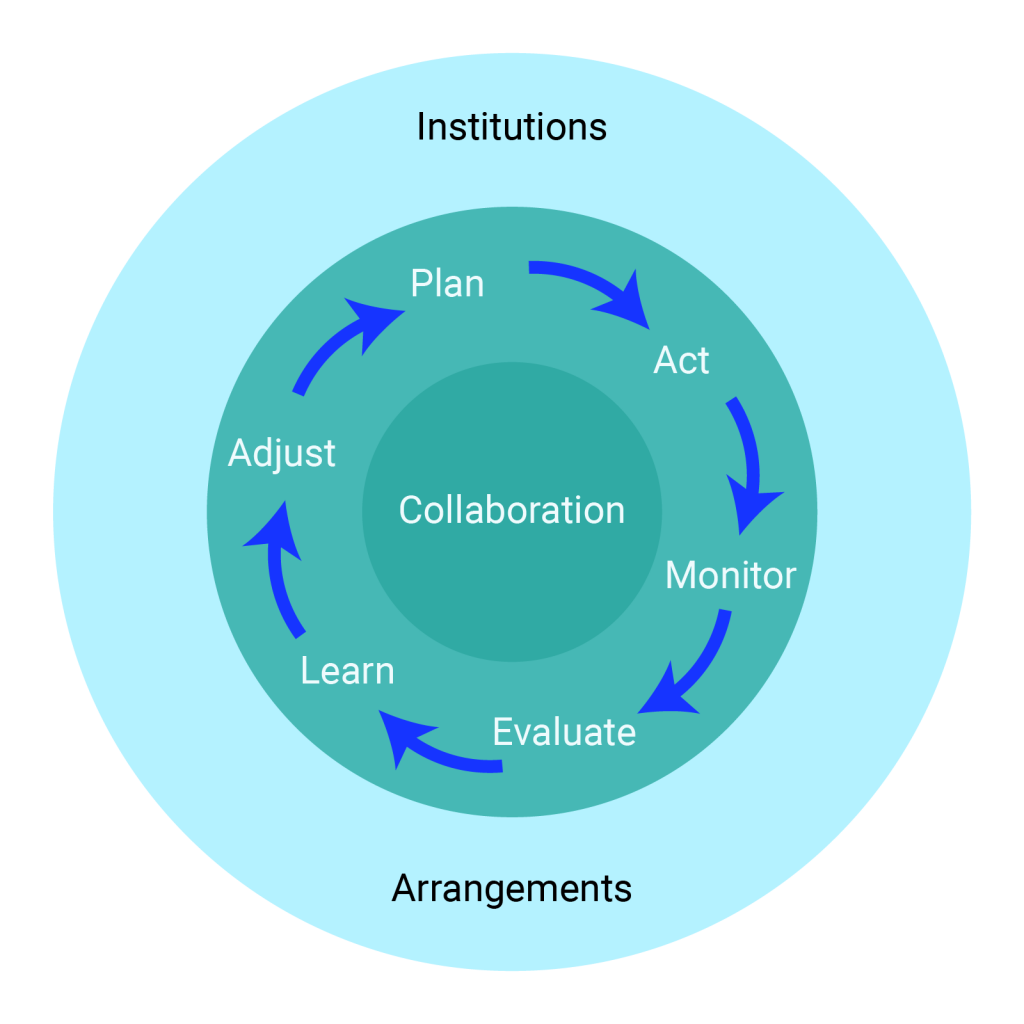
Diagram illustrating the adaptive management cycle.
Adapted from International Great Lakes–St. Lawrence River Adaptive Management Task Team, 2013.