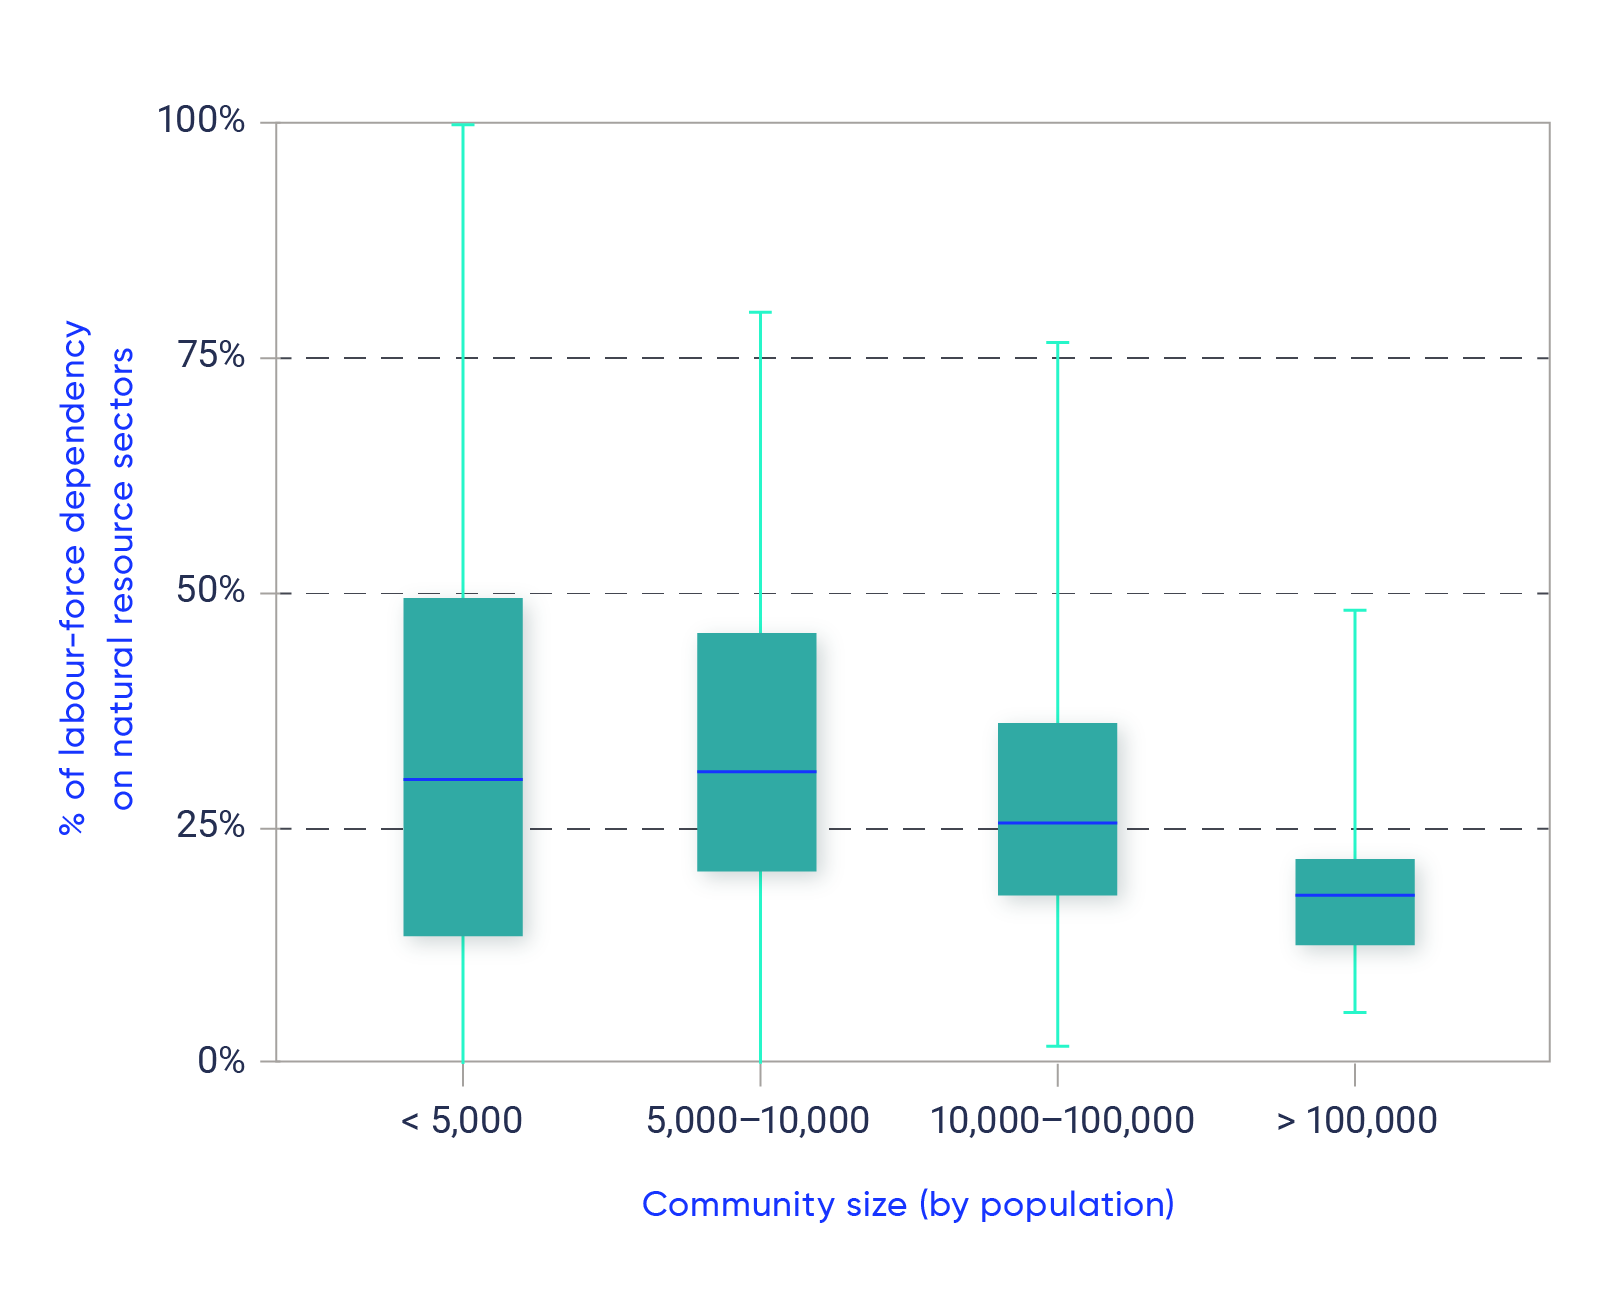
Graph illustrating the average labour-force dependency of different-size communities in Canada on natural resource sectors, as a percent of base economic sector income, for the period 2001–2016. Base economic sectors include natural resources (fisheries, agriculture, forestry, minerals, and petroleum and coal), utilities and construction, and manufacturing. Communities are grouped according to four different population sizes: 1) less than 5,000; 2) 5,000–10,000; 3) 10,000–100,000; and 4) greater than 100,000. The boxes indicate the maximum and minimum values for 95% of the data, the solid line within each box indicates the average value and the vertical lines extending from the boxes indicate the full data range. The graph shows that the labour force in communities with smaller populations tends to be more dependent on natural resource sectors than in communities with larger populations.
Source
Eddy et al., 2020a, b.