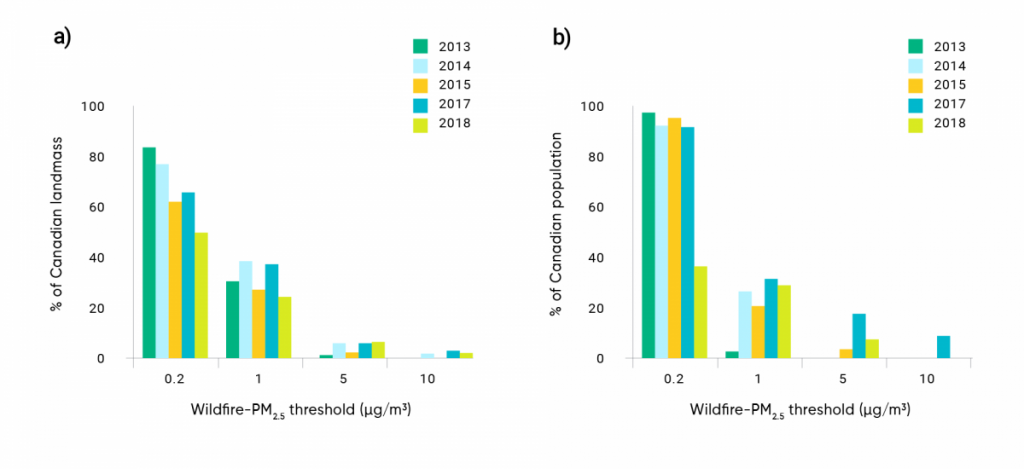
Figure 5.3: Percent of Canadian landmass and of Canadian population with average (May to September) wildfire-PM2.5 concentrations above given thresholds
Panel A shows the percent of Canadian landmass with average May to September wildfire-PM2.5 concentrations above given thresholds, and panel B shows the percent of population with May to September wildfire-PM2.5 concentrations above given thresholds.