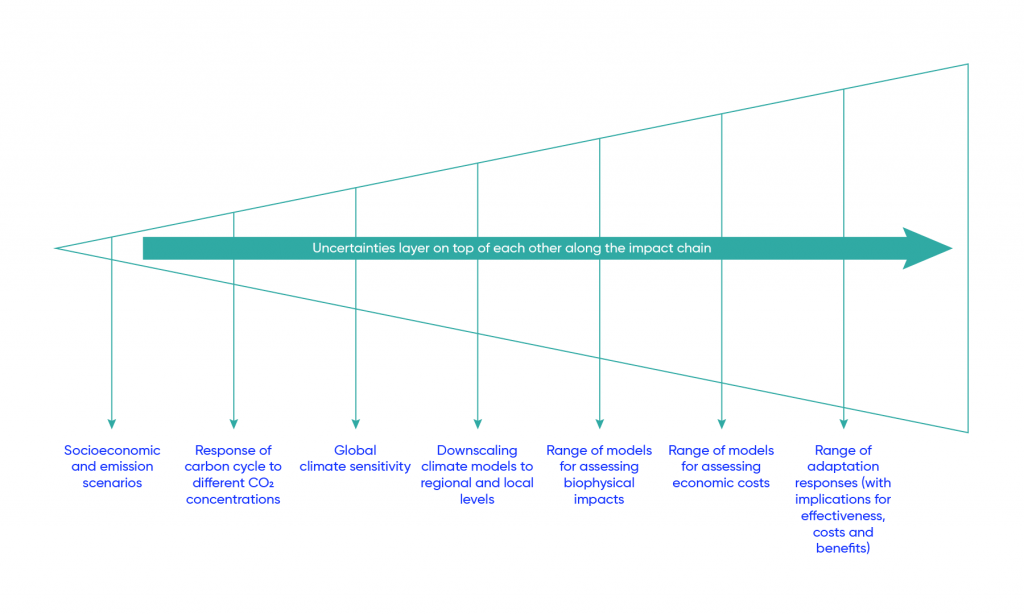
Illustration of ballooning uncertainties along a “science-first” causal impact chain. The level of uncertainty increases as one moves along the impact chain (from left to right), leading to a high level of uncertainty in the cost and benefit estimates at the end of the chain.
Source
Adapted from Fussel, 2003.