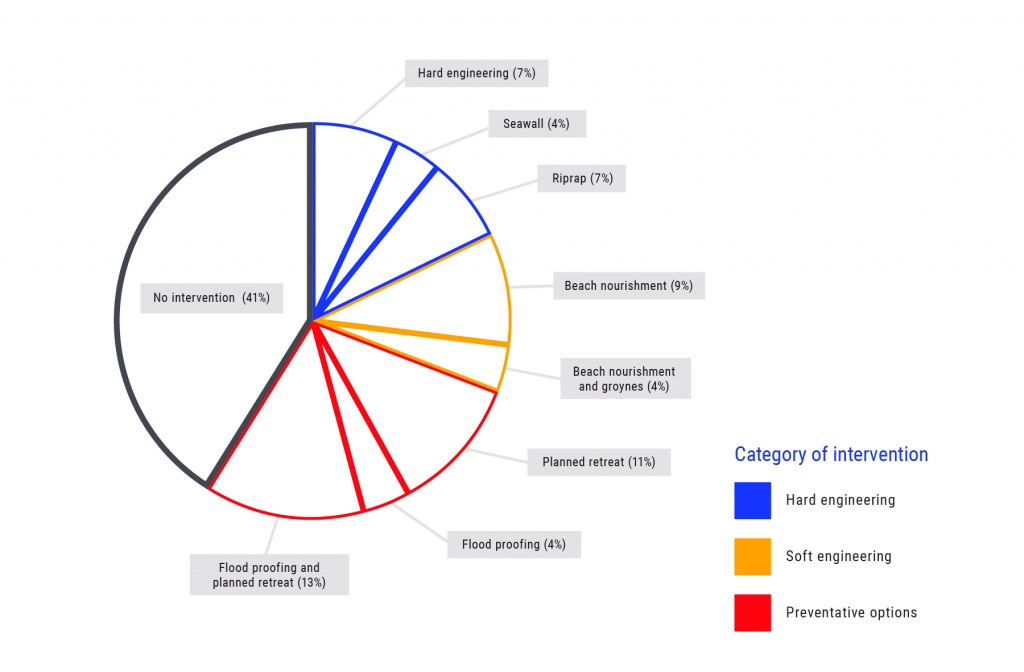
Distribution of the best performing adaptation actions by category of intervention, based on a cost-benefit analysis of 46 coastal segments across 11 case study sites in Quebec and Atlantic Canada.
Adapted from Boyer-Villemaire et al., 2016.