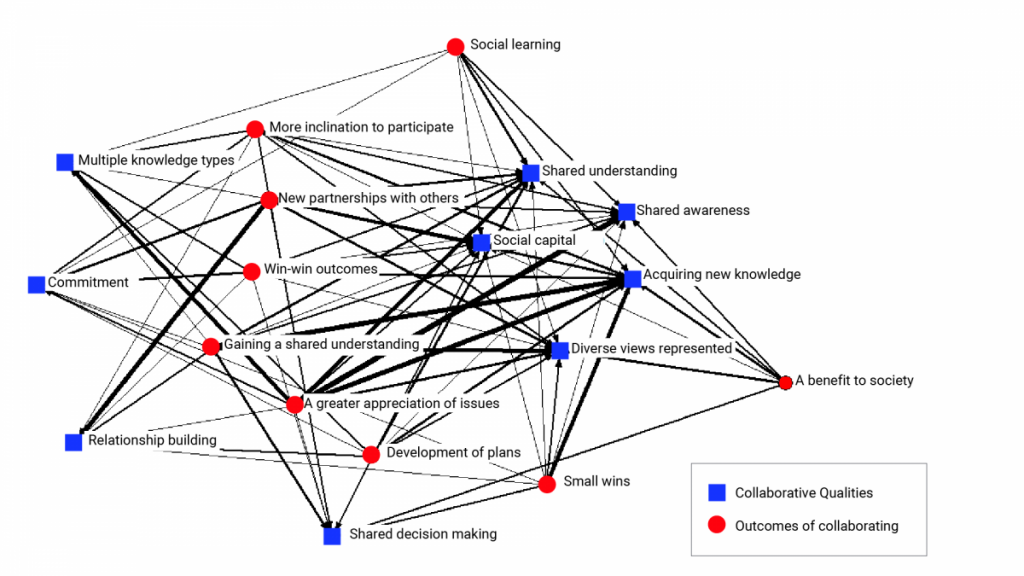
Network diagrams were used to display the relationships between qualities of collaboration in the process and achieved outcomes in the Tantramar/Chignecto Climate Change Adaptation Collaborative case study. The bold lines highlight linkages that were selected most often by participants, indicating the qualities (blue) that were considered to be the most influential for informing certain outcomes from the collaboration (red). The qualities and outcomes closer to the centre of the diagram are those that were deemed by participants as being most important.
Source
Feist et al., 2020; Feist, 2018.