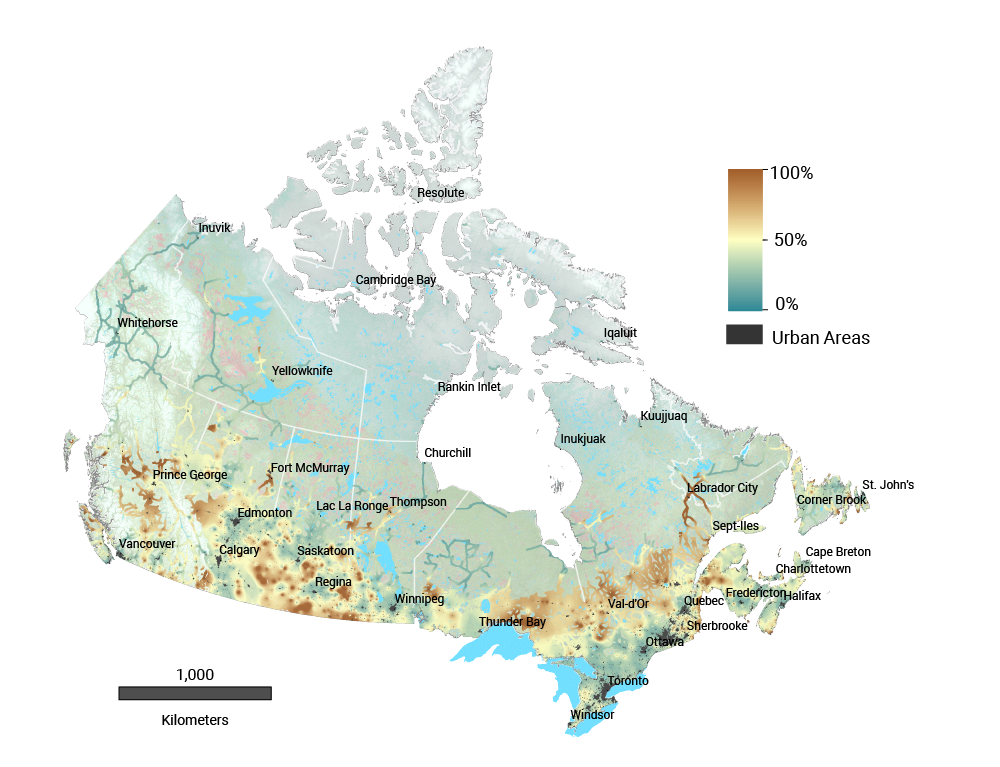
Map displaying the average labour-force dependency of communities across Canada on natural resource sectors—including agriculture, fisheries, forestry, energy and mining—for the period 2001–2016. The colours on the map range from blue to red, where blue signifies low dependency, mostly in and surrounding large urban areas, and red indicates high dependency, which is mostly in rural and remote areas. The map shows that natural resource sectors provide as much as 50–100% of the base economic sector income for many rural and remote communities across Canada. Base economic sectors include natural resources (fisheries, agriculture, forestry, minerals, and petroleum and coal), utilities and construction, and manufacturing.
Source
Eddy et al., 2020a, b.