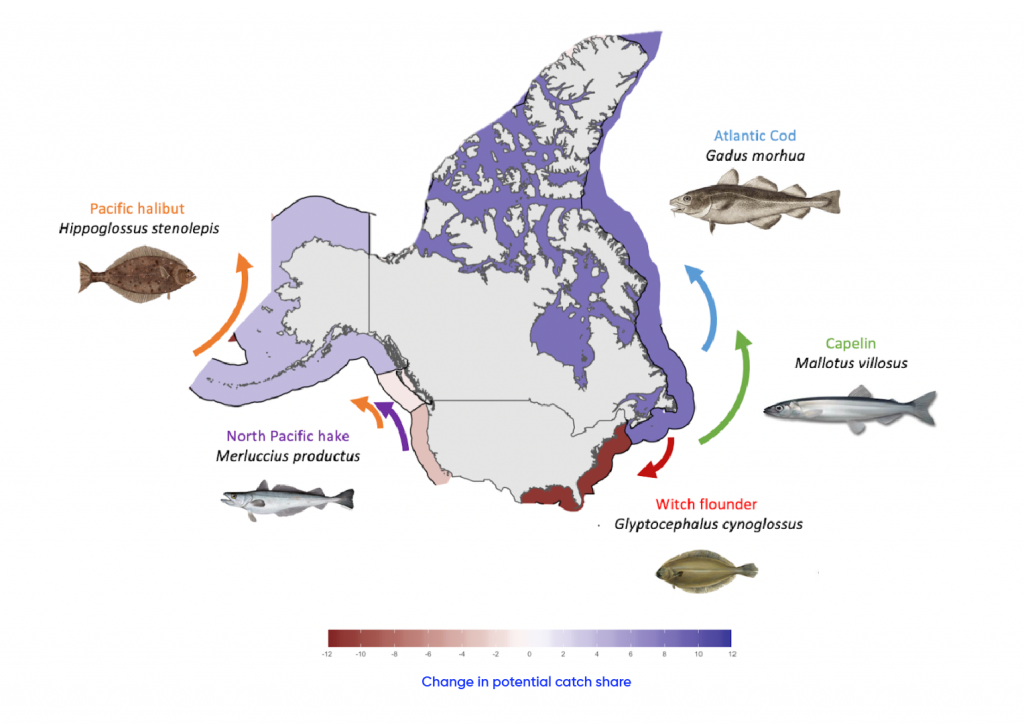
Map of projected shifts in the distribution of representative commercial transboundary fish species targeted by American and Canadian fisheries by 2050 under a high emissions scenario, relative to 2014. The coloured scale indicates the projected change in catch shares within the Exclusive Economic Zone (red = decline; purple = increase). The arrows on the map represent the direction of the shift in distribution for these five key fish species.
Source
Adapted from Cheung et al., 2016.