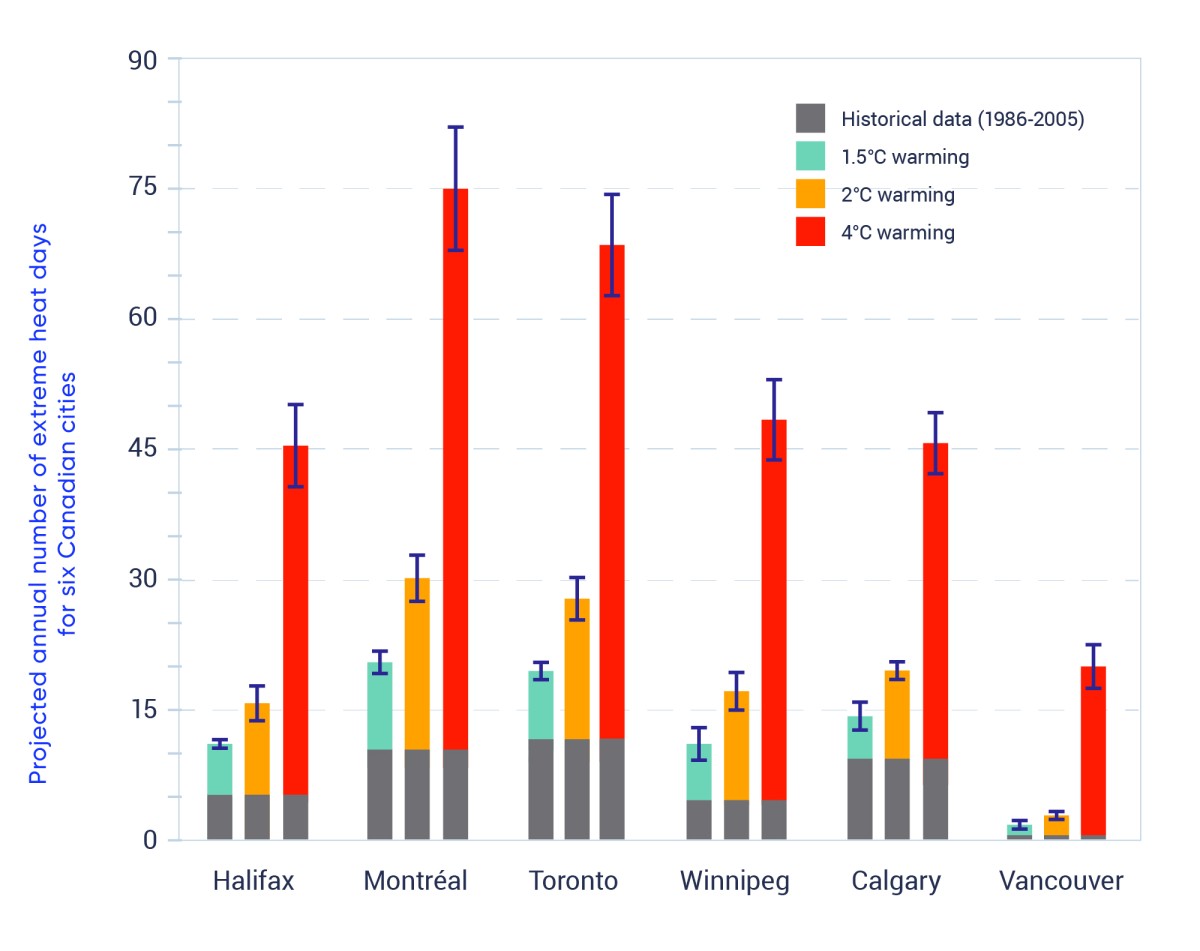
The annual number of extreme heat days projected for six Canadian cities under three warming scenarios: global mean surface temperature of 1.5°C, 2°C, and 4°C above pre-industrial levels. The values are based on statistically downscaled simulations by 24 climate models participating in CMIP5, with the error bars representing the 25th and 75th percentiles, and the grey section showing the number of historical extreme heat days (1986–2005). The threshold for extreme heat differs by city (e.g., Toronto = 31°C, Vancouver = 29°C).
Source
Data source: Environment and Climate Change Canada.