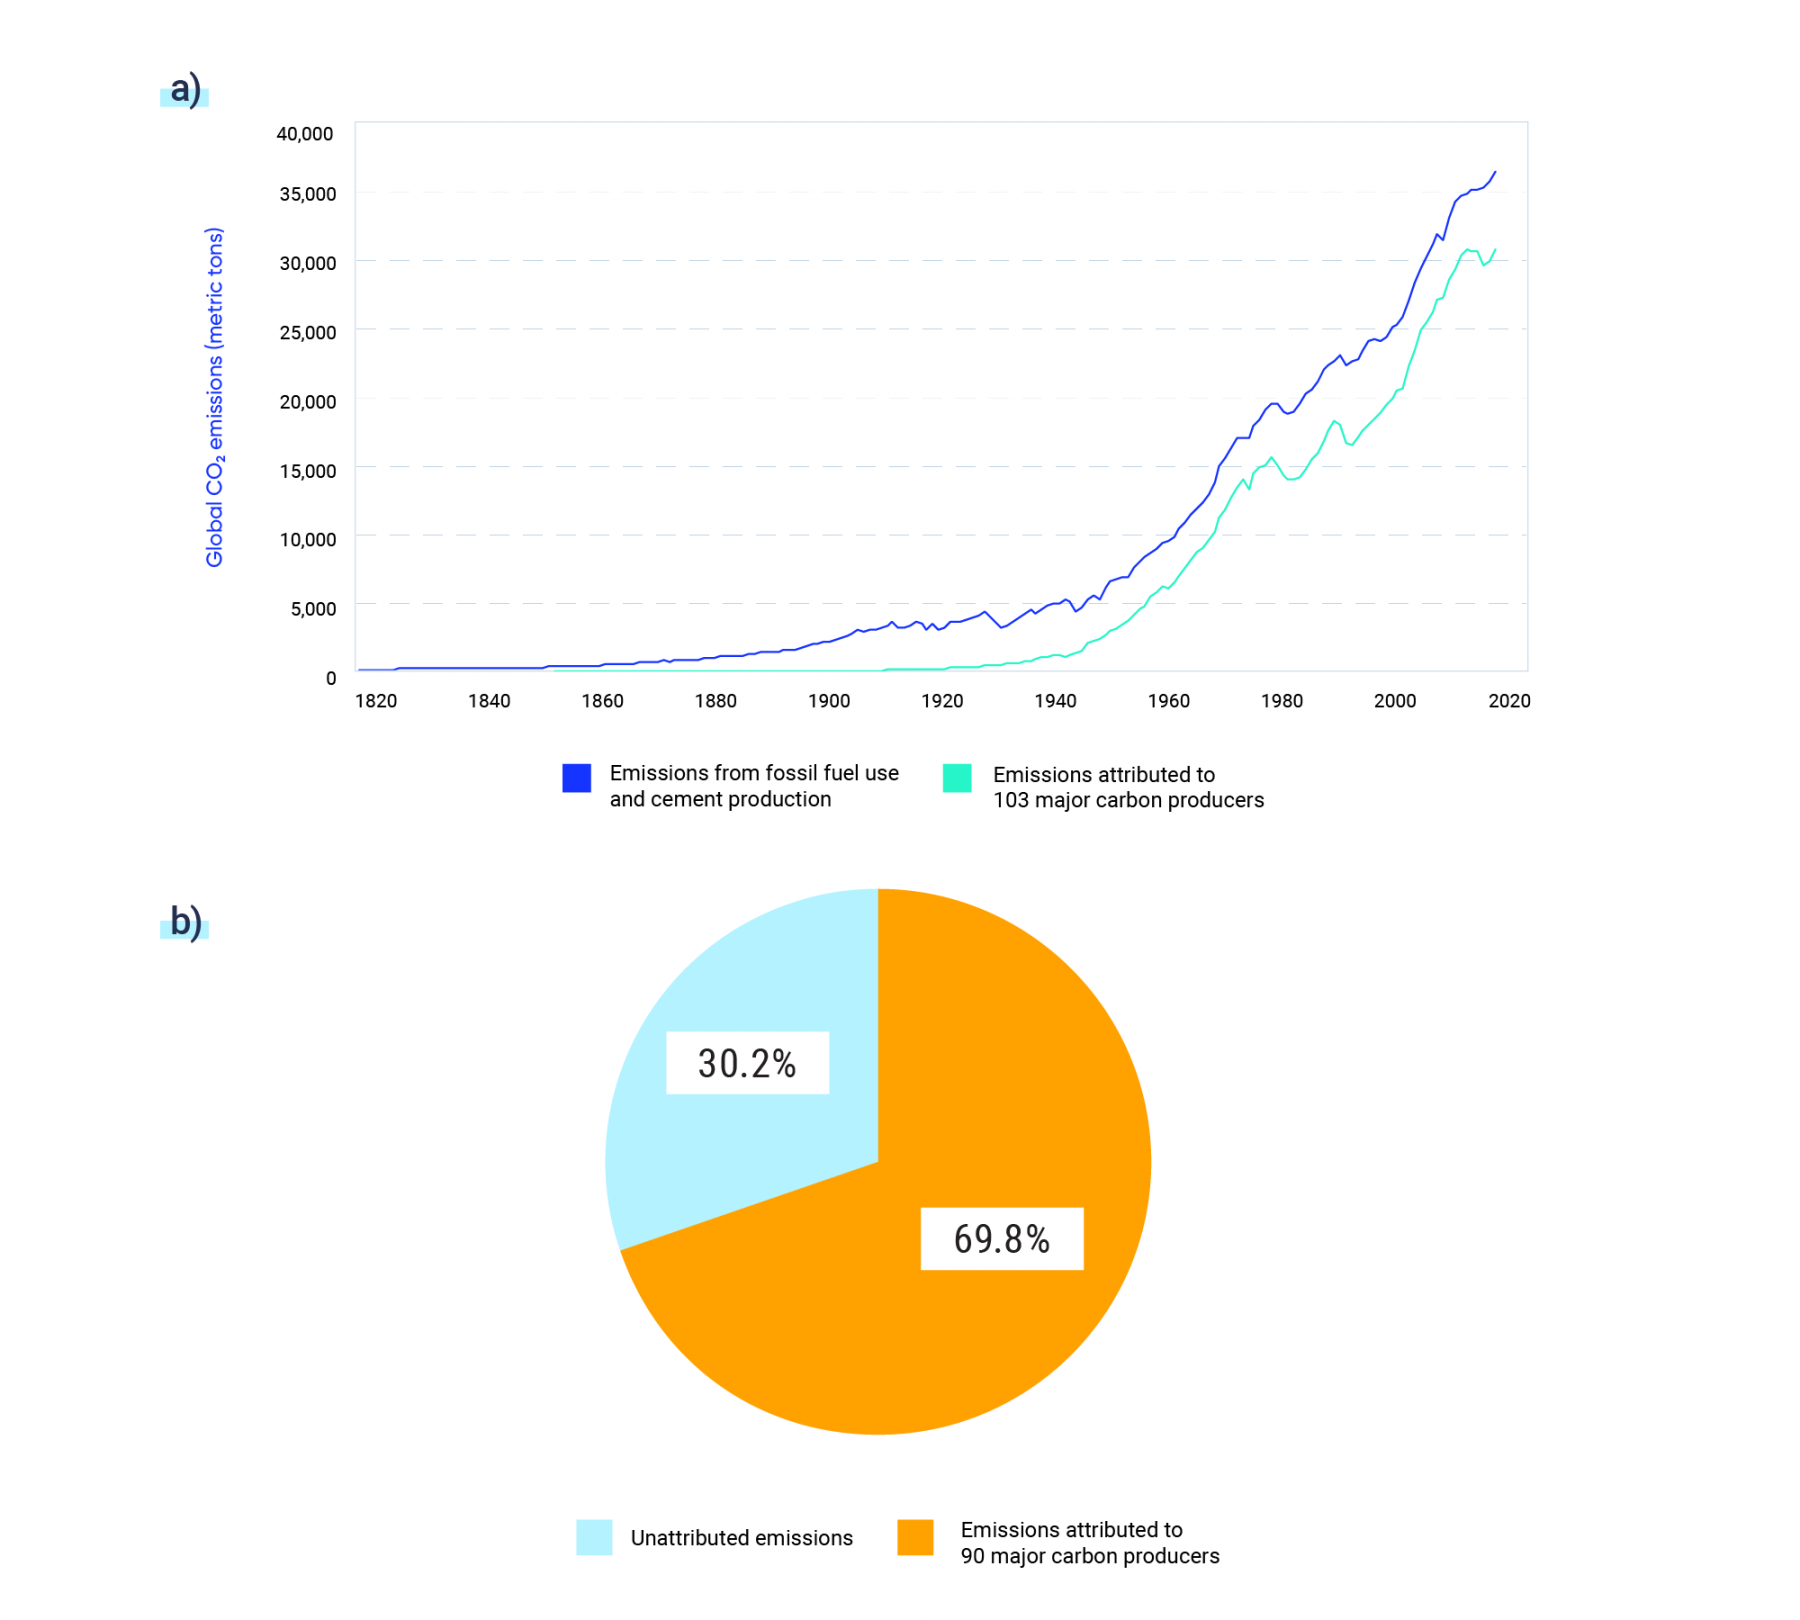
a) Annual global CO2 emissions related to fossil fuel use and cement production for the period 1810–2017 (dark blue) and attributed to 103 major carbon producers (light blue). b) Percentage of global CO2 emissions for the period 1751–2017 produced by major carbon producers (orange) vs. unattributed emissions (light blue).
Source
Adapted from Climate Accountability Institute, 2019.